FlatOut Movings Indicator

☑ FlatOut Movings Robot: フラットを完全制御。トレンドを確実にナビゲート。
移動平均線(ムービング)ベースのインジケーター戦略には、一つの一大悪夢があります。市場がフェーズを変えた瞬間、あなたのデポジットは容赦なく溶け始めます。古典的なムービングはフラット相場で数十回もの偽のクロスシグナルを発生させ、標準的なフィルターは無慈悲に遅延します。あなたは夜な夜なストレスを抱えてターミナルの前に座り込み、値動きのまさに終盤の出尽くした局面でエントリーしてしまうのです。
このソフトウェアは、まさにその具体的な課題を解決するために開発されました。ロボットは絶え間なくチャートをスキャンし、板情報(オーダーブック)のインサイド情報かの如く市場構造を読み解きます。完全に膠着した横ばい相場(ボコウィク)でも、強烈なトレンドの勢い(インパルス)でも、同様に圧倒的な効率で取引を牽引します。システムはまるでメスの如き精度で、真のブレイクアウトと取引レンジ内での偽のダマシ(偽の出入り口)を完璧に切り分けます。
⌛ 相場混沌の時代を生き抜く時間による証明
このソフトの数学的コアは、次々と押し寄せる混沌とした価格暴風雨の10年以上に及ぶサイクルを通過し、検証されています。アルゴリズムは、あらゆる世界的な金融危機や市場の時代の转換期をも耐え抜くように設計されています。
⚡ インパルス・ハンター: ロボットは、価格が最小抵抗線のベクトルに沿って猛スピードで進む「ポイント・オブ・ノーリターン(不可逆点)」で正確に取引にエントリーします。そのエントリーは極めて精緻に計算されているため、ポジションが有害な逆行圧力(ドローダウン)を受けることは原則としてほぼありません。
🤖 シリーズ・ドミネーター(連続制圧型): ロボットに混沌とした迷いは一切ありません。その挙動は厳格な数学的秩序に支配されています。一度トレンドの波を捉えれば、クローズされた取引の緊密かつ途切れのないカスケード(連鎖)を生成します。アルゴリズムは市場の推進力が尽きるまで、次から次へと成功ポジションを構築し、執拗にトレンドにしがみつきます。稀に発生するストップ(損切り)は悲劇ではなく、単なる照準の再キャリブレーションに過ぎません。
↕️ 板情報の双方向スクイーズ: ロボットはLong(買い)でもShort(売り)でも全く同様に効果を発揮します。レポートにおける取引方向の比率は等価です。過去データに都合よく合わせた手動のランダムな過剰最適化(カーブフィッティング)は一切排除されています。
🧲 鉄のGridストラテジスト: 長引くフラット相場や偽 of ダマシが発生した瞬間でも、微小な含み損でポジションをすぐにカットすることはありません。ロボットは「ポジション包囲モード」へと移行し、伸縮自在で分散された注文グリッドを展開します。浮動リスクを冷徹に吸収し、マージンプレッシャー(証拠金への負荷)をトータルコントロール下に維持します。
🎯 冷徹なスナイパー: ソフトウェアは完璧なエントリーポイントをじっと待ち伏せし、卓越した数学的効率性と強力なリカバリーファクター(回復係数)を確実に担保します。
🎁 アルゴリズムを無料で検証せよ
あなたはもう、モニターの前で神経と時間をすり減らし、24時間緊張状態で生活する必要はありません。このテクノロジー・ソリューションは、完全に実戦投入可能な状態に仕上がっています。他人の言葉を鵜呑みにするのは止め、実際の過去データ(ヒストリー)でアルゴリズムを自ら検証してください。
今すぐ、あなたのデポジットを守る絶対的な武器を手に入れてください!

   1. このマーケットページにある「デモをダウンロード」ボタンをクリックします。
   2. ご自身のターミナルでストラテジーテスターを開き、任意のヒストリー期間を選択します。
   3. テストを実行し、システムがどのように市場のノイズを完全に遮断するかをその目で確認してください。


FAQ(よくある質問):

   1. どの通貨ペア用に設定されていますか?
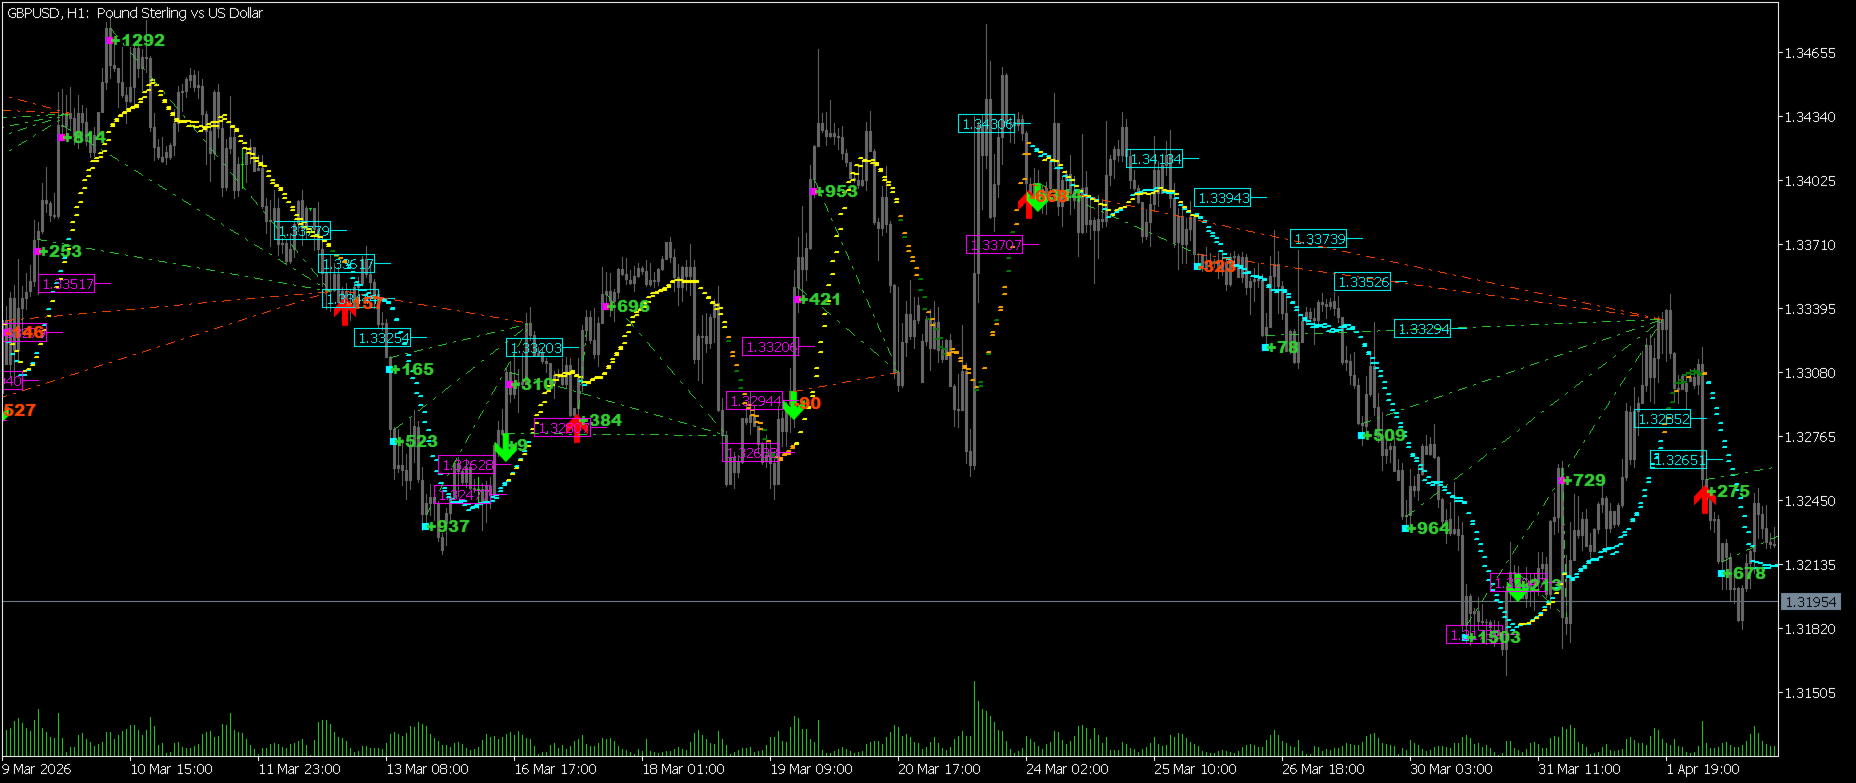
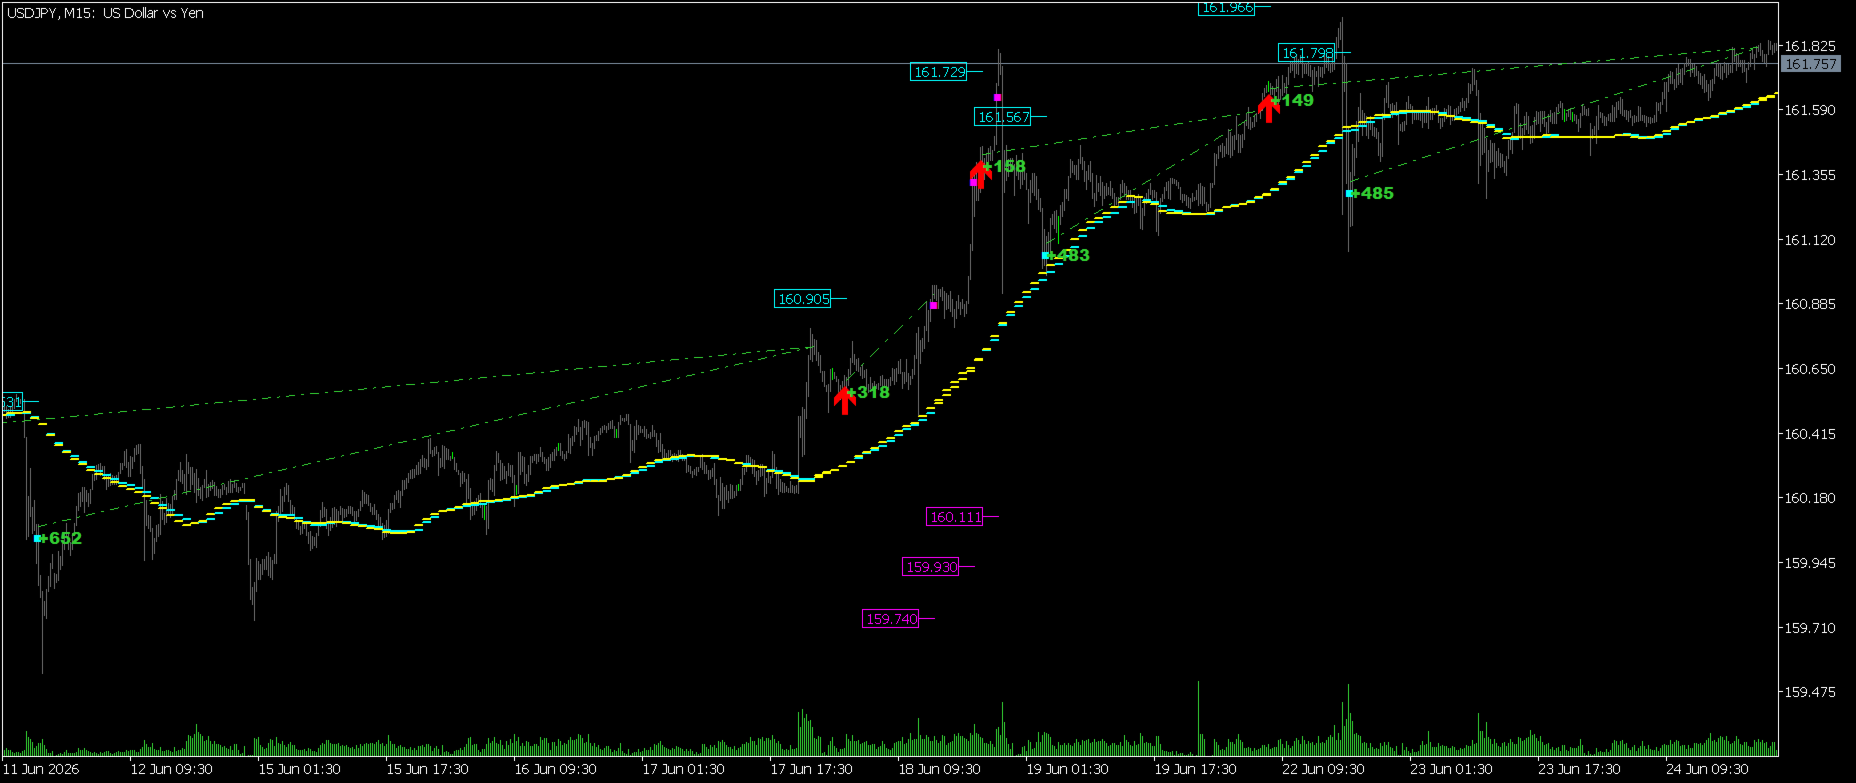
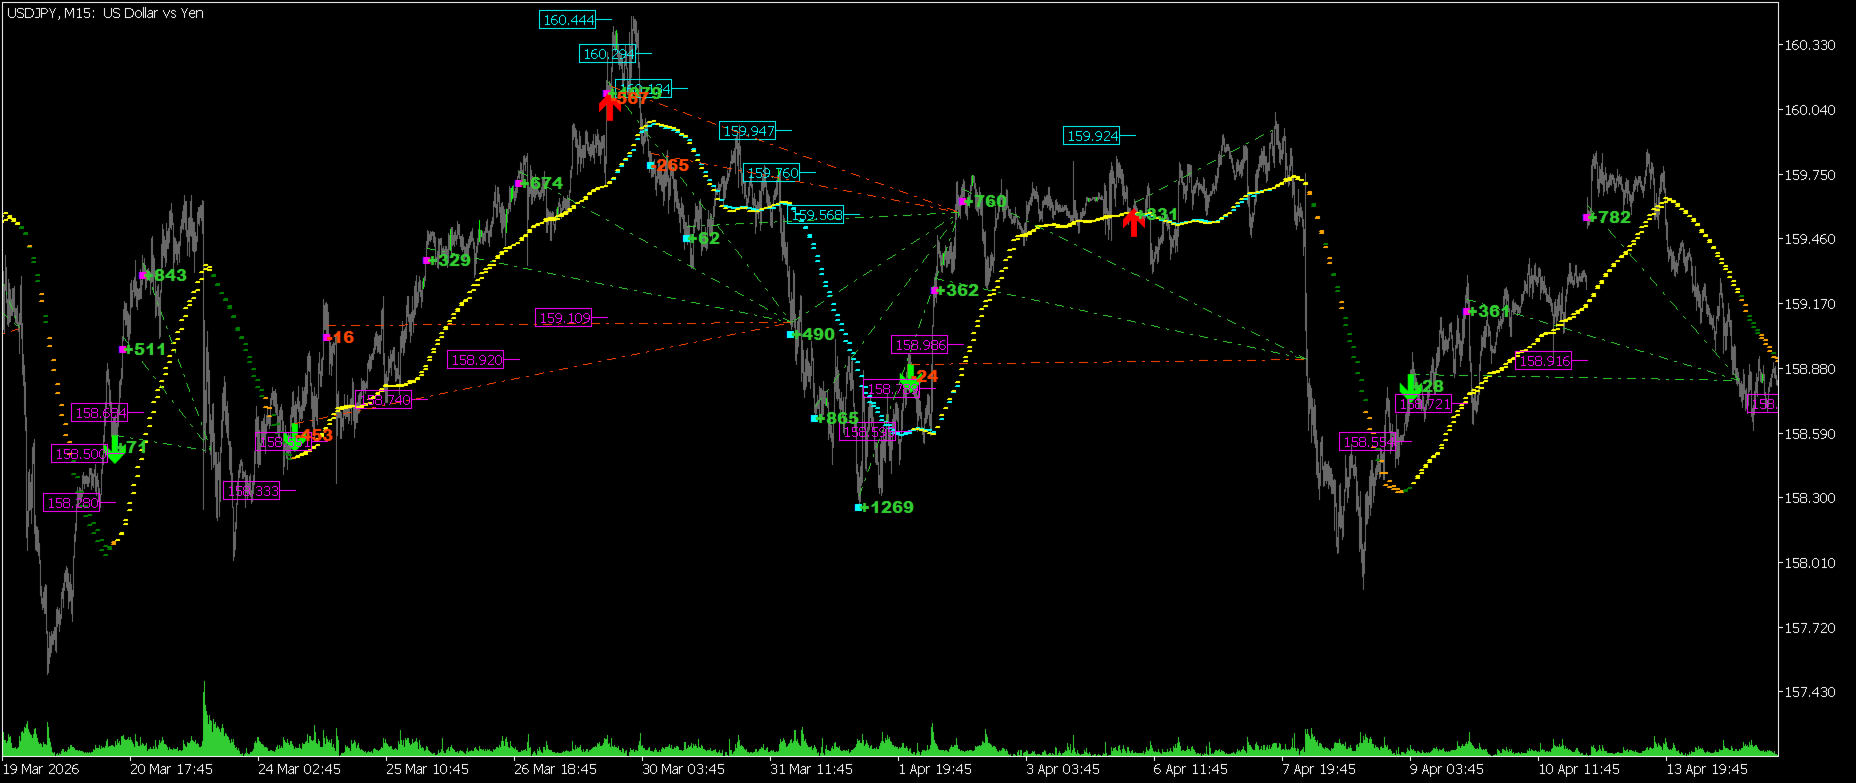
   このIndicatorは技術的にはどの通貨ペアでも動作し、デフォルト設定を使用します。しかし、本製品は EURUSD、GBPUSD、USDJPY での取引に完全に特化して研ぎ澄まされています。まさにこれらのペアにおいて、圧倒的な真の効率性を発揮します。
   2. どのタイムフレームで起動するのがベストですか?
   🦎 アダプティブ・カメレオン: ロボットにとってタイムフレームは単なる光学レンズに過ぎません。短い足(M15、M30、H1)では、超高速連射型のスキャルパーとして機能します。より長い足(H2およびH4)では、ステップを拡大し、市場の密度を強固にフィルタリングされたモノリシックな(一枚岩の)ポジショニング決断へと変貌させます。ロボットはローソク足の密度に見事に同調し、ブローカーの足内部のノイズは完全に遮断されます。したがって、M15、M30、H1、H2、H4 で製品を起動することができます。
   3. EAにはどの口座タイプが適していますか?
   標準的なネット決済(Netting)は技術的にEAのロジックと互換性がないため、両建て(Hedging)をサポートする口座が必要となります。大口資金の場合は ECN/Raw タイプ、10,000ドル未満のデポジットには Cent 口座、またはレバレッジ 1:100以上 の Swap-Free 口座が最善の選択肢となります。
   4. 取引を開始できる最小デポジットはいくらですか?
   1ペアあたり、スタンダード口座では 800〜1000ドル(セント口座では 10ドル)が必要です。2ペアまたは3ペアの場合、必要額は比例して増加し、スタンダード口座では 2Kドル / 3Kドル(セント口座では 20ドル / 30ドル)となります。
   5. 過去データにおけるEAのドローダウンはどのくらいですか?
   55年間のヒストリー検証におけるエクイティベース(Equity)の最大含み損は以下の通りです:


* EURUSD:7.08%
* GBPUSD:9.31%
* USDJPY:わずか 4.17%
バランスベース(Balance)の相対ドローダウンは、ヒストリー上 2.27% 〜 16.95% の範囲で推移しています。


   1. 3つの通貨ペアすべてをアンサンブル(同時運用)できますか(異なるマジックナンバーの使用)?
   はい、それは極めて合理的です。異なる Magic Number を使用して EURUSD、GBPUSD、USDJPY で同時に起動すると、アンサンブル効果が発動します。各ペアは完全に独立して取引を行い、互いのドローダウンを相殺し合うことで、安定的かつ分散された強力なトレーディングフローを創出します。
   2. スタート時にはどのような設定を使用すべきですか?
   📦 箱から出してすぐに完全自律: パラメータの手動調整や、何百ページもの取扱説明書を読み込む必要性は一切忘れてください。本製品は最初から主要通貨ペアの特性に合わせて完全に最適化されています。ロボットは自動的にチャートをスキャンして通貨ペアを認識し、瞬時に稼働を開始します。わずか数クリックで簡単にスタートできます。あなたがすべきことは、推奨通貨ペアのチャートにEAをセットし、必要なタイムフレームを選択し、分散運用のための固有の Magic Number を設定することだけです。
   3. EAが正常に稼働し始めたことをどうやって確認すればよいですか?
   極めてシンプルです。チャートの隅で スマイリーフェイス(笑顔のマーク)が微笑みます(事前に「アルゴリズム取引を許可する」ボタンを押してください)。設定で Enable: Detailed operational logs パラメータを有効にすると、画面自体にシステムステータスのテキストが表示され、「エキスパート(Experts)」タブでは1〜4時間に1回、詳細なレポートを出力する動作ログの更新が始まります。
   4. タイムフレームを切り替える際、画面が一時的にフリーズするのはなぜですか?
   🌐 相場のクォンタム・スナップ(量子スナップ): 初回起動時、タイムフレームの変更時、または通信切断の発生時、ターミナルは全履歴のクロスオーディット(一貫性監査)を行うために一時的に静止します。システムはあらゆる価格の歪みを排除し、ポジション保護のための完璧な数学模型を展開するために、あえてこの短い「ポーズ(一時停止)」を挟むのです。
   5. なぜ注文(オーダー)が実際には開かなかったのに、システムはそれをカウントしているのですка?
   💻 デジタル自律性: ロボットの内部数学は、市場の現実を超越します。これは当EAが誇る独自の保護機能です。通信遮断やブローカーのスリッページが原因で、現実の市場で注文が開かなかった場合でも、ロボットはモデルのメモリ内でその注文を 仮想的(バーチャル) に瞬時に計算に入れます。ロボットにとっては、自身の数学的モデルの完全性を厳格に維持することこそが最優先事項であり、これこそが市場の混沌から身を守る最大の盾です。システムはこの目的のために、1つのグリッド上で最小限のテクニカルなマイナスをあえて容認します。このようなシナリオは極めて稀です。なぜならロボットは、価格がローソク足の始値付近で変動している間に、注文を開くための試行を 最大10回まで 繰り返すからです。
   6. インジケーターはシグナルをリペイント(再描画)しますか?また、PCの電源を切るとどうなりますか?
   インジケーターが遅行したり、シグナルをリペイントしたりすることは一切ありません。ターミナルを終了しても、EAが何かを失うことはありません。再起動時に、ご自身の注文の Magic Number に基づいて、履歴の最初から数学的モデル全体を 一瞬で再計算 します。PCをオフにする場合の最大の危険は、グリッドが利益(プロフィット)でクローズする決定的な瞬間を逃すことです。そのため、VPSサーバーの使用を強く推奨 します。
   7. なぜインジケーターにはバッファがないのですか?また、製品はどのようなテンポで動作しますか?
   インジケーターはバッファを使用せず、グラフィックオブジェクト(ライン、矢印)を介してシグナルを出力します。これにより、メモリ内に無駄な履歴が蓄積されるのを防ぎ、計算速度を劇的に高速化しています。スパイク(異常値)に対する絶対的な免疫:本製品は毎ティックごとやバーの内部では更新されず、H1またはH4ローソク足の始値にのみ厳格に紐づいて動作 します。これにより、市場のノイズや偽のスパイク、スクイーズからアルゴリズムを完全にディフェンスします。
   8. ブローカーが私のターゲット(利確・損切り)を見つけ出し、ポジションを狩るために意図的な価格スパイクを起こしてきたらどうなりますか?
   👤 完全ステルスモード: それは技術的に不可能です。なぜなら、当EAには「ステルスモード」が搭載されているからです。ロボットは仮想注文(バーチャルオーダー)アルゴリズムを採用しており、すべてのリアルな価格レベルと目標値は EAの内部メモリ内にのみ存在 し、ブローカーのサーバーからは完全に隠蔽されています。システムがどこでポジションの決済を計画しているのかブローカー側には一切見えないため、あなたのストップを狙い撃つ「ストップハンティング」は 構造的に発生し得ません。
   9. 注文グリッドが大きくなりすぎた場合はどうなりますか?
   🔒 資本保護ヒューズ(セーフティ機能): 万が一の事態に備え、資本のヒューズとして Risk: Enable grid depth protection パラメータが用意されています。グリッド内の最大注文数を(例えば最大8個などに)厳格に制限することが可能です。市場がシステムに逆行し、含み損の深さがこのクリティカルな閾値に達した場合、ロボットは 自動的に負荷をカット(損切り) し、あなたのメインデポジットを最大限に守るためにリスクを冷徹に遮断します。


おすすめのプロダクト
# MT5用スクイーズ・モメンタム・インジケーター MetaTrader 5向けにプロが開発した強力な**スクイーズ・モメンタム・インジケーター**で、爆発的な市場チャンスを掴みましょう。 この高度なボラティリティ・モメンタム・インジケーターは、トレーダーが大きな市場変動が起こる前の低ボラティリティ期間を特定するのに役立ちます。ボリンジャーバンドとケルトナーチャネルの強みを組み合わせたこのインジケーターは、市場が「スクイーズ」状態にあり、ブレイクアウトの準備をしているタイミングを明らかにします。 内蔵のモメンタム・ヒストグラムにより、トレンドの方向とモメンタムの変化を容易に把握でき、トレーダーは自信と精度を持ってトレードを行うことができます。 ## 機能 * 高度なスクイーズ検出システム * プロフェッショナルなMT5実装 * 急激なブレイクアウト前にボラティリティスクイーズを検出 * 動的な色変化を伴うモメンタムヒストグラム * 市場状況を容易に把握できるスクイーズステータスドット * 以下の指標を組み合わせ: * ボリンジャーバンド * ケルトナーチャネル * 線
Introduction to Fractal Pattern Scanner Fractal Indicator refers to the technical indicator that makes use of the fractal geometry found in the financial market. Fractal Pattern Scanner is the advanced Fractal Indicator that brings the latest trading technology after the extensive research and development work in the fractal geometry in the financial market. The most important feature in Fractal Pattern Scanner is the ability to measure the turning point probability as well as the trend probabil
Optimized Spike Detector Pro for MT5 is a professional-grade technical indicator designed to identify and capitalize on sharp, impulsive price movements (spikes) in any financial instrument. Utilizing a sophisticated, multi-algorithmic core, it distinguishes significant volatility expansions from market noise with exceptional accuracy. The tool dynamically adapts to changing market conditions, filtering out false signals and highlighting only high-probability spike setups in real-time. Featuring
これは当社のインジケーター ACB Breakout Arrows 用に開発されたマルチシンボル・マルチタイムフレームのスキャナーです。デフォルト設定では、 28種類の通貨ペアと9つの時間足 を同時にスキャンして売買シグナルを検出します。  機能 1つのチャートから 252* のシンボルと時間足の組み合わせをスキャン可能です。 ワンクリックでシグナルのチャートを開き、事前に設定されたテンプレートを自動で適用します。  チャート上のどこにでも簡単にドラッグ&ドロップで配置できます。 ポップアップ、音声、プッシュ通知、メールによるリアルタイムアラート機能を搭載しています。  入力パラメーター ACB Breakout Arrows のシグナル感度設定。 スキャンするシンボルを入力してください。  履歴の更新:履歴データが不足または壊れている場合は、再ダウンロードして更新できます。  スキャンする時間足を選択してください。 アラート設定 パネルの色やフォントサイズを調整可能です。 
Develop this indicator for periods of 30 minutes or more, focus on getting market trends right and making sure they are met. MFOP v8.1 gets straight to the point: it scans the market and tells you exactly when there is enough strength to enter a trade. This indicator doesn't do magic, it uses mathematical algorithms to filter out market noise, not enter into false breakouts and show you clear BUY (blue arrow) and SELL (red arrow) opportunities. It is designed and optimized specifically to take
このインジケーターは実践的なトレードに最適な自動波動分析のインジケーターです! 場合... 注:   Tang Lun (Tang Zhong Shuo Zen) の命名規則の影響で、私は波のグレーディングに西洋の名前を使用することに慣れていません。基本的な波を ペン 、二次波のバンドを セグメント と名付けました。同時に、 セグメント にはトレンドの方向が指定されます (この命名方法は将来のノートで使用されます。最初に言っておきます)。ただし、アルゴリズムは曲がりくねった理論とはほとんど関係がないため、付けるべきではありません。これは、私の市場分析 によって要約された、絶えず変化する複雑な運用ルール を反映しています。 バンドは標準化され、人によって異なることがないよう定義されており、市場参入を厳密に分析する上で重要な役割を果たす人為的な干渉の描画方法が排除されています。 このインジケーターを使用することは、取引インターフェイスの美しさを改善することと同等であり、元の K ライン取引を放棄し、取引の新しいレベルに連れて行きます。また、宣伝の観点から顧客の認識も向上します。 イ
Apex Institutional Reversal is an advanced Smart Money Concepts (SMC) and ICT trading framework designed to identify high-probability market reversals, continuation phases, and institutional exhaustion zones before they become obvious to retail traders. This is not another lagging oscillator or generic overbought/oversold tool. Apex Institutional Reversal acts as a market regime intelligence system that combines statistical trend analysis, fractal market behavior, and institutional momentum dia
The indicator scans for TD Combo signals in multiple timeframes for the all markets filtered and shows the results on Dashboard. Key Features Dashboard can be used for all markets It can scan for signals on MN1, W1, D1, H4, H1, M30, M15 ,M5, M1 timeframes Parameters UseMarketWatch: Set true to copy all symbols available in market watch MarketWatchCount : Set the number of symbols that you want to copy from the market watch list. CustomSymbols: Enter the custom symbols that you want to be availa
Harraz Master HUD
Muhammad Azraf Bin Dzul Fauzi
HARRAZ MASTER HUD v4.4 - The Ultimate Neural Trading Command Center ​ Transform your MetaTrader 5 into a professional, institutional-grade trading terminal. Harraz Master HUD is not just an indicator; it is a complete Artificial Intelligence ecosystem designed specifically for XAUUSD (Gold) and major pairs. ​ EXCLUSIVE FEATURES: ​1. Live Neural AI Typewriter (Jarvis Mode) Experience a live, animated Heads-Up Display that types out real-time market sentiment and advice. It acts as your persona
ULTIMATE GOLD ENFORCER v3 PRO Institutional-Grade XAUUSD Trading System What Makes It Different Feature Why It Matters 10-Strategy Confluence Engine No single indicator decides — weighted voting across trend, momentum, SMC, order blocks, FVGs, RSI divergence, S/R, volatility & sentiment True Multi-Timeframe H4 structure → H1 signal → M15 entry precision — aligned or no trade Dynamic Risk Management Kelly-inspired position sizing that adapts to your win rate in real-time Zero Martingale/G
Xtrade Trend Detector is an indicator capable of finding the best opportunities to take a position in any stock market. Indeed, it is a great tool for scalpers but also for Daytraders. You could therefore use it to identify areas to trade, it fits easily on a chart. I use it to detect trends on Big timeframes and take positions on Small timeframes. Don't hesitate to give me a feedback if you test it.
Crypto_Forex MT5用インジケーター「 TREND Histogram 」(リペイント不要) - TREND Histogramインジケーターは、標準的な移動平均線クロスよりもはるかに高感度で効率的です。 - インジケーターの色は2色から選択可能:弱気トレンドは黄色(金色)、強気トレンドは緑(色は設定で変更できます)。 - TREND Histogramには、モバイルとPC向けのアラート機能が組み込まれています。 - このインジケーターは、プライスアクション、VSA、その他のインジケーターなど、他の取引手法と組み合わせるのに最適です。 - このヒストグラムは、価格と数量のデータを 1 つの値に結合する主要な指標の 1 つです。 高品質のトレーディングロボットとインジケーターをご覧になるにはここをクリックしてください! これは、このMQL5ウェブサイトでのみ提供されるオリジナル製品です。
Link to our best products: LINK Link to our Trading Dashboard: LINK !!!!!!! Attention, you can find premium discounts by clicking on arrows!!!!!! Setting of this indicator candles mode: Show zones from the beginning Swing number for highs and lows Show background color Color of Premium Color of Discount show level 0% line show level 25% line show level 50% line show level 75% line show level 100% line The Premium and Discount concept is a core principle of Smart Money Concepts (SMC) used to i
Avez-vous toujours rêvé de pouvoir entrer sur le marché juste après la clôture d'une bougie… et de voir le marché évoluer immédiatement dans votre sens ? Avez-vous toujours souhaité détecter les retournements de tendance plus tôt, éviter les faux signaux et, surtout, saisir les tendances longues avant la majorité des traders ? Aujourd'hui, je vais vous présenter mon nouvel indicateur : Prophète du retournement intelligent. Contrairement aux indicateurs traditionnels qui réagissent avec un certa
SuperDuperScalper Pro MT5 は、MetaTrader 5 専用のプロフェッショナルなスキャルピングインジケーターです。チャートを混乱させることなく、より速い意思決定、正確なエントリー、そして強力なビジュアルダッシュボードを求めるトレーダーのために設計されました。 動きの速い相場では、多くのトレーダーがインジケーターの切り替えやトレンド方向の手動確認に時間を取られ、シグナルの強さを疑ってチャンスを逃してしまいます。 SuperDuperScalper Pro MT5 は、トレンド検出、シグナル確認、フィボナッチターゲット、ローソク足の色分け、アラート通知を一つの完全なビジュアルトレーディングシステムに統合することで、この問題を解決します。 Brijesh Jaiswal 氏 によって開発されたこのインジケーターは、市場のダイナミクスやトレンドの方向性を素早く把握し、信頼性の高い売買チャンスを特定できるように設計されています。 SuperDuperScalper Pro MT5 を選ぶ理由 これは単なる矢印インジケーターではありません。完全な意思決定支援システムです
The indicator helps to enter a trade following the trend, at the same time, after some correction. It finds strong trending movements of a currency pair on a given number of bars, and also finds correction levels to this trend. If the trend is strong enough, and the correction becomes equal to the one specified in the parameters, then the indicator signals this. You can set different correction values, 38, 50 and 62 (Fibonacci levels) are better. In addition, you can set the minimum trend lengt
Sigma VWAP Bands Sigma VWAP Bands (Rolling) is a technical analysis indicator that plots upper and lower bands based on the statistical deviation of price from a rolling Volume-Weighted Average Price (VWAP). The indicator is designed to visualize price dispersion around VWAP using a user-defined lookback window and a configurable standard deviation multiplier. Parameters Lookback Period Number of bars used for VWAP and standard deviation calculations. Sigma Factor Multiplier applied to the cal
. . is designed for traders who want a clean and practical way to identify bullish and bearish trend changes directly on the MT5 chart. The indicator uses a dual high/low smoothing engine to detect market direction and show a clear active trend line. When the market confirms a bullish or bearish flip
Trading concept: When price touches or exceeds the upper circle boundary = potential sell signal (overbought) When price touches or falls below the lower circle boundary = potential buy signal (oversold) The circle acts like a dynamic support/resistance band around the opening price The numbered points (1-24) help identify where in the cycle the price currently is This is similar to using Bollinger Bands or other envelope indicators, but with a fixed radius instead of standard deviations.
the fundamental technical indicator Informative Trend, which allows you to assess the current market situation in order to enter the market of the selected currency pair in a trend and with minimal risk. It basically uses the process of identifying the rate of change in price growth and allows you to find entry and exit points from the market. The indicator was created on the basis of the original indicators for searching for extreme points and is well suited for determining a reversal or a la
This indicator is based on a mathematical formula which gives you the possibility to seek and find the right frequency of the movement, and to determine its key level; just adjust the frequency parameter! Simple and highly effective; using this indicator you can easily predict the next support and  resistance    levels of the day. Also, this indicator determines the range and the next two importants levels of the movement outside this range so far. SGFL3 and RGFL3  are levels with high certainty
Uno Quant Trader
Mark Joseph Borromeo Juan
UNO Quant Trader UNO Quant Trader is a premium market-bias and trade-planning indicator built for traders who want cleaner decisions, faster chart reading, and a professional dashboard view. This indicator uses a multi-layer mathematical market model designed to analyze price behavior, momentum pressure, imbalance zones, trend strength, market exhaustion, and high-probability trade areas. Instead of relying on emotion or random entries, UNO Quant Trader helps you read the market using structured
Visual Trend Reversals — Professional Trend Reversal Indicator for MetaTrader 5 Visual Trend Reversals is a modern and efficient indicator for MetaTrader 5, specifically designed for the timely identification of trend reversal points and analysis of market conditions on any instrument: forex, cryptocurrencies, stocks, indices, and commodities. The indicator is optimized to improve entry quality, minimize false signals, and maximize clarity for traders of any experience level. Key Advantages of V
This indicator works on atr with some edited . The AI ​​MACD FILTER indicator is used for confirmation. Certainly, the indicator contains an alert when the signal appears, and you use the exit of the deal on the saturation that occurs at the AI ​​MACD. The accuracy of the work is high on gold, the time frame is five minutes, while staying away from trading at the time of news that occurs on the US dollar. And using high liquidity trading times, which are two hours before the opening of the Lond
LZ Candle Timer displays the remaining time before the current bar closes and a new bar forms. It helps you manage entries and exits around candle closes. The indicator uses server time, updates every second, and is optimized for smooth display with minimal CPU use. Feature highlights - Selectable location: place the timer in any of the four chart corners (Upper Left, Upper Right, Lower Left, Lower Right). Offsets and padding are configurable. - Alarm colour: when fewer than X seconds remain
FREE
Linear Trend Predictor ー - エントリ ポイントと方向サポート ラインを組み合わせたトレンド インジケーター。高値/安値チャネルを突破するという原理に基づいて機能します。 インジケーターのアルゴリズムは市場のノイズをフィルタリングし、ボラティリティと市場の動向を考慮します。 インジケーターの機能  平滑化手法を使用して、市場のトレンドと、買い注文または売り注文を開くためのエントリー ポイントを表示します。  任意の時間枠のチャートを分析して、短期および長期の市場の動きを判断するのに適しています。  あらゆる市場や時間枠に適応可能な入力パラメータにより、トレーダーはインジケーターを独自にカスタマイズできます。  設定されたインジケーター信号は消えず、再描画もされません。ローソク足の終値で決定されます。  いくつかの種類の通知が矢印と組み合わされています。  このインジケーターは、独立した取引システムとして使用することも、他の取引システムへの追加として使用することもできます。  あらゆるレベルの経験を持つトレーダーが使用できます。 主なパラメータ Vol
If you are unsure how to use this indicator, please feel free to reach out to me. I will explain it to you and provide reading materials to help you make the most of it. TD Sequential Scanner: An Overview The TD Sequential scanner is a powerful technical analysis tool designed to identify potential price exhaustion points and trend reversals in financial markets. Developed by Tom DeMark, this method is widely used by traders to gauge market cycles and potential turning points with precision. Ho
FlatOut Movings Robot: フラットを完全制御。トレンドを確実にナビゲート。 移動平均線(ムービング)ベースのインジケーター戦略には、一つの一大悪夢があります。市場がフェーズを変えた瞬間、あなたのデポジットは容赦なく溶け始めます。古典的なムービングはフラット相場で数十回もの偽のクロスシグナルを発生させ、標準的なフィルターは無慈悲に遅延します。あなたは夜な夜なストレスを抱えてターミナルの前に座り込み、値動きのまさに終盤の出尽くした局面でエントリーしてしまうのです。 このソフトウェアは、まさにその具体的な課題を解決するために開発されました。ロボットは絶え間なくチャートをスキャンし、板情報(オーダーブック)のインサイド情報かの如く市場構造を読み解きます。完全に膠着した横ばい相場(ボコウィク)でも、強烈なトレンドの勢い(インパルス)でも、同様に圧倒的な効率で取引を牽引します。システムはまるでメスの如き精度で、真のブレイクアウトと取引レンジ内での偽のダマシ(偽の出入り口)を完璧に切り分けます。 相場混沌の時代を生き抜く時間による証明 このソフトの数学的コアは、次々と押
MTF Scanner S/R & EMA Confluence EA (v3.50) Comprehensive Documentation 1. Introduction The MTF Scanner S/R & EMA Confluence EA (v3.50) is a rule-based automated trading system developed for MetaTrader 5 , designed to identify and execute high-probability trading opportunities across multiple timeframes. This Expert Advisor integrates: Price Action structure Support & Resistance (S/R) zones Exponential Moving Average (EMA) confluence By combining these elements, the EA aims to deliver consisten
Indicator of trend deviation with a static level. The deviation coefficient is set for the trend histogram. Signals are the intersection of the level trend histogram in the direction of the trend or during a trend reversal - the option is selected in the indicator settings by the "Revers" parameter. There are all the necessary settings for the design of the indication and sending messages to mail or a mobile terminal. All input parameters have an intuitive name. Analog for MT4: https://www.mql5.
このプロダクトを購入した人は以下も購入しています
Neuro Poseidon is a new indicator by Daria Rezueva. It combines precise trading signals with adaptive TP/SL levels - creating best possible trades as a result! Message me and get  Neuro Poseidon Assistant  as a gift to automize your trading process! What makes it stand out? 1. Proven profitability on all assets and timeframes 2. Only confirmed BUY and SELL signals present on the chart 3. Adaptive TP & SL levels generated by the software for each trade 4. Easy to understand - suitable for al
UZFX {SSS} スキャルピング・スマートシグナル v4.0 MT5は、変動の激しい市場において正確かつリアルタイムのシグナルを求めるスキャルパー、デイトレーダー、スイングトレーダー向けに設計された、リペイントのない高性能な取引インジケーターです。(UZFX-LABS)によって開発されたこのインジケーターは、価格行動分析、トレンド確認、スマートフィルタリングを組み合わせることで、すべての通貨ペアおよび時間軸において、高確率の売買シグナル、警告シグナル、トレンド継続の機会を生成します。 トレードの判断に迷うのはもうやめましょう。明確さ、正確さ、そして規律ある市場執行を求めるトレーダーのために設計された、体系的なシグナルシステムに従い始めましょう。 私のおすすめ* 最適な時間足:15分足以上。 {H1} が私のお気に入りです。そして、その成果は驚異的です…!! 主な機能の更新 • 自動売買シグナル検出 • 高度な反転認識ロジック • 市場反転の可能性に先立つ早期警告シグナル • トレンド継続確認シグナル • エントリー、ストップロス、TP1、TP2、TP3レベルを備えた組み込み型
このインジケーターは、市場で 関心が示されたゾーン をハイライトし、その後に 注文の蓄積ゾーン を表示します。 これは、大規模な**板情報(オーダーブック)**のように機能します。 これは、 巨大な資金 のためのインジケーターです。その性能は卓越しています。 市場にどんな関心が存在していても、 必ず目に見えるようになります 。 (これは 完全に再設計され、自動化されたバージョン です。もはや手動分析は必要ありません。) トランザクションスピード(取引速度) は新しい概念のインジケーターで、市場で大口注文が どこに・いつ 集中しているかを示し、それに基づいたチャンスを提供します。 トレンドの変化を 非常に早い段階 で察知することができます。 FXでは「出来高」と呼ばれているものは誤解されています。実際には、これは 時間あたりの価格変動量 です。したがって、正しい名称は トランザクションスピード です。 考え方・行動・分析の仕方すべてが問われます。 分析パラダイムの転換は非常に重要です。 このインジケーターは、FXにおける出来高の考え方を 根本から再定義 し、論理的な形で正確に活用する、
GEM Signal Pro GEM Signal Pro は、MetaTrader 5 向けのトレンドフォロー型インジケーターです。より明確なシグナル、より整理されたトレードセットアップ、そして実用的なリスク管理をチャート上で確認したいトレーダーのために設計されています。 単純な矢印だけを表示するのではなく、GEM Signal Pro はトレード全体の考え方を、より見やすく分かりやすい形で表示します。条件が確認されると、インジケーターはエントリー価格、ストップロス、利確目標をチャート上に表示し、トレードセットアップをより効率的に確認できるようにします。 動作の仕組み このインジケーターは、まず内部ロジックに基づいて有効なシードシグナルを検出します。 確認条件が満たされると、GEM Signal Pro はチャート上に完全なセットアップを表示します。これにより、トレーダーはトレード構造をより明確に把握し、手作業による分析を減らすことができます。 チャート上のトレードレベル 確認済みシグナルに対して、GEM Signal Pro は以下を表示できます。 エントリー価格 ストップロス テ
ARIPoint
Temirlan Kdyrkhan
1 (1)
ARIPoint is a powerful trading companion designed to generate high-probability entry signals with dynamic TP/SL/DP levels based on volatility. Built-in performance tracking shows win/loss stats, PP1/PP2 hits, and success rates all updated live. Key Features: Buy/Sell signals with adaptive volatility bands Real-time TP/SL/DP levels based on ATR Built-in MA Filter with optional ATR/StdDev volatility Performance stats panel (Success, Profit/Loss, PP1/PP2) Alerts via popup, sound, push, or email Cu
Azimuth Pro
Ottaviano De Cicco
5 (7)
Azimuth Pro V2:MT5向けシンセティック・フラクタル構造分析と確認済みエントリー 概要 Azimuth Pro は Merkava Labs によるマルチレベルスイング構造インジケーターです。4つのネストされたスイングレイヤー、スイングアンカーVWAP、ABCパターン検出、3タイムフレーム構造フィルタリング、そして確定バーでの確認済みエントリー — 1つのチャートで、ミクロスイングからマクロサイクルまでを網羅するワークフロー。 これはブラインドシグナル製品ではありません。ロケーション、コンテキスト、タイミングを重視するトレーダーのための構造ファーストワークフローです。 ️ サマーセール — 夏至とThe Oracle Proの発売を記念して、Azimuth Proが30%オフ。現在279 USD(通常399 USD)。期間限定の夏季オファー。 1. V2での変更点 シンセティック・マルチタイムフレームエンジン 上位タイムフレーム分析をMeridian Proと同じ独自のシンセティックアーキテクチャで一から再構築。よりクリーンなHTFコンテキスト、安定したライブ動作、
多くの矢印インジケーターは、シグナルだけを表示して、その後の判断をすべてトレーダーに任せてしまいます。KT Alpha Hunter Arrows は、完整なトレードプランをチャート上に提示します。 各シグナル矢印が表示されるたびに、エントリーライン、ストップロス、4つのテイクプロフィット水準、そして現在の銘柄と時間足が今トレードに値するかどうかを示すリアルタイムのエッジ判定が、すでに描画された状態で表示されます。付属の Trade Manager EA は、あなたが手動でエントリーした後の実行管理を担当し、相場が荒れて判断がぶれやすい場面でも規律あるトレードを保ちやすくします。リペイントなし。確定足シグナルのみ。Forex、ゴールド、指数、その他あなたが取引するあらゆる銘柄に対応します。 主な機能 リペイントしない買い矢印と売り矢印を、足の確定後にのみ表示。 各シグナルに、エントリーライン、構造的ストップロス、4つのテイクプロフィット水準を表示。 Edge Dashboard が、現在のチャートで買いセットアップと売りセットアップを別々に評価。 判定システム:No Edge、Mar
機関投資家のフローと市場の勢いをリアルタイムで分析する究極のツール、 Smart Bubble Dominance Pro をご紹介します。このインジケーターは、複雑なボリュームデータを明確な視覚信号に変換し、「スマートマネー」がどこに配置されているかを正確に特定することを可能にします。 BTCUSD 専用に最適化 このインジケーターは、 BTCUSD のボラティリティと特有の挙動に合わせて細かく調整されています。市場のノイズを排除し、本当に重要な動きだけを強調するため、常にトレンドの正しい側に立つことができます。 ドミナンス・ビジュアルマップ(デルタカラー) 直感的なカラーコードにより、市場のセンチメントを瞬時に把握できます。 シアンのバブル(強力な買い): 買い手による攻撃的な支配を表します。価格が強い確信を持って押し上げられているサインです。 マゼンタのバブル(強力な売り): 圧倒的な売り圧力を示します。市場が機関投資家の供給によって支配されている状態です。 バブルのサイズ: バブルが大きいほど、ボリュームの不均衡(デルタ)が大きいことを意味します。巨大なバブルは、大
Quant Direction は、3次元の市場分析ツールです。完全に客観的なアルゴリズムベースの市場分析を提供し、様々なパラメータにわたる正確なパーセンテージ偏差を同時に算出します。高度なAI搭載モデリングツールで開発され、厳密なテストを経て開発されたこのアルゴリズムは、かつてない精度で市場を分析するように設計されています。プラットフォーム上では、あらゆる通貨ペアや金融商品を分析できます。 短期取引、デイトレード、スイングトレードなど、どのような取引スタイルに も、Quant Directionは最適な選択肢です。 オペレーターの本当の利点 Quant Directionの真の利点は、感情、眼精疲労、過剰分析を完全に排除できる点にあります。方向性を探るために何十ものチャートを手作業で精査したり、自分の好みを常に疑ったりする必要がなくなります。このシステムは、8つの時間間隔(5ヶ月から月単位まで)をミリ秒単位で処理します。あらゆる瞬間に市場を支配している主体を正確に明らかにし、常に成功確率が最も高い方向で取引できるようにします。 市場分析の3つの側面 このアルゴリズムは市場を3つの
RelicusRoad Pro: 定量的市場オペレーティングシステム 【期間限定】無制限アクセス 70% OFF - 2,000人超のトレーダーと共に なぜ多くのトレーダーは「完璧な」インジケーターを使っても失敗するのでしょうか? それは、文脈を無視して 単一の概念 だけでトレードしているからです。文脈のないシグナルは単なるギャンブルです。勝ち続けるには、 根拠の重なり(コンフルエンス) が必要です。 RelicusRoad Proは単なる矢印インジケーターではありません。完全な 定量的市場エコシステム です。独自のボラティリティモデリングを用いて、価格が推移する「適正価値の道(Fair Value Road)」をマッピングし、ノイズと真の構造的ブレイクを判別します。 推測はやめましょう。機関投資家レベルの「ロード・ロジック」でトレードを。 コアエンジン:「Road」アルゴリズム システムの中心となる Road Algo は、市場環境にリアルタイムで適応するダイナミックなボラティリティチャネルです。 安全ライン(平衡点) と、価格が数学的に反転しやすい 拡張レベル を投影します。 Si
PrimeScalping is a powerful trading companion designed to generate high-probability entry signals with dynamic TP/SL/DP levels based on volatility. Built-in performance tracking shows win/loss stats, PP1/PP2 hits, and success rates — all updated live. Key Features: Buy/Sell signals with adaptive volatility bands Real-time TP/SL/DP levels based on ATR Built-in MA Filter with optional ATR/StdDev volatility Performance stats panel (Success, Profit/Loss, PP1/PP2) Alerts via popup, sound, push, or e
OmniSync Projection
Antonio-alin Teculescu
5 (1)
Chronos Fractal Engine is an innovative price projection indicator for MetaTrader 5, designed to transform your technical analysis by intelligently identifying and projecting historical price patterns. Built upon an advanced correlation algorithm and the fractal principles of the market, this powerful tool visualizes potential future price movements, giving you a unique edge in your trading decisions. What is Chronos Fractal Engine? At its core, the Chronos Fractal Engine employs a sophisticat
トレーダーの皆さん、こんにちは! 多くの個人トレーダーは、動作の遅いウェブスクリプトに頼っています。真の収益性を実現するには、体系化されたフレームワークが必要です。 Astro AIインジケーターは、一般的なチャートオーバーレイではありません。これは、ターミナル上で直接動作する2つのエージェントを含む、コンパイル済みのニューラルネットワークです。 システムの具体的な技術は以下のとおりです。 1. エージェント1:アナリスト(グラフィカルニューラルネットワーク - GNN) 市場は孤立した価格バーではなく、相互に連結されたデータネットワークです。 機能:エージェント1は、グラフィカルニューラルネットワークを使用して、これらの複雑で非線形な関係をマッピングします。 利点:一般的なインジケーターは過去の移動平均しか考慮しませんが、当社のGNNは市場の深い構造的関係をリアルタイムで処理し、個人トレーダーの取引量が大きな影響を与える前に、隠れた相関関係を明らかにします。 2. エージェント2:エグゼキューター(近接戦略最適化 - PPO) パターン認識は、戦いの半分に過ぎません
マーケットメーカーのためのツール。 Meravith は次の機能を提供します: すべての時間足を分析し、現在有効なトレンドを表示します。 強気と弱気の出来高が等しくなる流動性ゾーン(出来高均衡)を強調表示します。 異なる時間足のすべての流動性レベルをチャート上に直接表示します。 テキスト形式の市場分析を生成し、参考情報として表示します。 現在のトレンドに基づいて目標値、サポートレベル、ストップロスを計算します。 取引のリスクリワード比を算出します。 口座残高に基づいてポジションサイズを計算し、潜在的な利益を推定します。 また、市場に大きな変化があった場合には警告を表示します。 インジケーターの主要ライン: 強気/弱気の出来高エグゾーストライン ― 目標値として機能します。 市場のトレンドを示すライン。市場が強気か弱気かによって色が変わり、トレンドのサポートとして機能します。主にその色が市場センチメントを示します。 出来高均衡ライン(Eq)。Eq(Volume Equilibrium)ラインはシステムの中核です。これは買い手と売り手の出来高のバランスポイントを表します。市場の流動性を示し
This indicator automatically detects internal & swing market structure, Fibonacci Retracement and Fibo Levels. Features Full internal & swing market structure labeling in real-time Fibonacci Retracement Fibonacci Levels After purchasing the indicator, the full source code is provided, and via indicator buffers it can be easily integrated into your Expert Advisors (EAs) for automated trading strategies.
ScalpPoint is a powerful trading companion designed to generate high-probability entry signals with dynamic TP/SL/DP levels based on volatility. Built-in performance tracking shows win/loss stats, PP1/PP2 hits, and success rates — all updated live. Key Features: Buy/Sell signals with adaptive volatility bands Real-time TP/SL/DP levels based on ATR Built-in MA Filter with optional ATR/StdDev volatility Performance stats panel (Success, Profit/Loss, PP1/PP2) Alerts via popup, sound, push, or emai
Brandon Angelo Flag Pattern — how it works This indicator automatically detects classic bull and bear flag chart patterns in real time. The detection happens in three stages for each bar. First it looks for a flagpole — a sharp, strong directional move over a configurable number of bars ( FlagpoleBars , default 5) that must exceed a minimum percentage size ( FlagpoleMinPct ). For a bullish flag the pole must close net higher than it opened; for a bearish flag, net lower. Second it identifies th
LTL ロングトレンドロケーター v2.0 - プロフェッショナルトレンドトレード指標 LTL ロングトレンドロケーターは、強力で持続的なトレンドを特定することで、トレーダーが市場への最適なエントリー・エグジットタイミングを見つけるのを支援します。トレンドの開始と終了時に明確なシグナルを提供し、適切なタイミングで正しい方向への取引を可能にします。強力な市場トレンドを発見し、明確なエントリー・ストップロス・テイクプロフィットレベルと共に、取引を配置すべき正確な位置を示します。 主な機能: 明確な買い/売りシグナル: 市場が上昇または下降する準備が整った際に矢印を表示 トレードライン表示: チャート上に完全なトレード設定を描画し、全レベルを明確に表示 トレンドゾーン: チャートを色分けし、強気(緑)または弱気(ピンク)の期間を表示 統計表示:各トレンドの持続バー数とポイント数を表示 情報パネル:現在のトレンド状態と最終シグナル時刻を表示 アラートシステム: 新規シグナル発生時にポップアップ/メール/音で通知 シグナルごとに1回のみ通知(煩わしい繰り返しなし) 操作の簡便性:
SmartScalping is a powerful trading companion designed to generate high-probability entry signals with dynamic TP/SL/DP levels based on volatility. Built-in performance tracking shows win/loss stats, PP1/PP2 hits, and success rates — all updated live. Key Features: Buy/Sell signals with adaptive volatility bands Real-time TP/SL/DP levels based on ATR Built-in MA Filter with optional ATR/StdDev volatility Performance stats panel (Success, Profit/Loss, PP1/PP2) Alerts via popup, sound, push, or e
MasterTrend Indicator for MT5 A powerful trend-following and signal-evaluation tool MasterTrend   is a custom MT5 indicator that combines Moving Averages and ATR-based risk/reward logic to generate clear buy/sell signals. It visualizes dynamic SL/TP levels, evaluates past trade outcomes, and displays win/loss statistics in a clean on-chart panel. Key features include: Buy/Sell signals based on MA crossovers ATR-based SL/TP1/TP2/TP3 levels with visual lines and labels Signal outcome tracking wit
MERAVITH SCANNERは、MetaTrader 5用のプロフェッショナルな金融市場インジケーターで、複数の分析ツールを一つの統合システムにまとめています。独自の出来高加重平均価格(VWAP)手法を使用してすべての計算を自動で行い、主観的な解釈を完全に排除します。 このインジケーターは、すべての資産クラス(FX、株式、指数、商品、暗号通貨)およびM1から月足までのすべての時間軸で動作します。基本原理は「価格は出来高に従う」というものです。MERAVITHは機関投資家の出来高が集中するポイントを特定し、その集中から数学的に正確な価格レベルを導き出します。予測や投機は行わず、計算のみを行います。 MERAVITH SCANNERを使用すると、28の主要FX通貨ペアをすべての時間軸でわずか2~3分でスキャンできます。また、任意の市場をスキャンすることも可能です。例えば、約100銘柄の株式を約10分でスキャンできます。 インジケーターは、消耗レベル、均衡線、偏差、統計レベル、およびターゲット予測を算出します。 チャート要素 Origin Point :すべての計算が始まる起点です。イン
MasterTrend Indicator for MT5 A powerful trend-following and signal-evaluation tool MasterTrend   is a custom MT5 indicator that combines Moving Averages and ATR-based risk/reward logic to generate clear buy/sell signals. It visualizes dynamic SL/TP levels, evaluates past trade outcomes, and displays win/loss statistics in a clean on-chart panel. Key features include: Buy/Sell signals based on MA crossovers ATR-based SL/TP1/TP2/TP3 levels with visual lines and labels Signal outcome tracking wit
VTrende Pro
Andrii Diachenko
5 (1)
VTrende Pro - MTF indicator for trend trading with a display panel for MT5 *** Videos can be translated into any language using subtitles (video language - Russian) Although the signals of the VTrende Pro indicator can be used as signals of a full-fledged trading system, it is recommended to use them in conjunction with the Bill Williams TS. VTrende Pro is an extended version of the VTrende indicator. Difference between Pro version and VTrende: - Time zones - Signal V - signal 1-2 waves -    S
Important: whether you rent or purchase,  contact the seller via the MQL5 private messaging system and  get the  Key Level Trade Manager  as a bonus gift for the best manual scalping experience. Account Flip MT5 Scalper Welcome to a 5 indicators in 1 scalping workstation. Rapidly growing a small account or passing a prop-firm challenge requires three things: high-probability setups, strict filtering, and explosive momentum. The   Acc
ZIVA Signal Intelligence
Hassan Abdullah Hassan Al Balushi
ZIVA Signal Intelligence An Adaptive, Modular Market Intelligence System ZIVA Signal Intelligence is not positioned as a conventional trading indicator. It is a fully integrated, proprietary market intelligence system engineered to deliver structured, high-precision interpretation of price behavior within a controlled analytical environment. Developed through an independent architectural approach, ZIVA does not rely on, derive from, or replicate existing indicators. It represents a standalone
MetaTrader 5 向けスマート多層ブレイクアウト&プルバック検出器 「スマート・シンプル・ファスト!」 高確率のブレイクアウトエントリーを見逃すことにうんざりしていませんか? 複数のチャートを何時間もスキャンし、ブレイクアウトをトレンド方向と通貨のモメンタムに合わせようとして、それでも動きを逃してしまうことはありませんか? Break Pullback は、1つのインジケーターでそのすべてを解決します。 Break Pullback とは何ですか? Break Pullback は、マーケットストラクチャー、ブレイクアウト、トレンド継続のセットアップを取引するトレーダー向けに特別に設計されたプロフェッショナルグレードの MetaTrader 5 インジケーターです。 リアルタイムで複数の通貨ペアにわたるブレイクとプルバックの形成を自動的に検出し、3層の確認を通じてすべてのシグナルをフィルタリングします: ストラクチャラルブレイクアウト検出 — チャート上の主要なブレイクレベルを特定 HTF 日足バイアス — エントリーを支配的な日足トレンド方向に合わせる 通貨強弱指数 —
Ace Trend
Mikhail Sergeev
5 (3)
私たちはあなたにトレンド取引の世界でゲームのルールを変える革命的な指標を提示します。 指標は、パフォーマンスを再考し、前例のない高さにあなたの取引経験を高めるように設計されています。 私たちの指標は、競合他社とは一線を画す高度な機能のユニークな組み合わせを誇っています。 "実質の価格設定要因"の先端技術は最も困難で、揮発市況の最高の安定性を保障する。 不安定なパターン、壊れた指標に別れを告げ、意識的で制御された取引を歓迎します。 指標は単なる美しい絵ではありません! 指標は、トレーダーの側にオッズをシフトし、それによって利益を得る必要があります。 インジケータ信号(完全自動モード)に基づいて取引結果に慣れる: https://www.mql5.com/ja/signals/2339244 AceTrendは、rbtiバージョンによるトレンド指標のランキングで第一位にランクされています。AceTrend-取引における最大の収益性と制御。 私たちの指標は、歴史ではなく、現在の市場相場に基づいて収益性を強調しています。 革命に参加-あなたの取引経験の可能性のロックを解除! インジケーターは、
以下は Chimera Volume の日本語訳です。 MetaTrader 5用 Chimera Volume 高度な出来高分析と市場活動の可視化 Chimera Volumeは、MetaTrader 5向けに設計されたカスタムインジケーターです。正規化された出来高の動きを分析し、動的な視覚的フレームワークを通じて市場参加者の変化をリアルタイムで表示します。 このインジケーターは、適応型正規化アルゴリズムを用いてティック出来高データを処理し、出来高の強さ、蓄積フェーズ、および異なる市場条件下での活動シフトを構造化して表現します。 生の出来高を表示する標準的なインジケーターとは異なり、Chimera Volumeは追加の計算を適用することで、市場活動の相対的な変化を強調し、チャートの視認性を向上させます。 主な機能 ルート・インテント・ヒストグラム (Root Intent Histogram): 正規化された出来高の強さと市場参加度を視覚化する動的ヒストグラムです。適応型カラー・トランジションを採用しており、活動の活発化と参加の減少を明確に区別します。 慣性ライン (Inertia
ARICoin is a powerful trading companion designed to generate high-probability entry signals with dynamic TP/SL/DP levels based on volatility. Built-in performance tracking shows win/loss stats, PP1/PP2 hits, and success rates all updated live. Key Features: Buy/Sell signals with adaptive volatility bands Real-time TP/SL/DP levels based on ATR Built-in MA Filter with optional ATR/StdDev volatility Performance stats panel (Success, Profit/Loss, PP1/PP2) Alerts via popup, sound, push, or email Cust
「 Dynamic Scalper System MT5 」インジケーターは、トレンド波の中でスキャルピング取引を行う手法のために設計されています。 主要通貨ペアと金でテスト済みで、他の取引商品との互換性があります。 トレンドに沿った短期的なポジションオープンのシグナルを提供し、追加の価格変動サポートも提供します。 インジケーターの原理 大きな矢印はトレンドの方向を決定します。 トレンド波の中では、小さな矢印の形でスキャルピングシグナルを生成するアルゴリズムが機能します。 赤い矢印は強気方向、青い矢印は弱気方向です。 トレンドの方向には敏感な価格変動ラインが描かれ、小さな矢印のシグナルと連動します。 シグナルは次のように機能します。適切なタイミングでラインが現れるとエントリーシグナルが形成され、ラインが開いている間はポジションが保持され、完了すると取引が終了します。 推奨される動作時間枠はM1~H4です。 矢印は現在のローソク足に形成され、次のローソク足が開いている場合は、前のローソク足の矢印は再描画されません。 入力パラメータ Trend Wave Period - トレ
作者のその他のプロダクト
Golden section price action indicator - is a trend-scalping complete system with enter and exit points. Indicator is based on most powerfull price action japan patterns that are filtered by volume, volatility, market phase. Pattern is not a simple combinations of candles. Patterns must have "weight" to move market in right direction. "Weight" - is the summary of pattern's volume, the size of pattern candles according to last average volatility and ofcourse pattern must appear in correct market p
SupportResistancePeaks Indicator indicator - is the combination of dynamic support/resitance and price action pattern. As a rule support/resistance indicators uses already calculated, history levels. The most disadvantage of this method - new(incomming) levels always are not the same as were on history, in other words accuracy is not so high as expected. My indicator is looking for dynamic/live levels that are forming right now after trend lost it's power and choppy market starts. As a rule exac
Trend deviation scalper - is the manual system to scalp choppy market places. Indicator defines bull/bear trend and it's force. Inside exact trend system also defines "weak" places, when trend is ready to reverse. So as a rule, system plots a sell arrow when bull trend becomes weak and possibly reverses to bear trend. For buy arrow is opposite : arrow is plotted on bear weak trend. Such arrangement allows you to get a favorable price and stand up market noise. Loss arrows are closing by common p
Trend driver bars is the manual trading system, which defines current trend continue or it's pull-back/reverse. "Driver" bars - are price action patterns that has powerfull affect on market, defining it's near future direction. Generally, driver bars represents trend "skeleton" and often anticipates new market impulse. System plots arrows when market shows 3 pattenrs in a row(most powerfull combo-pattern), and makes fast scalping of incomming movement. Loss positions closes by common profit. Lot
Wave Impulse OmegaScalper - is the manual system for scalping. In many cases Indicator "eats" almost all possible trend wave. System defines up price wave and down price wave. Inside the exact wave - system defines true trend movement and choppy market. Indicator plots signals while market is trending, powerfull and has quiet good volatility. This is complete system with enter and exit points. Main Indicator's Features Signals are not repaint,non-late or disappear(exept cases when system recalcu
Reverse side scalper is the manual trading system, that works on choppy(anti-trend) market. As a rule markets are on 80% choppy and only 20% is trend phase. System is based on custom step Moving and RSI and reverse pattern. System defines up movement, down movement, trend / choppy phases. Indicator plots Buy signal arrow when current direction is down and phase is trend, Sell signal arrow is plotted when currently is up movement and phase is trend. As a rule it allows to "catch" local maximum/mi
Binary step clouds - is the complete trading system with enter and exit points. System is based on double smoothed exponential step moving and volume weighted simple step moving.Generally each movings define trend direction and places when trend is in active phase. Signals plots when both movings approache to active trend phase and market speed is high.  Main Indicator's Features Signals are not repaint,non-late or disappear(exept cases when system recalculates all history datas,refreshing main
Acceleration Force Meter Indicator - is a trend system that join market in trend phase and after trend pull-back. AFM indicator - is the system that watchs market phases from flat to extreme volatility and prefers to enter in market when it's active, more volatility, ignoring most flat places. This is 100% complete trading system including enter and exit points. It works well with profitable trades - maximizing take profit targets(analysis of recent market volatility, its pips range to adapt cur
ImbaTrend Runner - is the trend following manual system for forex/crypto market. It defines medium-term trends and works with it in intraday mode. System shows enter points, profit and loss targets. As a rule profit targets are 2-3 X bigger than loss targets. Indicator is AutoAdaptive and it automatically updates it's settings during trading. Indicator is sensitive to market changes, regular updates helps to stay in relevant trend. Main Indicator's Features Signals are not repaint, late or disap
Early WPR divergence - is the manual system to define trend reverse. Green histogram shows main trend, Orange one - shows "short"/local trend. System is looking for clear divergence between both trends and pick up position(plot buy/sell arrows). When main trend is up, but local trend reverses to bearish trend and get's big power - sell arrow is plotted;    When main trend is down, but local trend reverses to bullish trend and get's big power - buy arrow is plotted;  Main inputs are : mediumTrend
Bull bear pressure indicator - is the manual system which defines bull/bear market. When lines is above zero level - market is strong bullish, and when lines below zero level - market is bearish. First line represents global trend and second one are smoothed and shows local market's mood. Main inputs are : MainPeriod- main indicator's period for global trend calculation; SignalPeriod - period for   smoothed and shows local market's trend; Main Indicator's Features Signals are not repaint,non-la
ROC acceleration-deceleration is the manual system for medium-term scalping. Indicator based on custom ROC system which defines bullish/bearish market and especially  acceleration-deceleration of tendention in the market's main direction. Buy arrow is plotted during bearish market when current trend decelerates and sell  arrow is plotted during bullish market when current trend decelerates. Main Indicator's Features Signals are not repaint,non-late or disappear(exept cases when system recalculat
ASI fractals with DPO filter - is the manual trend-following system. ASI fractals are the base of every trend. System plots an arrow when fractal pattern appears on ASI indcator and DPO direction is same as incomming signal. System has several ways of usage : simply indicator, indicator with suggested arrows, arrows with single targets and arrows with common profit targets. User can simply switch indicator's modes directly from chart. Main Indicator's Features Signals are not repaint,non-late or
Trend reversal index - is the manual trading system that works with overbought , oversold levels and reversal patterns. Sell arrow is plotted when indicator is higher than overbought level and here forms reversal pattern, all pattern points  located higher than overbought level. Opposite with buy arrow : ndicator is lower than oversold level and here forms reversal pattern, all pattern points located lower than overbought level.  Main Indicator's Features Signals are not repaint, late or disapp
Demarker pullback system - is the manual trading system for choppy markets. It show 2 colored histogram.  When histogram is blue - market is quite bullish, when histogram ir orange - market is more bearish. Up arrow is plotted when histogram is in oversold zone but blue color. Down arrow is plotted when histogram is in overbought zone but orange color. These patterns shows false breakout and possible soon reverse(price is overbought but shows bearish signs and price is oversold but shows bullis
TPM Cross (trend power moving cross) - is a trend following strategy based on custom signal points. Indicator consists from main custom moving chart line and trend power line. Indicator defines up and down movements by it's trend power and custom moving direction. When current market's trend looses it's power and opposite trend starts - power trend line  crosses moving and indicator plots an arrow.  Main indicator's adjustable inputs : movingPeriod - period of moving line  trendPeriod  - period
Impulse fractals indicator - is counter-trend oriented complex market fractal pattern.  Market creates bull/bear impulse, trend starts, fractals on impulsed wave are an agressive pullback signals. Buy arrow is plotted when market is bearish and it's impulse showed up-side fractal, and sell arrow is plotted when market is bullish and it's impulse showed dn-side fractal. Main indicator's adjustable inputs : impulsePeriod - main period of impulse histogram  filterPeriod  - smoothes impulse accordi
Floating peaks oscillator - it the manual trading system. It's based on Stochastik/RSI type of oscillator with dynamic/floating  overbought and oversold levels. When main line is green - market is under bullish pressure, when main line is red - market is under bearish pressure. Buy arrow appears at the floating bottom and sell arrow appears at floating top. Indicator allows to reverse signal types. Main indicator's adjustable inputs : mainTrendPeriod; signalTrendPeriod; smoothedTrendPeriod; tre
Trend speed vector - is the oscillator for manual trading. System measures trend direction and it's speed. Histogram shows 4 colors: Lime --> Strong up movement with good gain speed; Green --> Up movement with low gain speed Red --> Strong down movement with good gain speed; Orange --> Down movement with low gain speed Green and Orange histograms show weak market's movements and thуese places excluded from signal points. Buy arrow is plotted during strong down movement when bearish gain speed i
Floating gain meter is the manual trading system that works with local trends and it's scalping. Histogram represents  bull/bear floating trend gain. Green color histogram shows choppy market with bullish pressure, Orange - shows choppy market with bearish pressure. Lime and Red colors shows "boiled" places in market. As a rule buy arrow is placed after strong Down movement when it's power becomes weak and choppy market starts. And sell arrow is plotted after strong Up movement when it's power
Pullback points indicator - is the manual trading system, that shows most popular market prices. Indicator measures bull/bear waves pressure and looks for "consensus" prices. As a rule these points are crossed up and down very often and opened trade has several chances to be closed in positive zone. Mainly, such points is the good base for "common profit" types of strategies. Indicator also represents   "common profit"  scalping method of trading as default one.  Main Indicator's Features Signa
Noize Absorption Index - is the manual trading system that measures the difference of pressure between bears forces and bulls forces. Green line - is a noize free index that showing curent situation. Zero value of index shows totally choppy/flat market.Values above zero level shows how powerfull bullish wave is and values below zero measures bearish forces.Up arrow appears on bearish market when it's ready to reverse, dn arrow appears on weak bullish market, as a result of reverse expectation. S
Looking for EA to automate your trading strategy on the Forex market? TrendRocWaves Robot — your faithful companion in the world of trading! This 100% automated EA offers unique features: - works exclusively on high timeframes (H1 and H4) for confirmed response to market changes. - uses the most popular and liquid currency pairs such as EURUSD,GBPUSD with minimal spreads and fast transaction execution. - applies a scalping method based on a medium-term trend to achieve local goals and reduce r
Introducing the trading system Dynamic Trend Cycles Robot  — a powerful tool for H1-H4 trading with volatility pairs! Technical capabilities - pairs to trade : EURUSD,GBPUSD,XAUUSD;  - timeframes : M30,H1,H4; Why Choose Dynamic Trend Cycles Robot (DTC)? - Accurate Trend Analysis: DTC adapts to current market volatility, providing precise tracking of price trends. This allows you to confidently open positions in line with the main trend and maximize your profits. - Filtering False Signals: In t
Introducing to your attention an innovative expert advisor created specifically for the most juicy and volatility    currency     basket: GBPUSD and XAUUSD. This EA is designed using the main features of this market's movement, making it an ideal choice for dynamic trading on high-trending and medium-volatile pairs. The advisor is focused on minimizing trading risks, aiming to reduce losses to a minimum. Main features: EA is designed to open and close orders at the begginning of trading session
Introducing to your attention unique trading advisor, Squeeze roc xau points, exclusively designed for trading on the XAU/USD pair. We analyzed predominantly all objectively important timeframes and identified unique characteristics of gold movements relative to the dollar to create this product. These insights can be extremely useful in predicting market reversal points on timeframes from M30 to H8 for the XAU/USD pair. You can choose your favorite timeframe to receive signals or use multiple
Introducing to your attention a unique trading advisor "Detrended scalper jpy points robot", designed for trading with major JPY crosses. The idea is based on a modified indicator, detrended price oscillator, whose task is to eliminate the influence of the trend on price movements. This greatly simplifies the process of determining overbought/oversold cycles. The focus is on analyzing short cycles: long market cycles consist of several short ones. By analyzing the short components, we can more
Introducing the automated trading system "Flexi trend tracker robot" — a powerful instrument for hour+ timeframe trading with medium/soft volatility pairs! This EA offers unique features:  wide range of applications: This strategy can be used on various time intervals: H1 and H4 timeframes, making the trading advisor a highly versatile tool for trading.  the system works on comfortable USD crosses: USDCAD, USDCAD, and USDCAD pairs where you won't see overwhelming trends that wipe out deposits b
Hybrid Trend Impulse robot – is an advanced EA that combines modern approaches to trend and impulse analysis, offering unique capabilities for effective deposit management. Key advantages of the HybridTrendImpulse_robot: Nonlinear dynamics: The method of interaction between opening prices forms a unique nonlinear model that is particularly sensitive to significant price fluctuations, increasing their significance and making the indicator ideal for working in high volatility conditions. Enhanced
SynRhythmic Points Robot is an innovative trading strategy based on the combination of two analytical approaches, one focusing on short-term price changes and the other on identifying stable trends and dependencies. This synergy allows for obtaining excellent signals for entering the market while minimizing the influence of random fluctuations and reducing false signals. Additionally, the EA can easily adapt to various market conditions and be automated, making it convenient for both experienced
フィルタ:
レビューなし
レビューに返信