Fractal Pattern Scanner MT5
- Göstergeler
-
Young Ho Seo
 Harmonic Pattern Indicator - Repainting + Japanese Candlestick Pattern Scanner + Automatic Channel + Many more
https://www.mql5.com/en/market/product/4488 - Sürüm: 21.8
- Güncellendi: 5 Mart 2022
- Etkinleştirmeler: 5
Introduction to Fractal Pattern Scanner
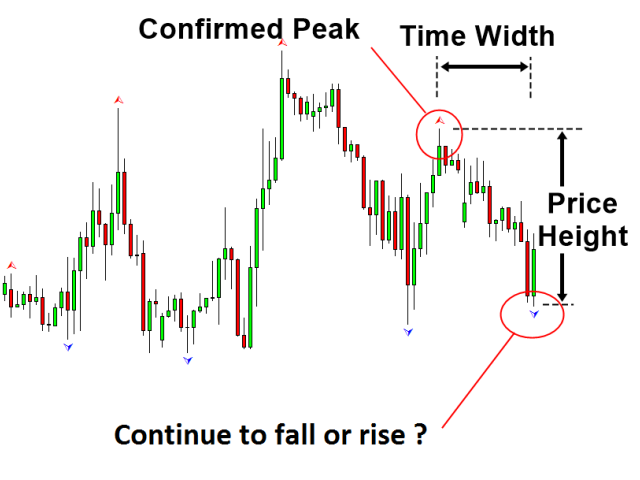
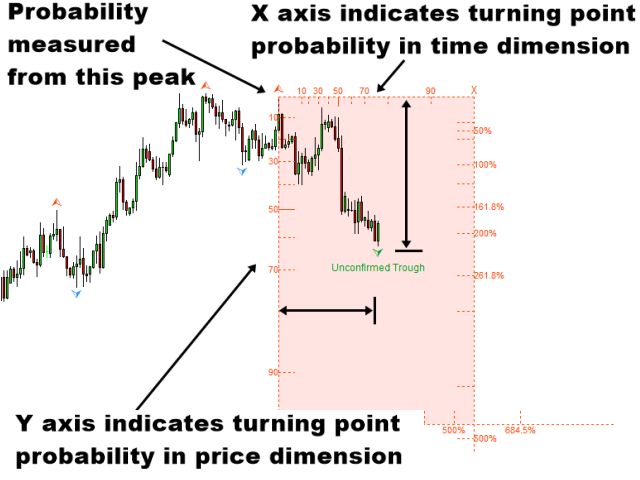
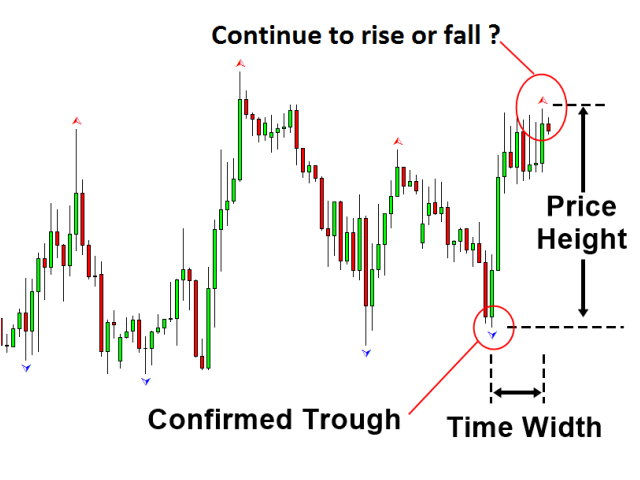
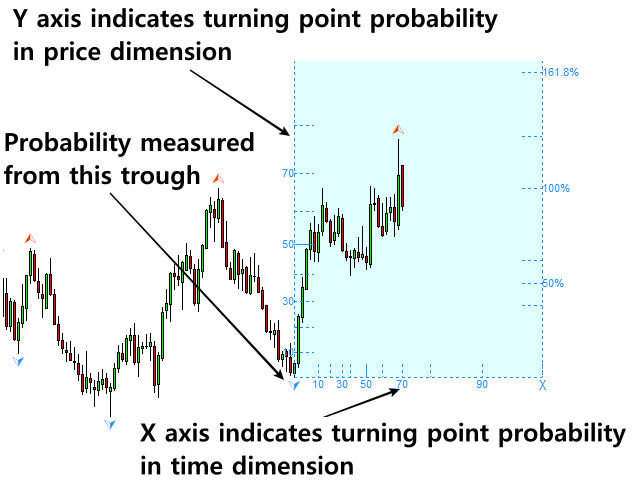
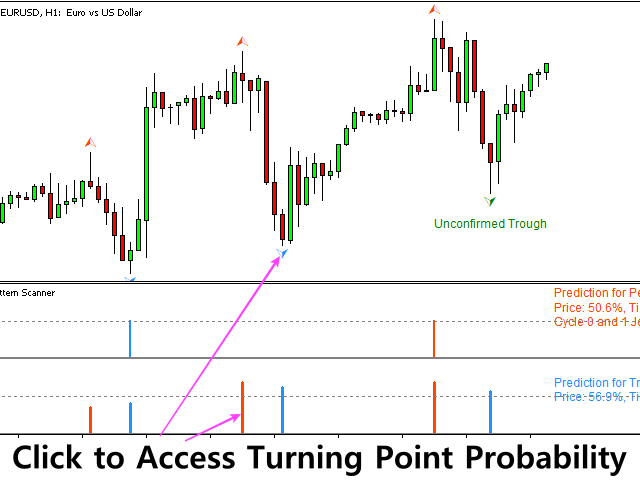
Fractal Indicator refers to the technical indicator that makes use of the fractal geometry found in the financial market. Fractal Pattern Scanner is the advanced Fractal Indicator that brings the latest trading technology after the extensive research and development work in the fractal geometry in the financial market. The most important feature in Fractal Pattern Scanner is the ability to measure the turning point probability as well as the trend probabilty. Your ability to measure the turning point probabilty and trend probabilty for each price action can boost your trading accuracy marginally.
Breakout Trading and Reversal Trading
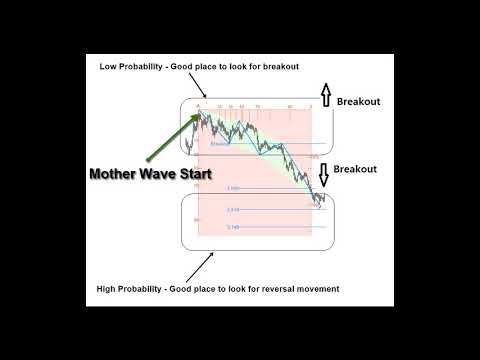
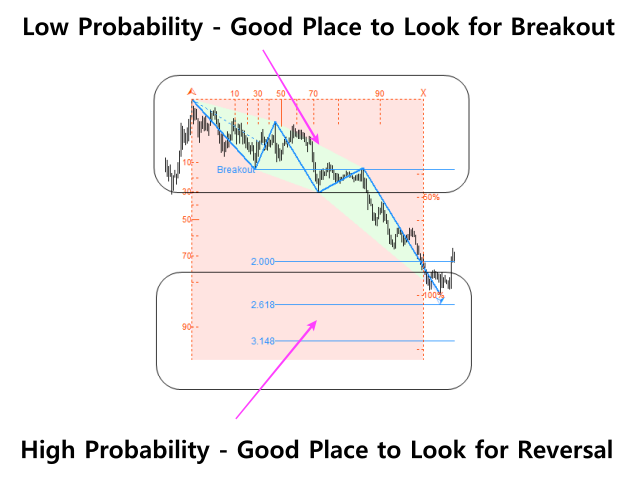
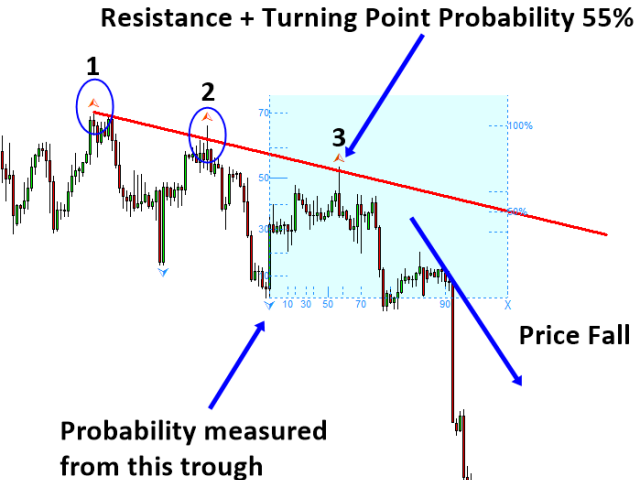
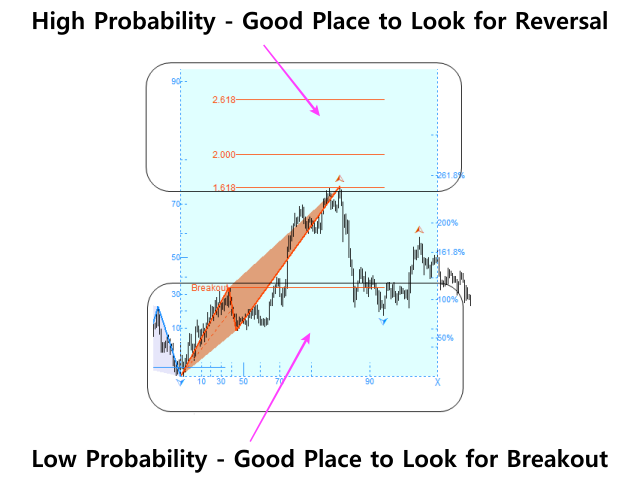
Fractal Pattern Scanner can provide both breakout and reversal trading opportunity. Firstly, you can use the Fractal Pattern Scanner as the pure probability machine to measure the turning point probability. This turning point probability quantifies the price action at every wave in your chart. While you are using the Fractal Pattern Scanner as the pure probability machine, you can access both reversal and breakout trading. You can look for the breakout trading opportunity when the turning point probability is relative low whereas you can look for reversal trading opportunity when the turning point probability is relative high. Secondly, you can ask the Fractal Pattern Scanner to detect the mother wave pattern. Mother wave pattern detection can be considered as the statistical representation of the Elliott Wave Theory. For example, Mother wave pattern detect the pattern inside pattern structure, where small patterns are jagged inside big pattern like the Elliott Wave pattern. With mother wave pattern, you can also perform both breakout and reversal trading.
Main Features
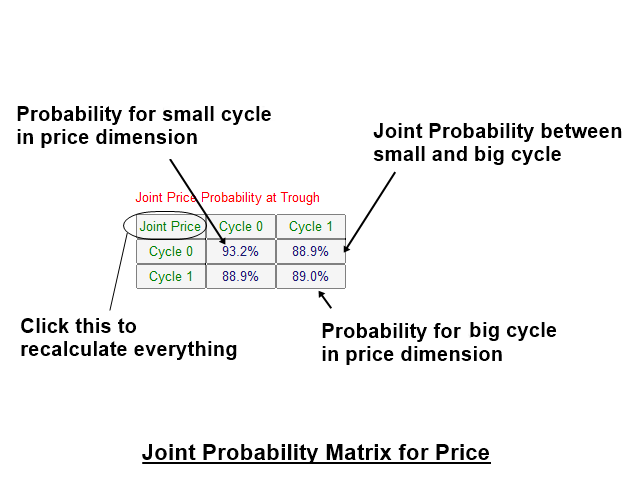
1. Provide the automatic turning point probability measurement in multiple cycles.
2. Provide breakout trading and reversal Trading with wave pattern detection.
3. Provide the Multiple Timeframe Panel for Turning Point Probability
4. Fibonacci Probability Graph helps to detect the accurate trading opportunity with support and resistance.
5. Automated Gann's Angles (Gann's Fan), the advanced Gann Angles tuned with probability (Bonus and optional feature only).
6. Automated Andrew's Pitchfork (Bonus and optional feature only).
Trading Strategy Guide
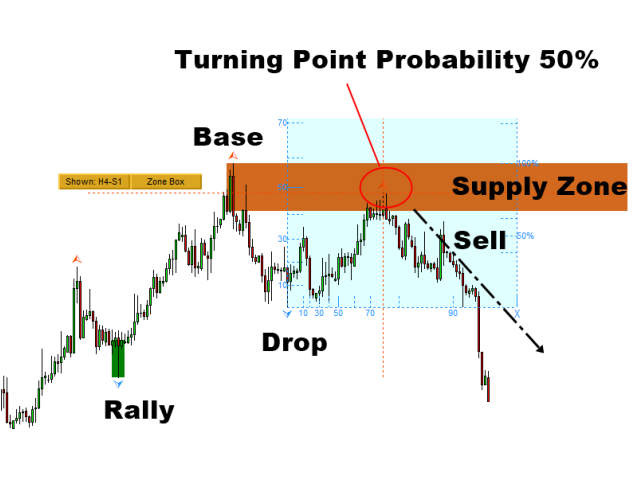
As long as you understand where to search breakout trading and reversal trading opportunity, you can combine the Fractal Pattern Scanner with any other technical analysis for reversal and breakout trading. Especially, you can use any horizontal support and resistance with the turning point probability and trend probability. Altough it is possible to use Fractal Pattern Scanner with diagonal support resistance as well as triangle pattern, rising wedge pattern and falling wedge patterns, we recommend to start with the horizontal support resistance. Simply, it is easy to start with horizontal support resistance. For example, you can use any horizontal support resistance with Fractal Pattern Scanner.
- horizontal support resistance
- supply demand analysis
- fibonacci analysis
- pivot point analysis
- round number
- and so on
With some hands on experience, you will soon learn how to control your success rate and to do risk management with the turning point probability. In another words, you are transforming your trading into the quantiative trading like the expert does.
Trading Strategy Guide: https://www.mql5.com/en/blogs/post/750345
Buit-in Breakout Trading System
From above trading strategy guide, we have provided the ways to improve the accuracy of the support and resistance analysis with the Fractal Pattern Scanner. However, Fractal Pattern Scanner provides its own breakout trading signal too. It does it by detecting the mother wave and child waves. Especially, we provide this signal across multiple timeframe. Hence, you need to have one Fractal Pattern Scanner for each symbol. Therefor there are multple ways to use the Fractal Pattern Scanner for your trading.
Important Note
This is the off the shelf product. Therefore, we do not accept any modification or customization request on this product. In addition, we do not provide any code library or any support for your coding for this product.


This scanner has changed my Trading carrier to Higher highs. With the continuous updates. The winning rate is excellent. I would recommend anyone to test this one. Thanks to the developer.