WaveTheory Fully automatic calculation
- Göstergeler
-
Kaijun Wang
 Cooperation contact QQ: 556024
Cooperation mailbox: 556024@qq.com
Cooperation WeChat: 556024
TGGOUP: https://t.me/+qmlWO6RSTPY1ODc1 - Sürüm: 7.10
- Güncellendi: 11 Nisan 2023
- Etkinleştirmeler: 5
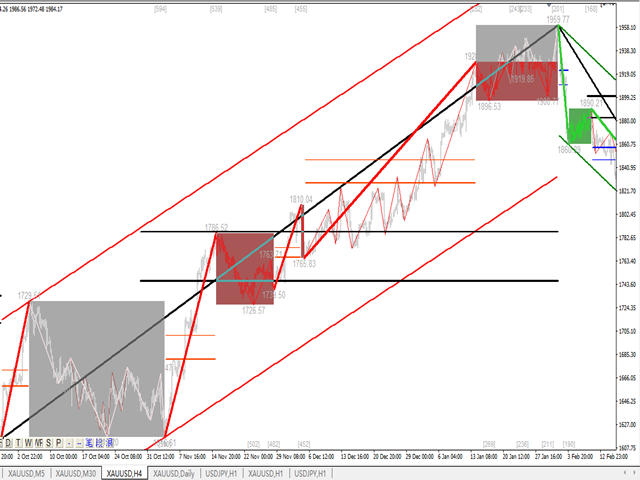
Bu gösterge, pratik ticaret için mükemmel olan otomatik dalga analizine yönelik bir göstergedir!
Not: Dalga sınıflandırması için Batılı isimleri kullanmaya alışkın değilim. Tang Lun'un (Tang Zhong Shuo Zen) adlandırma kuralının etkisiyle, temel dalgayı kalem , ikincil dalga bandını ise segment olarak adlandırdım. aynı zamanda segmentin trend yönü vardır. Adlandırma esas olarak trend segmentidir (bu adlandırma yöntemi gelecekteki notlarda kullanılacaktır, öncelikle söyleyeyim), ancak algoritmanın sarma teorisiyle pek ilgisi yoktur ve olmamalıdır. Piyasa analizimin özetlediği, sürekli değişen ve karmaşık çalışma kurallarını yansıtıyor.
Bant, artık farklı insanlar için farklı olmayacak şekilde standartlaştırıldı ve tanımlandı, pazara girişin sıkı bir şekilde analiz edilmesinde önemli bir rol oynayan yapay müdahalenin çizim yöntemi ortadan kaldırıldı.
Bu göstergeyi kullanmak, ticaret arayüzünün estetiğini iyileştirmek, orijinal K-line ticaretini terk etmek ve sizi yeni bir ticaret seviyesine taşımakla eşdeğerdir, eğer ticaret için değilse, tanıtım açısından da müşteri algısını geliştirecektir.
Gösterge içeriği:
1. Temel dalga (kalem) : Öncelikle fiyat dalgalanması sürecinde temel dalgalanmanın dönüm noktasını buluyoruz. Elbette düzeninin düşük olması, bir sonraki hesaplama adımına temel oluşturuyor.
2. İkincil dalga bandı ( segment ) : Temel dalga esas alınarak, algoritma analizi ile daha belirgin bir ikincil dalga bandı elde edilir. İkincil dalga bandı, dalga için bir analiz temeli sağlar.
3. Dalga ( dalga ): Daha net bir trendi ve daha net ve sezgisel bir yönü vardır. Bir dalganın devam edip etmediğini analiz etmek için ikincil bandın şekline bakmanız ve sonraki tahminleri almak için ikincil bandın kompozisyonunu analiz etmeniz gerekir. dalganın.
4. Kanal: Kanal hesaplamasında doğrusal regresyon kullanılır.
5. Geri çekilme: Her bandın sonunda dalgadaki iki önemli geri çekilme görüntülenecektir. Bu önemli geri çekilmelerin göreceli gücü ve gerçek mücadeleyle belirlenen gerçek geri çekilmeler, trendin momentumunu belirler.
6. Salınım aralığı: Salınım aralığı göstergede işaretlenmiştir.
Uygulamadaki göstergeler:
1. Pratik teori, temel dalga teorisinden ve Tao teorisinden gelir.
2. Pratik teori gerçek pratikten gelir. Resmi bin kez okuduktan sonra bir şeyler kazanacaksınız.
3. Başlangıçta bazı pratik deneyimler yazmak istedim, ancak bunu yazdıktan sonra operasyon planının farklı çeşitlere ve güçlü yönlere göre biraz ayarlandığını gördüm. Ticaret sürekli olarak yazılıyor ve güncelleniyor. Ticaret kuma gömülmüş bir iplik gibidir. ipi yakalasan bile kum şekil değiştirmeye devam ediyor.
4. Dalgaları tanımlamak için nicelemeyi kullandıktan sonra ticaret basit ve etkili hale gelecek, trend çok netleşecek, genel trend aklınızda olacak ve her şey basit ve etkili hale gelecektir.
5. İster solda ister sağda işlem görüyor olsun, ister trend ticareti ister şok ticaret olsun, bu göstergeler dizisinin kendi cevabı vardır. Herkesin trendin ve şokun ritmini, seviyesini, potansiyel seviyesini ve zamanını hissetmesi gerekir. son derece önemli.
6. Dalgaları ve ticaret dalgalarını anlamak için çok seviyeli ve çok döngülü analiz yapmalısınız.
Pratik deneyim:
1. Dalga teorisi ve Tao teorisi kitaplara yazılmış olmasına rağmen, doğal dalgalanma kanunlarına tamamen uyan diyagramlar değildirler. Gerçek işlem analizi sürecinde, ele alınması zor birçok durumla karşılaşılacaktır.
2. Aşağıda piyasayı düzenli ve analiz edilebilir piyasa ve düzensiz piyasa olmak üzere iki türe ayırabiliriz.
3. Düzenli ve analiz edilebilir piyasada trendler ve şoklar vardır. Bu piyasa bizim tarafımızdan analiz edilebilir yani çizilebilen ve işlem yapılabilen kısımdır. sipariş ver, böylece bundan yeterince kar elde edebiliriz
4. Düzensiz piyasa koşullarında, şoklardan farklı olarak dalgalanmalar düzensiz görünecektir. Düzensiz piyasa koşullarına katılıp düzensizlikten kaçınamazsınız.
Altın, ham petrol, pound, bitcoin ve diğer yüksek trendli ürünler için daha uygundur.


Kullanıcı değerlendirmeye herhangi bir yorum bırakmadı