AZ MarketMaker Hunter
- Göstergeler
- Yurii Shvechikov
- Sürüm: 1.45
- Güncellendi: 24 Şubat 2026
- Etkinleştirmeler: 5
READ CAREFULLY!
1. The indicator only works correctly with a futures broker.
2. Only 4 instruments are currently available: Gold, S&P500, NASDAQ-100, DAX Index
It's an indicator for catching institutional trades. ATTENTION! It works ONLY with a FUTERES broker. Currently, only 4 instruments will be available: Gold (GC), S&P500 (EP), NASDAQ-100 (NQ), DAX Index (Ger-40). It works when the terminal is running; it doesn't work on historical data. To see where the market-making systems enter the market, the terminal must be constantly running. When a large trade occurs, it draws a horizontal line on the screen with the price within the narrow range where the trade occurred. Further, by collecting historical data for several days, you can see a lot of interesting information that can help you make a future decision about entering into a particular trade. Remember that large institutional players accumulate within a certain range, and the wider the range, the stronger the price movement will be after breaking out of accumulation. Furthermore, you will see signals even before a flat combination subsequently forms on the chart. You just need to see it. This version of the indicator now allows you to export signals to a file. When the indicator detects abnormal behavior, it draws a line segment on the price and time at which it occurred. A little later, I'll add a separate indicator that will be able to plot data on a historical chart from the export file. As a reminder, the indicator only detects anomalies in the live market. It doesn't work on historical data. Let me remind you again – it does not work on the CFD market. If you want to trade spot gold CFDs (XAUUSD), the analysis must be performed on a futures chart of the full contract (not micro!), and trades can then be opened on spot. This is the first public version. Adding a new instrument, such as the Euro or Pound (for analyzing the market-making system's algorithms), can take me up to a week; therefore, at this stage, only four instruments will be available.
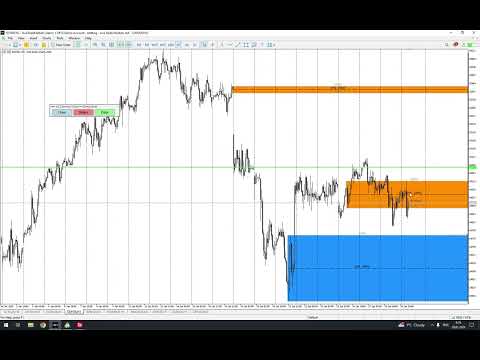
The indicator has three trigger levels: yellow ones most often indicate accumulation, and there can be many of them. Blue and red ones indicate significant changes in market structure. For example, during a large rising or falling candlestick, the appearance of blue or red signal levels will, in 80% of cases, signal the end of the move.
Instructions for using the indicator:
1. Register with any futures broker that supports the Metatrader 5 platform (e.g., AMP Futures, AVA Futures, Just2Trade) — even a demo account is sufficient. The most important thing is that the data must be available without a delay. For example, the data delay on TradingView for the futures chart is 10 minutes.
2. Launch the platform and copy the indicator to the indicators folder.
3. Open the CURRENT full gold futures contract (not a micro contract). The gold ticker is GC.
4. Set a convenient chart layout, color scheme, etc., and add the indicator to the chart.
5. That's it, now wait for the indicator to catch the data.
The on-screen panel allows you to disable the indicator and delete unnecessary levels. To delete unnecessary levels, draw a rectangle around the areas where the lines begin to be drawn, click the "Delete" button, and click along the edge of the rectangle. This will delete the levels that fall within the fill.
For example, to find out the current gold contract, open the Chicago Mercantile Exchange (CME) website: https://www.cmegroup.com/markets/metals/precious/gold.calendar.html