AZ Volzone SYSTEM locked in range finder

This indicator is the main component of my trading system. ATTENTION - I strongly recommend using the indicator when analyzing the market with a futures broker (even using a demo version of the account will be good if brokers provide quotes and volumes in real time), and entries can be made on the spot market.

My system has nothing in common with the recently popular SmartMoney system and its varieties.


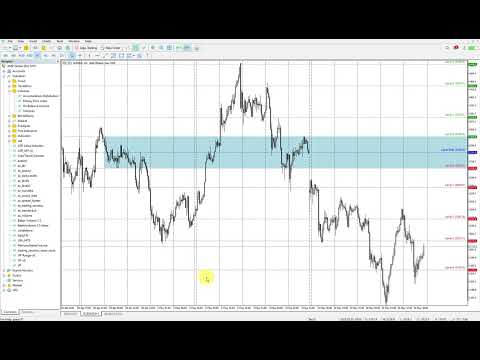
In the latest update, I completely corrected the logic. Now the indicator works without the need to manually double-check data from the Chicago Mercantile Exchange website. The default settings are set for maximum efficiency. A quick explanation: it's designed for trading on an H1 timeframe. If the price is trading above the blue area, long positions take priority; if below the blue area, short positions take priority. The calculated levels are potential price targets.

The indicator is designed to work with futures brokers, meaning if you want to trade Gold (XAUUSD), you must have two terminals—one from your CFD broker and one from any futures broker for GC (Gold). Even a demo version is sufficient, as long as the Level_1 data has no lag


So, I will try to be as simple and short as possible about how the indicator works. I took the Wyckoff Method and the Locked-in Range (LRA) Theory of Tom Leksey (Artemii Taranov?) as a basis. But both of these trading methodologies are a bit difficult to understand, and I began to think that maybe they just did not want to explain it all in more understandable words. I tried to simplify the complex. In general, in order not to "poorly pour" - you need to look at the moment when the market is in balance - enter the date of this "balance" in the indicator settings and then simply use the basic course on price action, paying attention to the levels that the indicator will create and the price reaction at these levels. And now my method of explanation: there are only 2 things that I pay attention to - the maximum and minimum traded volume for a certain period of time (usually 20 days). The date of the minimum volume must be entered into the indicator. It can do this automatically, but it is advisable to check this date. Where to check? We all know that on the futures market, we always have the same data, with any broker providing futures trading (unlike CFDs, where the data can be very different). So, all the analysis, and better yet, all the trading should be done with a futures broker that supports the MetaTrader 5 platform (perhaps I could port the indicator to other platforms; I haven't figured it out yet). Next, for example, you trade spot gold (XAUUSD) - on futures, this is the ticker (GC). You open the Chicago Board of Trade, Investing, Yahoo Finance, etc., find the nearest active contract by the GC ticker, and look at the traded volumes in history. Usually, we need data no more than 20-30 days old. We are not interested in data with the maximum volume - most often, this is evidence of the end of the directional movement, and after that, you again need to wait for the market to enter the balance phase (minimum volume). We are looking for the date of the minimum traded volumes - this is our starting point, but we do not forget to take into account that on that day there were no holidays on any of the exchanges on which the instrument is actively traded. If, for example, on that day there was a holiday for the Gold instrument in the USA, I would not use such a day for the starting point. Further, futures brokers have a moment when there is some short trading session on Sunday, and on the chart it can look like a gap, but there are also candles and they go "beyond" Monday - in this case, the date in the indicator will need to be set taking into account the Sunday trading session (set 2 days). Otherwise, that's all, then the usual candlestick analysis. Watch how the price reacts to the levels.


Operating principle: find the day you consider the starting point - enter the date of this day into the indicator, look, and use the levels that the indicator creates as a target indicator of price movement. It works both for indicating the day and for indicating the range of several days. But the levels calculated by the indicator are also suitable for intraday trading

Your task when working with the indicator: after the reference day has been found - just look for entry patterns from the boundaries of the levels that the indicator will create. And that's it, if the zone is set correctly, then in 80% of cases the price will move from one level to another. You can't even imagine how easy it is.

The indicator has 2 operating modes: automatic and manual. The indicator is suitable for both intraday trading and relatively short medium-term trading. ATTENTION - The indicator is designed for analysis on the futures market! If you want to trade on the spot - you MUST do an analysis on the futures market and then simply copy (open) trade on the spot market. This is very important. The indicator is based on my many years of research into the Wyckoff method, the theory of trading from Maitrade and part of the logic from LRA (Locked in Range) analysis.

Discipline and psychology are something that I cannot force you to follow, you will need to work on this yourself. In certain market phases, you may think that you have found the Grail. This is not true. Trading is constant market provocations.

Önerilen ürünler
Was: $249  Now: $99   Market Profile defines a number of day types that can help the trader to determine market behaviour. A key feature is the Value Area, representing the range of price action where 70% of trading took place. Understanding the Value Area can give traders valuable insight into market direction and establish the higher odds trade. It is an excellent addition to any system you may be using. Inspired by Jim Dalton’s book “Mind Over Markets”, this indicator is designed to suit the
Premium seviye, %80'den fazla doğru tahmin doğruluğuna sahip benzersiz bir göstergedir! Bu gösterge en iyi Ticaret Uzmanları tarafından iki aydan uzun süredir test edilmiştir! Yazarın göstergesini başka hiçbir yerde bulamazsınız! Ekran görüntülerinden bu aracın doğruluğunu kendiniz görebilirsiniz! 1, sona erme süresi 1 mum olan ikili opsiyon ticareti için harikadır. 2 tüm döviz çiftleri, hisse senetleri, emtialar, kripto para birimleri üzerinde çalışır Talimatlar: Kırmızı ok göründüğü an
Gösterge, tarihsel olanlarla karşılaştırılabilecek güncel teklifler oluşturur ve bu temelde bir fiyat hareketi tahmini yapar. Gösterge, istenen tarihe hızlı navigasyon için bir metin alanına sahiptir. Seçenekler: Sembol - göstergenin göstereceği sembolün seçimi; SymbolPeriod - göstergenin veri alacağı dönemin seçimi; GöstergeRenk - gösterge rengi; Ters - doğru tırnakları tersine çevirir, yanlış - orijinal görünüm; Sonraki, tarihi girebileceğiniz ve 'enter' tuşuna basarak hemen atlayab
The "MR Volume Profile 5" indicator is a charting tool that displays trading volume at different price levels rather than time intervals. A key concept in volume profile is the point of control (POC)—the price level with the highest volume traded during the session or time range. While tools like VWAP or OBV provide volume trends, the "MR Volume Profile 5" indicator offers granular detail about where the most market activity occurs at specific price levels. This makes it a more precise tool for
L'indicatore SMC Venom Model BPR è uno strumento professionale per i trader che operano nell'ambito del concetto di Smart Money (SMC). Identifica automaticamente due modelli chiave sul grafico dei prezzi: FVG   (Fair Value Gap) è una combinazione di tre candele, in cui c'è un gap tra la prima e la terza candela. Forma una zona tra livelli in cui non c'è supporto di volume, il che spesso porta a una correzione dei prezzi. BPR   (Balanced Price Range) è una combinazione di due modelli FVG che for
Price Magnet — Price Density and Attraction Levels Indicator Price Magnet is a professional analytical tool designed to identify key support and resistance levels based on statistical Price Density. The indicator analyzes a specified historical period and detects price levels where the market spent the most time. These zones act as “magnets,” attracting price action or forming a structural base for potential reversals. Unlike traditional Volume Profile tools, Price Magnet focuses on price-time d
ALIEN Dashboard
Youssef Esseghaiar
ALIEN DASHBOARD FULL EDITION – Professional ICT & Precision Trading Dashboard for MT5 ( HYBRID ENGINE ) Overview The   Alien Dashboard Full Edition   is a comprehensive, all‑in‑one technical indicator for MetaTrader 5 that merges the most powerful concepts from Inner Circle Trader (ICT) methodology with advanced precision‑entry logic, multi‑timeframe analysis, and an intuitive on‑chart dashboard. Designed for serious traders who want to visualise institutional order flow, identify high‑probabili
VOLUME PROFILE SAF-XII MT5 için Profesyonel Market Profile Analizi (Grid tarzı yatırımcılar için rüya indikatör) VOLUME PROFILE (HACİM PROFİLİ) NEDİR? Volume Profile, hacmi zamana göre gösteren geleneksel hacim indikatörlerinin aksine, belirli fiyat seviyelerindeki işlem faaliyetlerini görüntüleyen profesyonel bir kurumsal araçtır. Seçtiğiniz pencere içinde işlemlerin NEREDE gerçekleştiğini ortaya çıkararak şunları belirlemenize yardımcı olur: ADİL DEĞER ALANLARI (VAH/VAL) – İşlemlerin çoğunun
Max Min Delta Indicator - Market Volume Imbalance Analysis Gain Deeper Insights into Market Volume Imbalance with Delta Analysis What is the Max Min Delta Indicator? The Max Min Delta Indicator is a powerful market volume analysis tool that visually represents maximum and minimum delta values using a histogram. It helps traders identify market strength, weakness, absorption, and aggressive buying/selling activity with precision. Key Features Histogram Visualization: Displays Max Delta (Green) an
This Volume Delta Profile is an advanced MetaTrader 5 indicator that visualizes   volume delta (order flow imbalance)   using a volume profile-style histogram. It shows the difference between buying and selling pressure at specific price levels, helping traders identify supply and demand zones. This indicator provides a unique perspective on market dynamics by visualizing the imbalance between buying and selling pressure, offering insights beyond traditional volume analysis. Core Concept Positiv
Gioteen Volatility Index (GVI) - your ultimate solution to overcoming market unpredictability and maximizing trading opportunities. This revolutionary indicator helps you in lowering your losing trades due to choppy market movements. The GVI is designed to measure market volatility, providing you with valuable insights to identify the most favorable trading prospects. Its intuitive interface consists of a dynamic red line representing the volatility index, accompanied by blue line that indicate
Noize Absorption Index - is the manual trading system that measures the difference of pressure between bears forces and bulls forces. Green line - is a noize free index that showing curent situation. Zero value of index shows totally choppy/flat market.Values above zero level shows how powerfull bullish wave is and values below zero measures bearish forces.Up arrow appears on bearish market when it's ready to reverse, dn arrow appears on weak bullish market, as a result of reverse expectation.
Here   our more valuable tools SMC Trend Trading   ,  Easy SMC Trading  ,  Institutional SMC Architect Volume Analysis Tools  ,  Volume flow Profile  ,  Market volume profile  , FVG with Volume  , Liquidity Heatmap Profile  ,  Volume Spread Analysis The    Liquidity Heatmap   is a sophisticated institutional trading tool designed to reveal where over-leveraged traders are trapped. By calculating estimated liquidation levels based on volume spikes and leverage, this indicator draws a dynamic "h
VolumeProfile MT5
Robert Hess
4.14 (7)
Description: The Volume Profile displays detailed informations of historical trading activities at certain price levels (Market Profile). Locate the areas with the best prices in the market and get an advantage over other market participants. Features: Customizable Market Profile Shows the "fair" Value Area with 70% of all Volume Shows critical low volume zones Shows VPOC, VAL and VAH Points integrated resource management to reduce the load while working with multiple charts Works on all timefr
Turkish Bu indikatör, Grafik Formasyonları (Chart Patterns) ile işlem yapmayı seven yatırımcılar için gelişmiş bir grafik analiz asistanı olarak işlev görür. Görsel analiz yükünü azaltmak ve kâr elde etmede doğruluğu artırmak için tasarlanmıştır. Pratik kullanım açısından bu indikatörün temel özellikleri: 1. Otomatik Formasyon Tespiti (Automated Pattern Detection) Zaman kazandırır ve önyargıyı (Bias) azaltır: Trend çizgilerini manuel olarak çizmenize gerek kalmaz. İndikatör, fiyat dalgalanmaları
BoxChart MT5
Evgeny Shevtsov
5 (7)
The market is unfair if only because 10% of participants manage 90% of funds. An ordinary trader has slim changes to stand against these "vultures". This problem can be solved. You just need to be among these 10%, learn to predict their intentions and move with them. Volume is the only preemptive factor that faultlessly works on any timeframe and symbol. First, the volume appears and is accumulated, and only then the price moves. The price moves from one volume to another. Areas of volume accumu
RBreaker
Zhong Long Wu
RBreaker Gold Indicators is a short-term intraday trading strategy for gold futures that combines trend following and intraday reversal approaches. It not only captures profits during trending markets but also enables timely profit-taking and counter-trend trading during market reversals. This strategy has been ranked among the top ten most profitable trading strategies by the American magazine   Futures Truth   for 15 consecutive years. It boasts a long lifecycle and remains widely used and st
This indicator allows you to enjoy the two most popular products for analyzing request volumes and market deals at a favorable price: Actual Depth of Market Chart Actual Tick Footprint Volume Chart This product combines the power of both indicators and is provided as a single file. The functionality of Actual COMBO Depth of Market AND Tick Volume Chart is fully identical to the original indicators. You will enjoy the power of these two products combined into the single super-indicator! Below is
Cumulative Volume Delta (CVD) MA-X: Akıllı Emir Akışı Duyarlılık Aracı Cumulative Volume Delta (CVD) MA-X ile piyasanın gizli mekanizmalarını keşfedin. Standart hacim göstergeleri size yalnızca ne kadar işlem yapıldığını söylerken, CVD MA-X size alıcılar ve satıcılar arasındaki savaşı KİMİN , NE ZAMAN kazandığını söyler. Tick düzeyindeki fiyat hareketlerini ve hacim dağılımını bir araya getiren bu gösterge, piyasa inancı ve tükenmişliği hakkında kristal netliğinde bir harita sunar. İşlemcinin A
ElohimTrade Ultimate Confluence Pro — Dünyanın en güçlü çok zaman dilimli kesişim göstergesi ElohimTrade Ultimate Confluence Pro ile ticaretinizin gerçek potansiyelini keşfedin — hassasiyet, güvenilirlik ve derin piyasa analizi isteyen traderlar için tasarlanmış ileri düzey bir teknik analiz aracı. Bu gelişmiş gösterge, EMA, RSI, MACD, Bollinger Bantları, Stokastik ve ADX gibi birden fazla güçlü göstergeyi bir araya getirerek M15, H1, H4 gibi üç ana zaman diliminde aynı anda analiz eder. Sonuç?
No Demand No Supply MT5
Trade The Volume Waves Single Member P.C.
No Demand No Supply   This indicator identifies   No Demand –No Supply candles to your chart and plots volume bars colored according to the signal. It can be applied to all timeframes or to a specific one only. It can also be used as regular volume indicator  with exceptional future of WEIGHTED VOLUME. Furthermore is has an alert notification, sound and email when a signals occurs. The indicator does not repaint but the alert will come on two candles back due to the definition of No Demand No Su
Volume Profile Canvas - Professional Volume Profile Indicator for MetaTrader 5 DESCRIPTION Volume Profile Canvas is a professional volume profile indicator for MetaTrader 5 that renders directly on the chart using a high-performance Canvas engine. It calculates and displays the volume distribution across price levels, identifying the Point of Control (POC), Value Area High (VAH) and Value Area Low (VAL) in real time. This is a pure analysis tool. It does not trade. It gives you an instant vi
MACDivergence MTF MT5
Pavel Zamoshnikov
4 (5)
Advanced ideas of the popular MACD indicator: It detects and displays classic and reverse divergences (two methods of detecting divergences). It uses different color to highlight an uptrend and a downtrend. Two methods of determining a trend: а) MACD crosses the 0 level (classic signal); б) MACD crosses its own average (early signal). This is a multi-timeframe indicator: it can display MACD data from other timeframes. Two methods of drawing: classic histogram and line. It generates sound and vis
Blahtech Supply Demand MT5
Blahtech Limited
4.54 (13)
Was: $299  Now: $99  Supply Demand uses previous price action to identify potential imbalances between buyers and sellers. The key is to identify the better odds zones, not just the untouched ones. Blahtech Supply Demand indicator delivers functionality previously unavailable on any trading platform. This 4-in-1 indicator not only highlights the higher probability zones using a multi-criteria strength engine, but also combines it with multi-timeframe trend analysis, previously confirmed swings a
Düz ve trend belirleme göstergesi. Fiyat, iki histogramdan ve iki çizgiden (kırmızı ve mavi) herhangi birinin altındaysa, bu bir satış bölgesidir. Göstergenin bu sürümünü satın alırken, bir gerçek ve bir demo hesabı için MT4 sürümü - hediye olarak (almak için bana özel mesaj yazın)! Fiyat, iki histogramdan ve iki çizgiden (kırmızı ve mavi) herhangi birinin üzerindeyse, bu bir satın alma bölgesidir. MT4 versiyonu: https://www.mql5.com/en/market/product/3793 Fiyat iki satır arasında veya hist
Infinity Liquidity AI - Premium MT5 Liquidity & Smart Money  If you are interested in using a professional liquidity-based MT5 indicator at the lowest possible price, this is the best time to purchase. Once the early slots are gone, the price will not stay the same. Free Bonus Indicator Included After purchase, message us from your profile and you will receive 1 premium indicator completely free with Infinity Liquidity AI. This bonus is included for buyers who contact us after purchase. You wil
PipFinite Exit EDGE MT5
Karlo Wilson Vendiola
4.88 (32)
Did You Have A Profitable Trade But Suddenly Reversed? In a solid strategy, exiting a trade is equally important as entering. Exit EDGE helps maximize your current trade profit and avoid turning winning trades to losers. Never Miss An Exit Signal Again Monitor all pairs and timeframes in just 1 chart www.mql5.com/en/blogs/post/726558 How To Trade You can close your open trades as soon as you receive a signal Close your Buy orders if you receive an Exit Buy Signal. Close your Sell orders if
Honest Breakeven
Konstantin Gruzdev
Indicator gives an honest picture of changes in breakeven levels for transactions throughout the account history, and not just for open positions (screenshot 1). Accurate calculation of levels, taking into account accrued commissions, fees and swaps, allows you to evaluate trading results both visually and in Expert Advisors (screenshot 2). For Expert Advisors, the indicator in its standard form provides not only the break-even level, but also the number of positions, volume, and all additional
SMC Smart Flow Pro
Thitipong Nookhunthod
Short Description: SMC Smart Flow Pro is an advanced Smart Money Concept indicator that automatically detects Break of Structure (BOS), Change of Character (CHoCH), and projects precise TP/SL target levels on all timeframes — built for serious traders who trade with institutional flow. Full Description: SMC Smart Flow Pro is a premium Smart Money Concept (SMC) indicator for MetaTrader 5, engineered for traders who want to trade alongside institutional order flow. By automatically mapping m
**   All Symbols   x   All Timeframes   scan just by pressing scanner button ** Discount: The price is $50$, But now it is just $39, Limited time offer is active. *** Contact me  to send you instruction and add you in "Trend Reversal group" for sharing or seeing experiences with other users. Introduction: Trendlines are the most famous technical analysis in trading . Trendlines continually form on the charts of markets across all the different timeframes providing huge opportunities for traders
Bu ürünün alıcıları ayrıca şunları da satın alıyor
Neuro Poseidon MT5
Daria Rezueva
4.98 (44)
Neuro Poseidon is a new indicator by Daria Rezueva. It combines precise trading signals with adaptive TP/SL levels - creating best possible trades as a result! Message me and get  Neuro Poseidon Assistant  as a gift to automize your trading process! What makes it stand out? 1. Proven profitability on all assets and timeframes 2. Only confirmed BUY and SELL signals present on the chart 3. Adaptive TP & SL levels generated by the software for each trade 4. Easy to understand - suitable for al
SuperScalp Pro
Van Minh Nguyen
4.67 (27)
SuperScalp Pro – Gelişmiş Çoklu Filtre Scalping Gösterge Sistemi SuperScalp Pro, işlem fırsatlarını belirlemeye yardımcı olmak için klasik Supertrend ile birden fazla akıllı onay filtresini birleştiren gelişmiş bir scalping göstergesidir. M1’den H4’e kadar farklı zaman dilimlerinde verimli şekilde çalışır ve XAUUSD, BTCUSD ile majör Forex pariteleri için optimize edilmiştir. Gösterge, net Al ve Sat sinyalleri sunar ve ATR tabanlı otomatik giriş fiyatı, stop loss ve take profit seviyeleri hesapla
Önce dürüst olalım. Hiçbir gösterge tek başına sizi kârlı yapmaz. Eğer biri size aksini söylüyorsa, size bir hayal satıyordur. Mükemmel al/sat okları gösteren her gösterge, kusursuzmuş gibi görünecek şekilde yapılabilir — sadece geçmişin doğru bir bölümünü yakınlaştırıp kazanan işlemleri ekran görüntüsü almanız yeterlidir. Biz bunu yapmıyoruz.  SMC Intraday Formula bir araçtır. Piyasa yapısını sizin için okur, en yüksek olasılıklı fiyat bölgelerini belirler ve şu anda akıllı paranın izinin nası
Bu ürün 2026 piyasası için güncellendi ve en son MT5 sürümleri için optimize edildi. FİYAT GÜNCELLEME BİLDİRİMİ: Smart Trend Trading System şu anda $99 fiyatıyla sunulmaktadır. Sonraki 30 satın alma işleminden sonra fiyat $199 olacaktır. ÖZEL TEKLİF: Smart Trend Trading System satın aldıktan sonra bana özel mesaj gönderin, Smart Universal EA’yı ÜCRETSİZ olarak alın ve Smart Trend sinyallerinizi otomatik işlemlere dönüştürün. Smart Trend Trading System, daha temiz sinyaller, daha iyi trend yönü
Quantum TrendPulse
Bogdan Ion Puscasu
5 (25)
SuperTrend   ,   RSI   ve   Stochastic'in   gücünü tek bir kapsamlı göstergede birleştirerek işlem potansiyelinizi en üst düzeye çıkaran nihai işlem aracı olan   Quantum TrendPulse'u   tanıtıyoruz. Hassasiyet ve verimlilik arayan yatırımcılar için tasarlanan bu gösterge, piyasa trendlerini, momentum değişimlerini ve en uygun giriş ve çıkış noktalarını güvenle belirlemenize yardımcı olur. Temel Özellikler: SuperTrend Entegrasyonu:   Güncel piyasa trendlerini kolayca takip edin ve karlılık dalgası
Trend Catcher ind mt5
Ramil Minniakhmetov
5 (6)
TREND YAKALAYICI GÖSTERGE Trend Yakalayıcı Gösterge, yazarın tescilli ve özelleştirilmiş uyarlanabilir trend analiz göstergelerinin bir kombinasyonunu kullanarak piyasa fiyat hareketlerini analiz eder. Kısa vadeli gürültüyü filtreleyerek ve temel momentum gücüne, volatilite genişlemesine ve fiyat yapısı davranışına odaklanarak gerçek piyasa yönünü belirler. Ayrıca, hareketli ortalamalar, RSI ve volatilite filtreleri gibi yumuşatma ve trend filtreleme özelleştirilmiş göstergelerinin bir kombina
Entry In The Zone and SMC Multi Timeframe is a real-time 2-in-1 market analysis tool that combines market structure analysis and a No Repaint BUY / SELL signal system into a single indicator, built on Smart Money Concepts (SMC) — a widely adopted framework used by professional traders to understand market structure. This indicator helps you see the market more clearly, make decisions based on structure rather than guesswork, and focus on high-probability zones where price is more likely to react
Divergence Bomber
Ihor Otkydach
4.9 (90)
Bu göstergeyi satın alan herkese aşağıdaki ekstra içerikler ücretsiz olarak sunulmaktadır: Her işlemi otomatik olarak yöneten, Stop Loss ve Take Profit seviyelerini ayarlayan ve işlemleri strateji kurallarına göre kapatan özel yardımcı araç: "Bomber Utility" Göstergenin farklı varlıklar üzerinde kullanılmasına yönelik ayar dosyaları (set dosyaları) Bomber Utility için 3 farklı modda kullanım sunan ayar dosyaları: "Minimum Risk", "Dengeli Risk" ve "Bekle-Gör Stratejisi" Bu ticaret stratejisini hı
PrimeScalping
Temirlan Kdyrkhan
PrimeScalping is a powerful trading companion designed to generate high-probability entry signals with dynamic TP/SL/DP levels based on volatility. Built-in performance tracking shows win/loss stats, PP1/PP2 hits, and success rates — all updated live. Key Features: Buy/Sell signals with adaptive volatility bands Real-time TP/SL/DP levels based on ATR Built-in MA Filter with optional ATR/StdDev volatility Performance stats panel (Success, Profit/Loss, PP1/PP2) Alerts via popup, sound, push, or e
Power Candles V3 - Kendi Kendini Optimize Eden Güç Göstergesi Power Candles V3, döviz ve enstrüman gücünü, eklendiği her grafikte eyleme geçirilebilir bir ticaret planına dönüştürür. Sadece mumları renklendirmek yerine, arka planda canlı bir otomatik optimizasyon çalıştırır ve önünüzdeki sembol için en iyi Stop Loss, Take Profit ve sinyal eşiğini size sunar. Tek bir tıklama ile canlı ticarete uyarlanır - giriş, Stop Loss ve Take Profit ışınları grafikte tam fiyatlarla görünür ve uyarılar yön bil
FX Trend MT5 NG
Daniel Stein
5 (6)
FX Trend NG: Yeni Nesil Çoklu Piyasa Trend Zekâsı Genel Bakış FX Trend NG , çoklu zaman dilimlerinde çalışan profesyonel bir trend analiz ve piyasa izleme aracıdır. Piyasanın yapısını saniyeler içinde anlamanızı sağlar. Birden fazla grafik arasında geçiş yapmak yerine, hangi enstrümanların trendde olduğunu, momentumun nerede zayıfladığını ve hangi zaman dilimlerinin uyumlu olduğunu anında görebilirsiniz. Lansman Teklifi – FX Trend NG sadece $30 (6 Ay) veya $80 Ömür Boyu Lisans ile edinin. Zate
Atomic Analyst MT5
Issam Kassas
4.26 (35)
Bu ürün 2026 piyasası için güncellendi ve en son MT5 sürümleri için optimize edildi. FİYAT GÜNCELLEME BİLDİRİMİ: Atomic Analyst şu anda $99 fiyatıyla sunulmaktadır. Sonraki 30 satın alma işleminden sonra fiyat $199 olacaktır. ÖZEL TEKLİF: Atomic Analyst satın aldıktan sonra bana özel mesaj gönderin, Smart Universal EA’yı ÜCRETSİZ olarak alın ve Atomic Analyst sinyallerinizi otomatik işlemlere dönüştürün. Atomic Analyst, manuel trading, sinyal netliği ve EA otomasyonu için tasarlanmış, repaint
Gann Made Easy , bay teorisini kullanarak ticaretin en iyi ilkelerine dayanan, profesyonel ve kullanımı kolay bir Forex ticaret sistemidir. WD Gann. Gösterge, Zararı Durdur ve Kâr Al Seviyeleri dahil olmak üzere doğru SATIN AL ve SAT sinyalleri sağlar. PUSH bildirimlerini kullanarak hareket halindeyken bile işlem yapabilirsiniz. Satın alma işleminden sonra, alım satım talimatlarını ve harika ek göstergeleri ücretsiz olarak almak için lütfen benimle iletişime geçin! Muhtemelen Gann ticaret yöntem
M1 Quantum MT5
Hamed Dehgani
5 (3)
Geliştirici Notu: 149$ fiyatından yalnızca 10 lisans kaldı. Bu lisans satıldıktan sonra fiyat 169$ 'a yükselecektir. M1 Quantum , hızlı ve doğru alım-satım sinyalleri sunan, yerleşik Stop Loss, Take Profit ve akıllı para yönetimi içeren profesyonel bir M1 işlem sistemidir. M1 Quantum , art arda kazançlara odaklanarak hesabı hızlı bir şekilde büyütmek için tasarlanmış profesyonel bir para yönetimi sistemine sahiptir. M1 Quantum Göstergesi nin temel özellikleri M1 zaman dilimi ve tüm majör parite
Tanıtım       Quantum Breakout PRO   , Breakout Bölgeleri ile ticaret yapma şeklinizi değiştiren çığır açan MQL5 Göstergesi! 13 yılı aşkın ticaret tecrübesine sahip deneyimli tüccarlardan oluşan bir ekip tarafından geliştirilmiştir.       Kuantum Breakout PRO       yenilikçi ve dinamik koparma bölgesi stratejisiyle ticaret yolculuğunuzu yeni zirvelere taşımak için tasarlanmıştır. Kuantum Breakout Göstergesi, size 5 kar hedefi bölgesi ile kırılma bölgelerinde sinyal okları ve kırılma kutusuna da
GoldenX Entry MT5
Kareem Abbas
5 (12)
GoldenX Entry, adaptif Smart Entry Trend algoritmasına, sinyal skorlaması sistemine, piyasa rejimi algılayıcısına ve volatilite filtresine sahip bir MT5 indikatörüdür. Her sinyal; hesaplanmış bir giriş seviyesi, üç adet Take-Profit seviyesi (TP1, TP2, TP3) ve bir Stop-Loss seviyesi içerir. Farklı piyasa koşullarına uyum sağlamak için tasarlanmış çok katmanlı analitik yapı üzerine kuruludur ve yerleşik optimizasyon aracı ile istatistik takip sistemini birleştirir. Risk-ödül (RR) metrikleri ve geç
Bu ürün 2026 piyasası için güncellendi ve en son MT5 sürümleri için optimize edildi. FİYAT GÜNCELLEME BİLDİRİMİ: Smart Price Action Concepts şu anda $200 fiyatıyla sunulmaktadır. Sonraki 30 satın alma işleminden sonra fiyat $299 olacaktır. ÖZEL TEKLİF: Satın aldıktan sonra bana özel mesaj gönderin ve ÜCRETSİZ Bonus + Hediye alın. Öncelikle, bu trading aracının repaint yapmayan, geçmişi yeniden çizmeyen ve gecikmeyen bir indikatör olduğunu vurgulamak gerekir. Bu da onu profesyonel trading için
ARIPoint
Temirlan Kdyrkhan
1 (1)
ARIPoint is a powerful trading companion designed to generate high-probability entry signals with dynamic TP/SL/DP levels based on volatility. Built-in performance tracking shows win/loss stats, PP1/PP2 hits, and success rates all updated live. Key Features: Buy/Sell signals with adaptive volatility bands Real-time TP/SL/DP levels based on ATR Built-in MA Filter with optional ATR/StdDev volatility Performance stats panel (Success, Profit/Loss, PP1/PP2) Alerts via popup, sound, push, or email Cu
Azimuth Pro
Ottaviano De Cicco
5 (7)
Azimuth Pro V2: Synthetic Fractal Structure and Confirmed Entries for MT5 Overview Azimuth Pro is a multi-level swing structure indicator by Merkava Labs . Four nested swing layers, swing-anchored VWAP, ABC pattern detection, three-timeframe structural filtering, and closed-bar confirmed entries — one chart, one workflow from micro-swings to macro-cycles. This is not a blind signal product. It is a structure-first workflow for traders who care about location, context, and timing. V2 Launch Offe
Crystal Heikin Ashi Signals
Muhammad Jawad Shabir
5 (2)
Crystal Heikin Ashi Signals - Professional Trend & Signal Detection Indicator Advanced Heikin Ashi Visualization with Intelligent Signal System for Manual & Automated Trading Final Price: $149 ---------> Price goes up $10 after every 10 sales . Limited slots available — act fast . Overview Crystal Heikin Ashi Signals is a professional-grade MetaTrader 5 indicator that combines pure Heikin Ashi candle visualization with an advanced momentum-shift detection system. Designed for both manual traders
Market Structure Order Block Dashboard MT5, piyasa yapısını ve ana fiyat reaksiyon bölgelerini doğrudan grafikte okumak isteyen traderlar için tasarlanmış bir MT5 göstergesidir. BOS, ChoCH, Order Blocks, Fair Value Gaps (FVG), Likidite, Kill Zones, Volume Profile ve hızlı analiz için kompakt bir paneli bir araya getirir. Bu gösterge, piyasa yapısını, ICT ve Smart Money kavramlarını karar çerçevesi olarak kullanan traderlara yöneliktir. Trend devamlarını, olası tersine dönüşleri, fiyat dengesizli
Gem SIGNAL
Shengzu Zhong
5 (1)
GEM Signal Pro GEM Signal Pro, MetaTrader 5 için geliştirilmiş bir trend takip göstergesidir ve daha net sinyaller, daha düzenli işlem kurulumları ve daha pratik risk yönetimini doğrudan grafik üzerinde görmek isteyen yatırımcılar için tasarlanmıştır. Sadece basit bir ok göstermek yerine, GEM Signal Pro işlem fikrinin tamamını daha temiz ve daha okunabilir bir şekilde sunmaya yardımcı olur. Koşullar onaylandığında, gösterge giriş fiyatını, stop loss seviyesini ve take profit hedeflerini grafik ü
Reversion King Indicator
Eugen-alexandru Zibileanu
5 (4)
Şehre yeni bir Kral geldi - Gösterge + Emir Yönetimi göstergeleri (TP1 + TP2 + TP3) + Opsiyonel Telegram Sinyal Gönderici DAHİL (ÜCRETSİZ) (TAM TRADING ve SİNYAL SİSTEMİ) Altın için en iyi EA’mız: Gold Slayer Bu gösterge; gelişmiş bir strateji, özelleştirilebilir emir yönetimine sahip bir trading sistemi ve envelope uzantılarını birleştiren bir mean reversion sistemi içerir. Ayrıca RSI gibi birçok akıllı onay filtresiyle desteklenerek yüksek olasılıklı dönüş girişlerini AL ve SAT sinyalleriyle y
KURAMA GOLD SIGNAL PRO (MT5) — 7 Katmanlı Filtre, Otomatik TP/SL, Kalite Puanı ve Sinyal Geçmişi Kaydı | Eksiksiz XAUUSD Ticaret Sistemi Gerçek zamanlı olarak yeniden çizmez. Bir sinyal belirdiği anda ok, giriş, TP ve SL anında sabitlenir ve sonradan hareket etmez. Sizin işlem yaptığınız şey bu gerçek zamanlı sinyaldir. Ve v7.20'de, gerçekten gönderilen her sinyal otomatik olarak kaydedilir ve yeniden başlatmanın ardından olduğu gibi geri yüklenir. ALICILARA ÖZEL HEDİYE
Quant Direction MT5
Georgios Kalomoiropoulos
Quant Direction, 3 boyutlu bir piyasa analiz aracıdır. Çeşitli parametrelerdeki yüzdesel sapmaları hassas bir şekilde hesaplayan, tamamen objektif, algoritma tabanlı piyasa analizi sunar. Gelişmiş yapay zeka tabanlı modelleme araçları kullanılarak geliştirilen ve titizlikle test edilen bu algoritma, piyasayı benzersiz bir hassasiyetle analiz eder. Platformda herhangi bir döviz çiftini veya finansal enstrümanı analiz edebilirsiniz. İster kısa vadeli, ister günlük, isterse swing trading yapın, Qua
Grabber System MT5
Ihor Otkydach
4.83 (24)
Size mükemmel bir teknik gösterge olan Grabber’ı tanıtıyorum. Bu araç, kullanıma hazır bir “her şey dahil” işlem stratejisi olarak çalışır. Tek bir yazılım kodu içinde güçlü piyasa teknik analiz araçları, işlem sinyalleri (oklar), uyarı işlevleri ve push bildirimleri entegre edilmiştir. Bu göstergeyi satın alan herkes aşağıdaki hediyeleri ücretsiz olarak alır: Açık emirleri otomatik yönetmek için Grabber Yardımcı Aracı Kurulum, yapılandırma ve nasıl işlem yapılacağını adım adım anlatan video kıl
SmartScalping
Temirlan Kdyrkhan
SmartScalping is a powerful trading companion designed to generate high-probability entry signals with dynamic TP/SL/DP levels based on volatility. Built-in performance tracking shows win/loss stats, PP1/PP2 hits, and success rates — all updated live. Key Features: Buy/Sell signals with adaptive volatility bands Real-time TP/SL/DP levels based on ATR Built-in MA Filter with optional ATR/StdDev volatility Performance stats panel (Success, Profit/Loss, PP1/PP2) Alerts via popup, sound, push, or e
RelicusRoad Pro MT5
Relicus LLC
4.96 (24)
RelicusRoad Pro: Kantitatif Piyasa İşletim Sistemi ÖMÜR BOYU ERİŞİMDE %70 İNDİRİM (SINIRLI SÜRE) - 2.000+ TRADER'A KATILIN Neden çoğu trader "mükemmel" indikatörlere rağmen başarısız olur? Çünkü tekil kavramları boşlukta trade ederler. Bağlamı olmayan bir sinyal kumardır. Sürekli kazanmak için KONFLÜANS (UYUM) gerekir. RelicusRoad Pro basit bir ok indikatörü değildir. Tam bir Kantitatif Piyasa Ekosistemi dir. Tescilli volatilite modellemesini kullanarak fiyatın ilerlediği "Adil Değer Yolu"nu har
This indicator automatically detects  internal & swing market structure, Breaker block, Strong Imbalance, Liquidity Void, Volume imbalance. Features Full internal & swing market structure labeling in real-time Breaker block Strong Imbalance Liquidity Void volume imbalance After purchasing the indicator, the full source code is provided, and via indicator buffers it can be easily integrated into your Expert Advisors (EAs) for automated trading strategies.
Gladiator Indicator: Conquer the Markets Step into the trading arena with the Gladiator Indicator, a robust and highly effective trading tool designed exclusively for MQL5. Built for traders who want clear, actionable insights, Gladiator cuts through market noise to deliver precise Buy and Sell signals right on your charts. Whether you are a beginner looking for guidance or an experienced trader seeking a reliable confirmation tool, Gladiator provides the edge you need to battle the markets wi
Yazarın diğer ürünleri
AZ Risovalka levels drawing tool An indicator for simplifying the drawing of levels. Select the indicator mode for the body, shadow, or the whole candle in the settings. Click the 'Draw' button on the drawing panel to create a level, then click on the body or shadow of the candle and select the level color in the color menu that appears. The 'Delete' button to delete level you select, 'Color' to select the color of an already created level. You can set your own colors in the indicator menu (6 co
FREE
Az Speedometer measures   price impulse quality   — not just candle size, but whether that move is backed by real momentum, volume, and direction. A single glance tells you if the current bar is a meaningful push or just noise. "A green bar alone means nothing. Az Speedometer shows you green bars with high volume, a clean candle body, and three consecutive bullish closes — that's a signal worth taking." How it works: Speed ratio : Candle range vs ATR — how fast is price moving relative to its av
FREE
Attention - the indicator was initially developed for trading futures and the nuances of the Sunday session. This modification does not take into account the Sunday premarket, but is strictly tied to the time on the chart for correct operation on the spot market. Standard ATR indicator, you can enable ignoring abnormally large candles. It is possible to change the location of the displayed text in 4 corners of the chart. You can change the calculation period (days ago). Bonus - the indicator ha
FREE
AZ session scalper A small but useful session indicator, designed primarily for scalping. Enable the session you plan to trade, watch the reaction of the M5/M15 candlesticks to the level of the previous trading session, and enter. We always look at the reaction of the current session to the previous one. For example, if you trade the Americas, enable the European session, and watch how one session takes away liquidity from another. Important: adjust the time to your broker's time zone in the i
FREE
AZ Custom Daily Candle
Yurii Shvechikov
5 (1)
AZ_custom_daily_candle The indicator allows you to draw the contours of daily candles on small timeframes, plus you can customize the display of, for example, an H1 candle and see how it looks on the M5 chart (I think this is a useful setting for scalping). Further, it is possible to shift the beginning/end of drawing candles, change the background color, line thickness. Suggestions and wishes are welcome. v 1.05 (31/03/2025) By demand, I have added the ability to turn on/off daily maximum/mini
FREE
We all know that the start of an H4 candle can be 'shifted' depending on the broker. I wrote an indicator that draws candles "shifted" to the desired value. Plus, it draws H4 candles on smaller timeframes too. Works on timeframes up to H4, allowing for a clear comparison with the broker's results. There's a separate option to customize the candlestick body and outline fill. You can also customize the drawing for a specific period on history.
FREE
A simple indicator for calculating risk and automatically calculating the take profit line. In the settings, you enter the desired risk to profit ratio, the indicator will automatically calculate the volume for entry and show where to set the take-profit line to maintain the proportion. The risk is calculated based on your balance data. The information panel can be moved around the screen. The stop-loss line can also be moved, this will recalculate the entry volume and the take-profit position.
FREE
AZ daily scalper Mini indicator that draws possible correction levels based on the previous day. Then you go to a lower timeframe and look for entry patterns. In the settings, you can select the day on which you want to get these levels (by default, it calculates from the previous day). You can set the colors of the levels, the type of lines, the background color of the candle from which the calculation occurs
FREE
AZ Auto Levels builder ATR edition Indicator of automatic level drawing. For different instruments you need to play with the parameters to find the right ones. So, what is its idea - the indicator searches for levels of interest on the timeframe selected in the settings (by default H1). The search occurs only on candles that are 30% greater than the standard daily ATR of similar candles (you can change this in the settings). ATR is calculated for 20 days ago (also can be changed in the settings)
FREE
AZ ATR indicator (with volume correlation bonus) Standard ATR indicator, you can enable ignoring abnormally large candles. It is possible to change the location of the displayed text in 4 corners of the chart. You can change the calculation period (days ago). Bonus - the indicator has a correlation with volumes. Can be enabled to display a possible priority at the current moment in the market. What do the values ​​mean: Positive correlation (0.3 - 1.0): 0.3-0.7 - moderate connection
FREE
AZ daymaxlows
Yurii Shvechikov
The simplest indicator. You select the day of the week (Monday/Friday), the indicator draws the highs and lows of this day on the body and shadow of the candle. The fill color settings of the selected day, the style and color of the lines can be changed. The indicator searches for the nearest selected day. The idea is to speed up the visualization of the price reaction to the body/shadow of the candle of the selected day.
FREE
The simplest indicator. It emits a standard sound signal (an audio file from the standard MetaTrader library - alert.wav) after a period of time you select. Unfortunately I was unable to add the ability to select your file due to language restrictions.  Fixed a bug: when switching TF, a complete reinitialization of the indicator occurred, and it thought that a new time interval had arrived
FREE
AZ Mini ATR Indicator By popular demand, I've created a miniature version of the ATR indicator. In addition to its basic functions, such as calculating the average ATR based on specified parameters, it can change the color of a text bar depending on how far the price has already moved. If the price has moved more than 110% of its average ATR, the bar turns red; if it has moved less than 80%, the bar is green. The colors and parameters that influence the color change are configurable. This feat
FREE
# az_session_atr — Инструкция по настройкам ## Что показывает индикатор Индикатор показывает ATR для каждой сессии по отдельности. Если вы торгуете исключительно Европу - то иногда нет смысла смотреть на обычный дневной ATR Для каждой из трёх торговых сессий (Азия, Европа, Америка) отображается строка вида: ``` Asia ATR(20): 42.3 | Move: 18.7 (44%) | Left: 23.6 ``` | Поле | Значение | |---|---| | `ATR(20)` | Медианный ATR за 20 торговых дней | | `Move: 18.7 (44%)` | Сколько пипсов прошла ц
FREE
Filtrele:
Değerlendirme yok
Değerlendirmeye yanıt