Zigzag Structure
- 지표
- 버전: 2.60
- 업데이트됨: 6 4월 2026
- 활성화: 5
🚀 📦 ZIGZAG STRUCTURE PRO v2.6 – 기능
🧠 고급 시장 구조 엔진
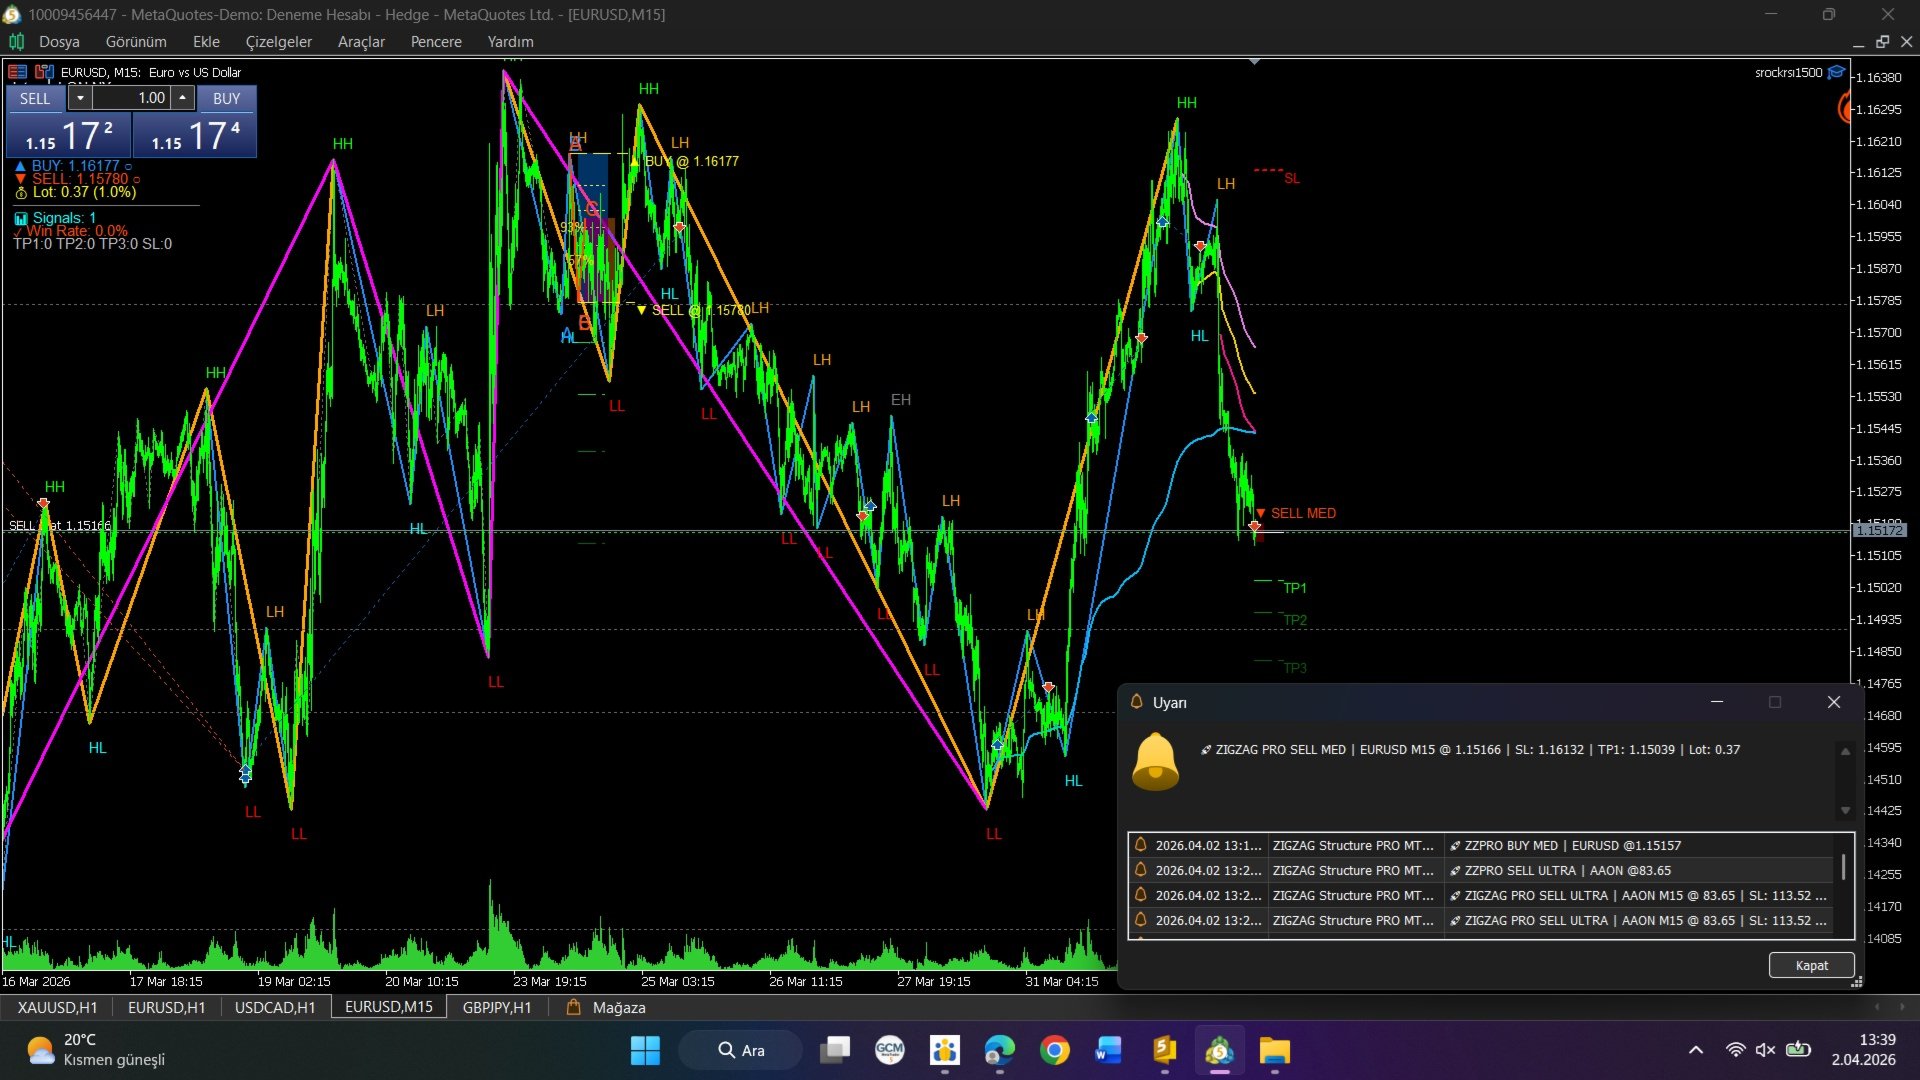
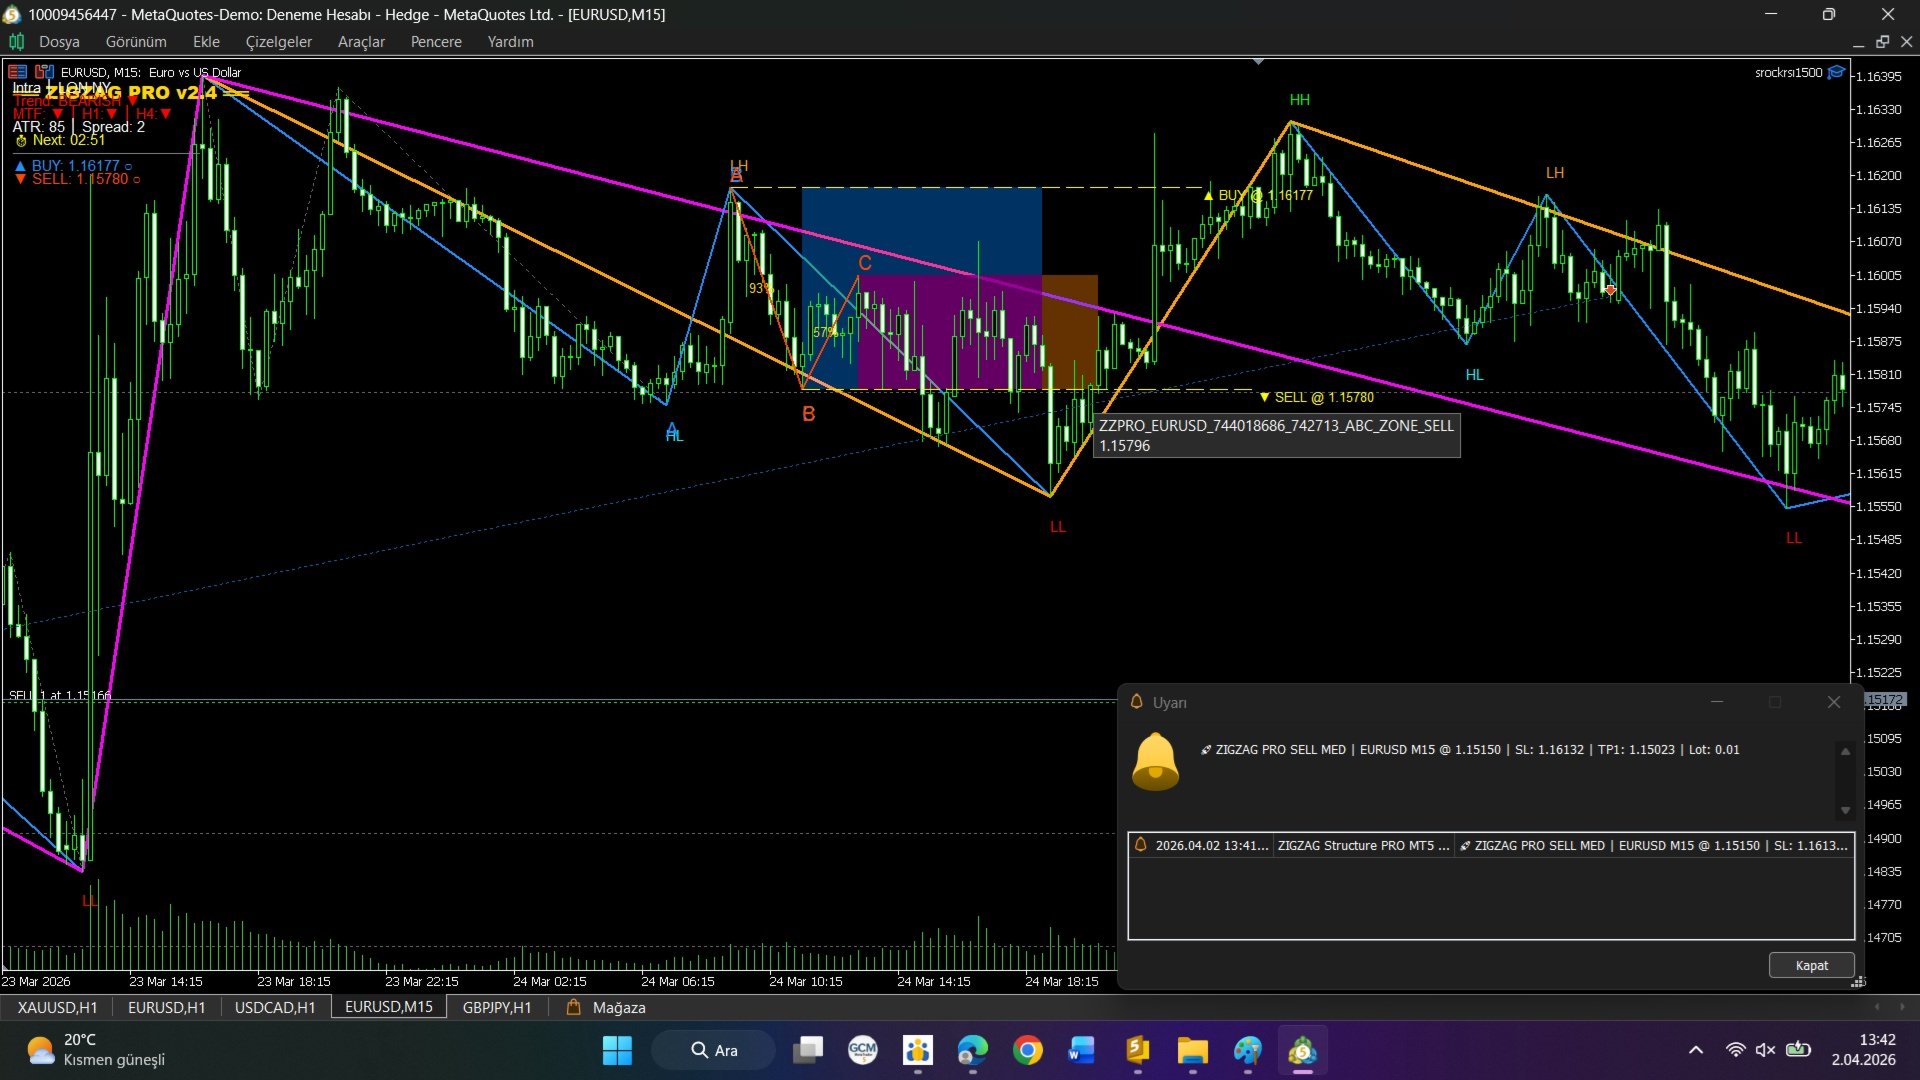
- 다중 레벨 ZigZag 분석 (L1–L4 구조)
- 자동 감지:
- 더 높은 고점 (HH – Higher High)
- 더 높은 저점 (HL – Higher Low)
- 더 낮은 고점 (LH – Lower High)
- 더 낮은 저점 (LL – Lower Low)
- ATR 허용 범위 내 동일 고점 / 동일 저점 감지
- 실시간 추세 분류 (상승 / 하락 / 횡보)
🔒 리페인트 없는 신호 시스템
- 안정적인 신호를 위한 피벗 잠금 메커니즘
- 설정 가능한 피벗 확인 (바 기반 잠금)
- 확인된 피벗만 사용하는 옵션
- 리페인트 및 거짓 신호 감소
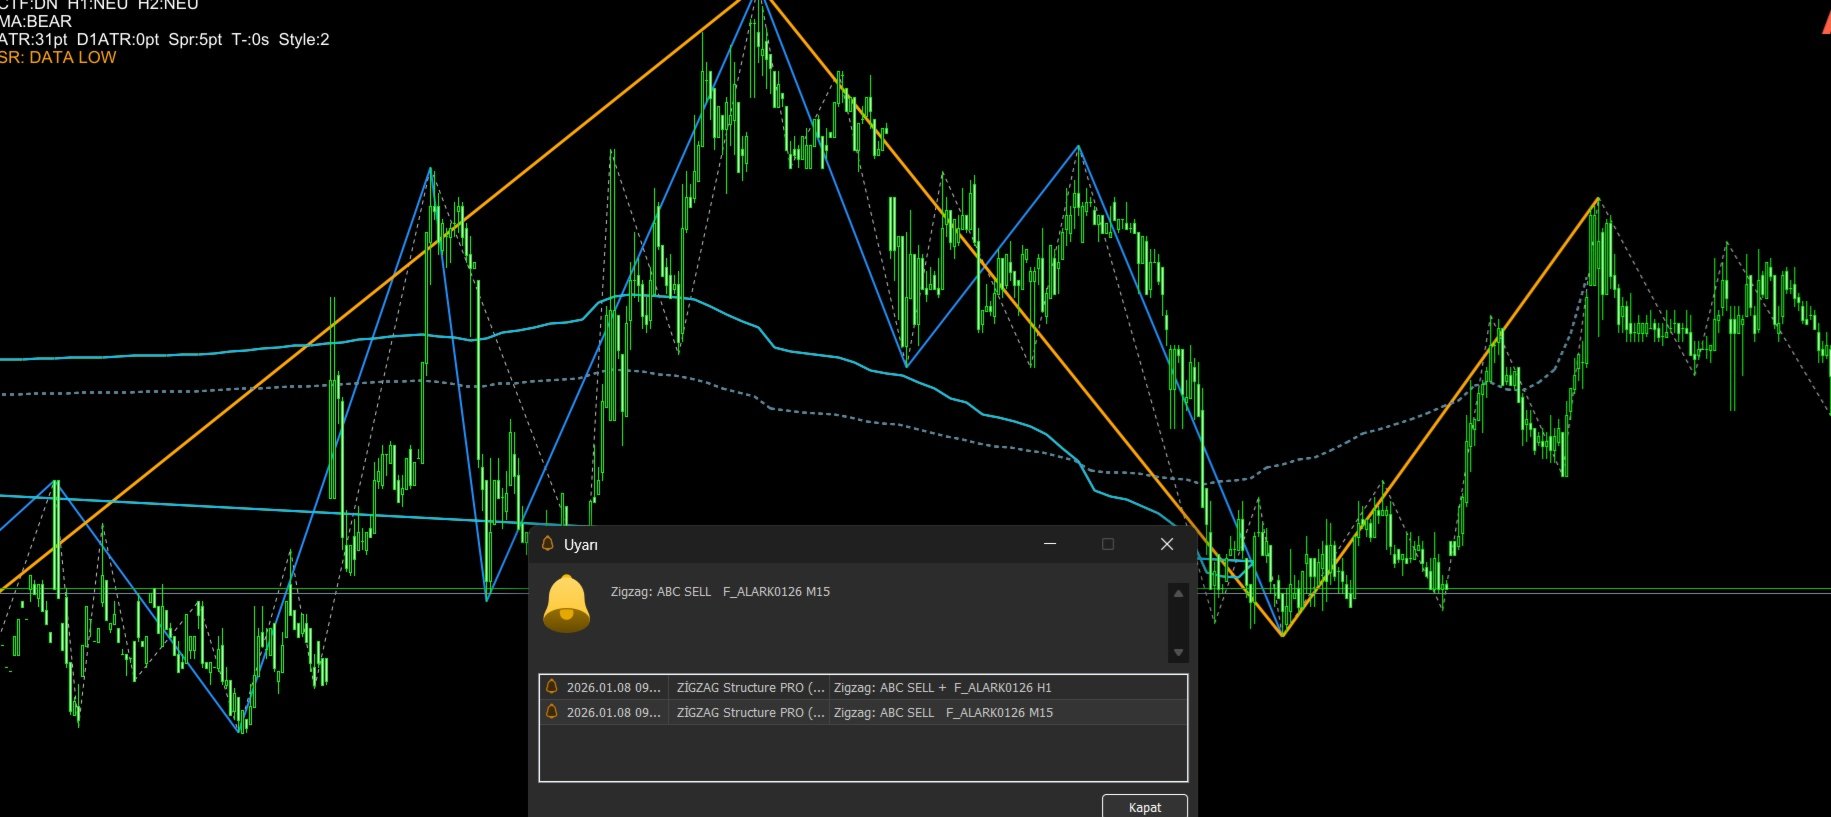
📊 ABC 패턴 인식
- ABC 패턴 자동 감지
- 스마트 돌파 검증
- 설정 가능한 확인 바 수
- 패턴 완성을 위한 최대 대기 로직
- 시각적 A-B-C 라벨링 및 구조 표시
📈 다중 타임프레임 분석 (MTF)
- 상위 타임프레임 편향 필터
- 이중 타임프레임 확인 (HTF1 + HTF2)
- EMA 기반 추세 편향 시스템
- 신호 정확도 향상
⚡ 스마트 필터링 시스템
- 추세 점수 필터 (0–100)
- 선택적 필터:
- MTF 필터
- 스마트 MA 필터
- 거래량 필터
- 컨플루언스 필터
- 노이즈 및 저품질 신호 감소
📉 스마트 이동평균 시스템
- 적응형 이동평균 (VIDYA)
- ATR 기반 스텝 이동평균
- 동적 추세 필터링
- 변동성 조정 신호
📊 AVWAP 및 구조 레벨
- 고점 및 저점에서의 앵커드 VWAP
- 자동 구조 레벨 감지
- 다중 레벨 지지/저항 구역
- 구조 병합 및 허용 범위 제어
📐 피보나치 시스템
- 자동 피보나치 되돌림
- 피보나치 확장 (TP 레벨)
- 설정 가능한 레벨
- 선택적 자동 피보나치 그리기
🎯 거래 관리 도구
- ATR 기반 손절 (SL)
- 다중 레벨 익절 (TP1, TP2, TP3)
- 고정 위험/보상 옵션
- 피보나치 기반 TP 모드
- 트레일링 스탑 시스템
🛡️ 리스크 관리
- 내장 리스크 계산기
- 리스크 비율 제어
- 브로커 SL 거리 검증
- 안전 버퍼 시스템
🕒 세션 필터
- 런던 / 뉴욕 / 아시아 세션 필터
- 사용자 정의 거래 시간
- GMT 오프셋 지원
🖥️ 시각화 및 UI 시스템
- 깔끔한 차트 시각화
- 신호 화살표 (강함 / 약함)
- 진입 구역 표시
- TP/SL 라인
- 대시보드 패널
🔔 알림 시스템
- 팝업 알림
- 소리 알림
- 푸시 알림
- 이메일 알림
⚙️ 완전 맞춤 설정 가능
- 거래 스타일 프리셋 (스캘핑 → 포지션)
- 신호 모드 (공격적 / 보수적 / 울트라 세이프)
- 필터, 시각 효과 및 동작에 대한 완전한 제어
⚡ 성능 및 안정성
- 최적화된 계산 엔진
- 낮은 CPU 사용량
- 효율적인 다중 바 처리
- 장기 안정적 운영