Zigzag Structure
- Indicadores
- Versão: 2.60
- Atualizado: 6 abril 2026
- Ativações: 5
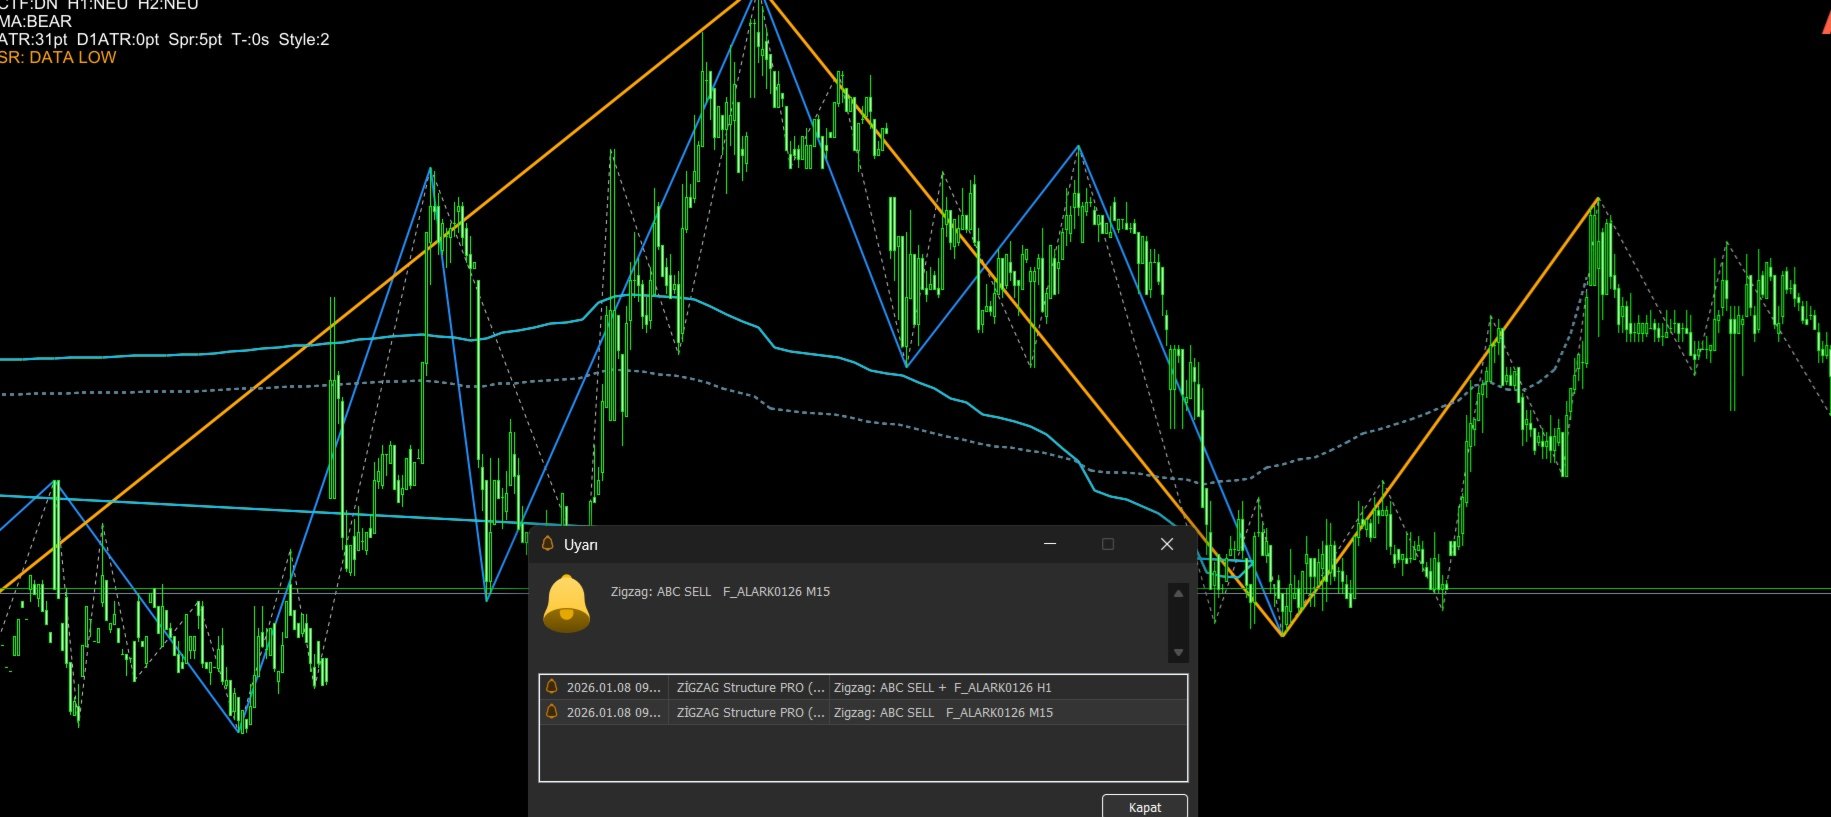
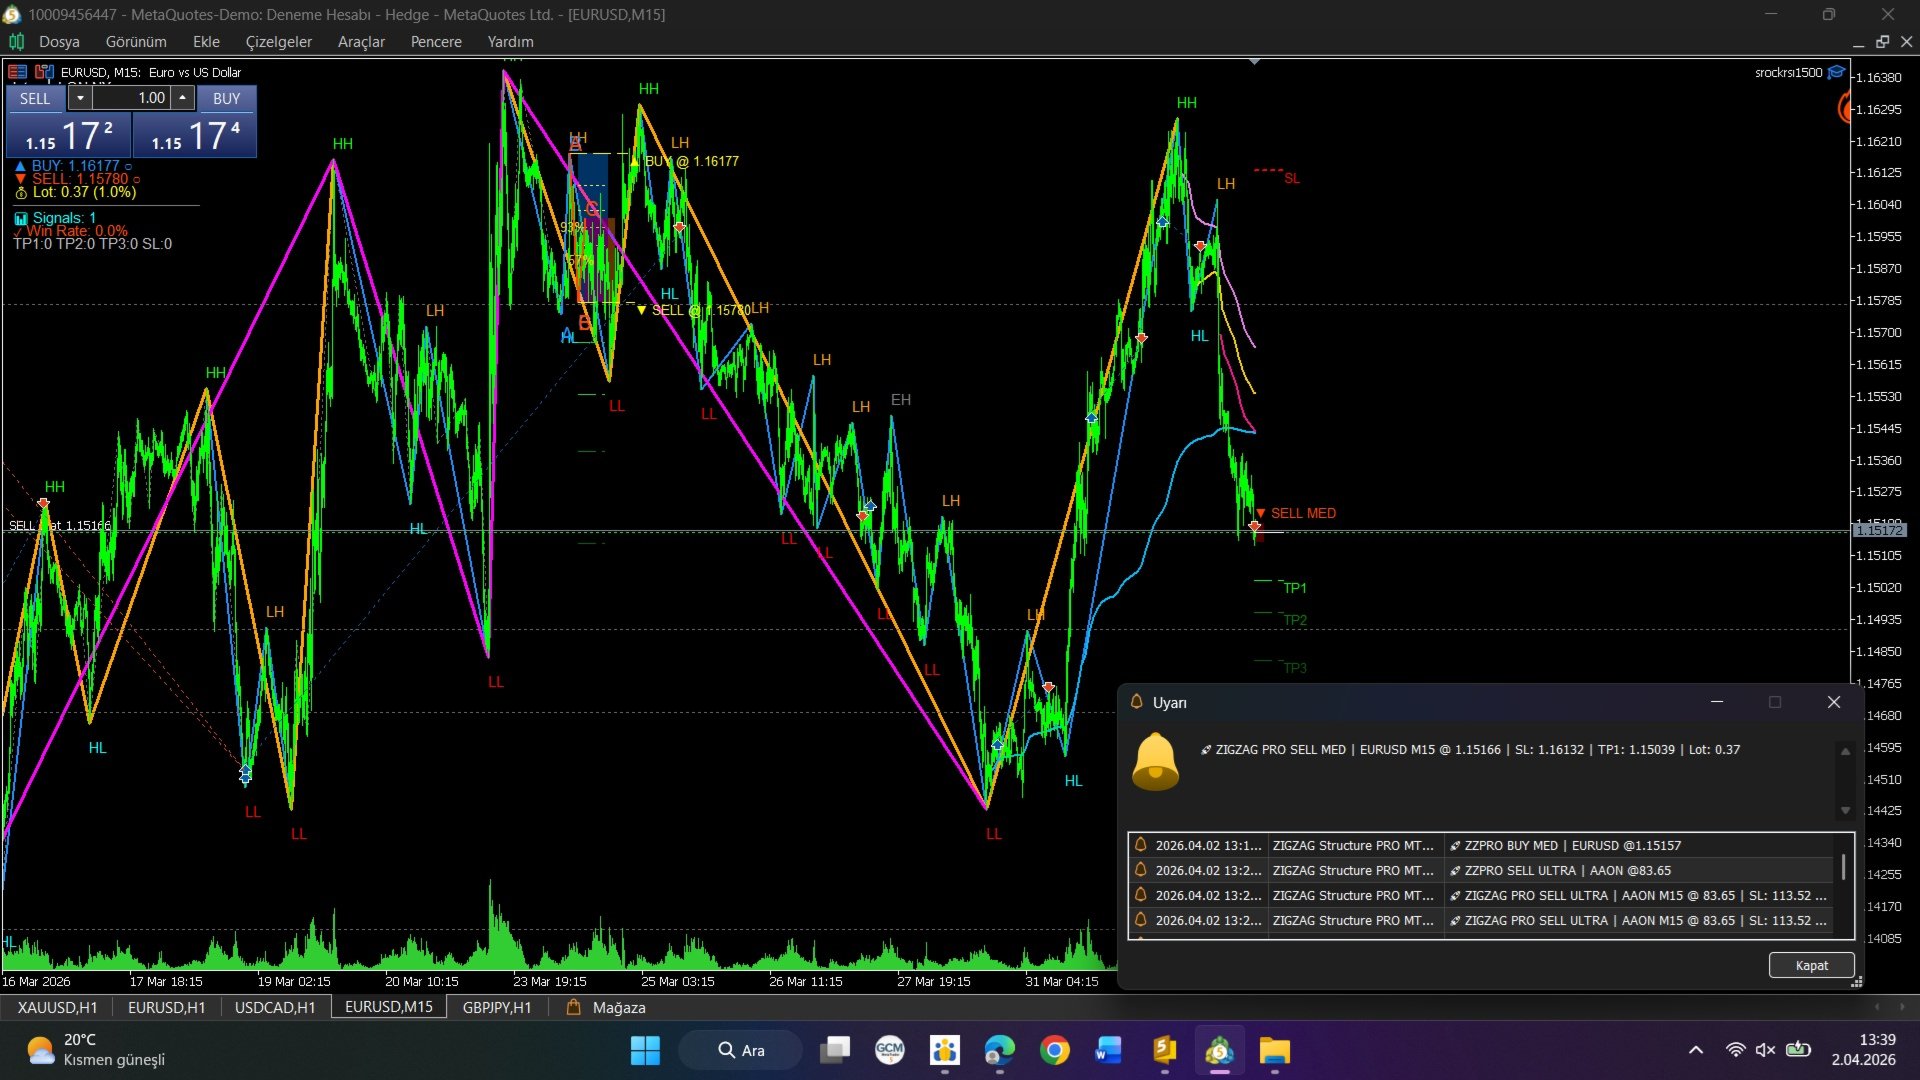
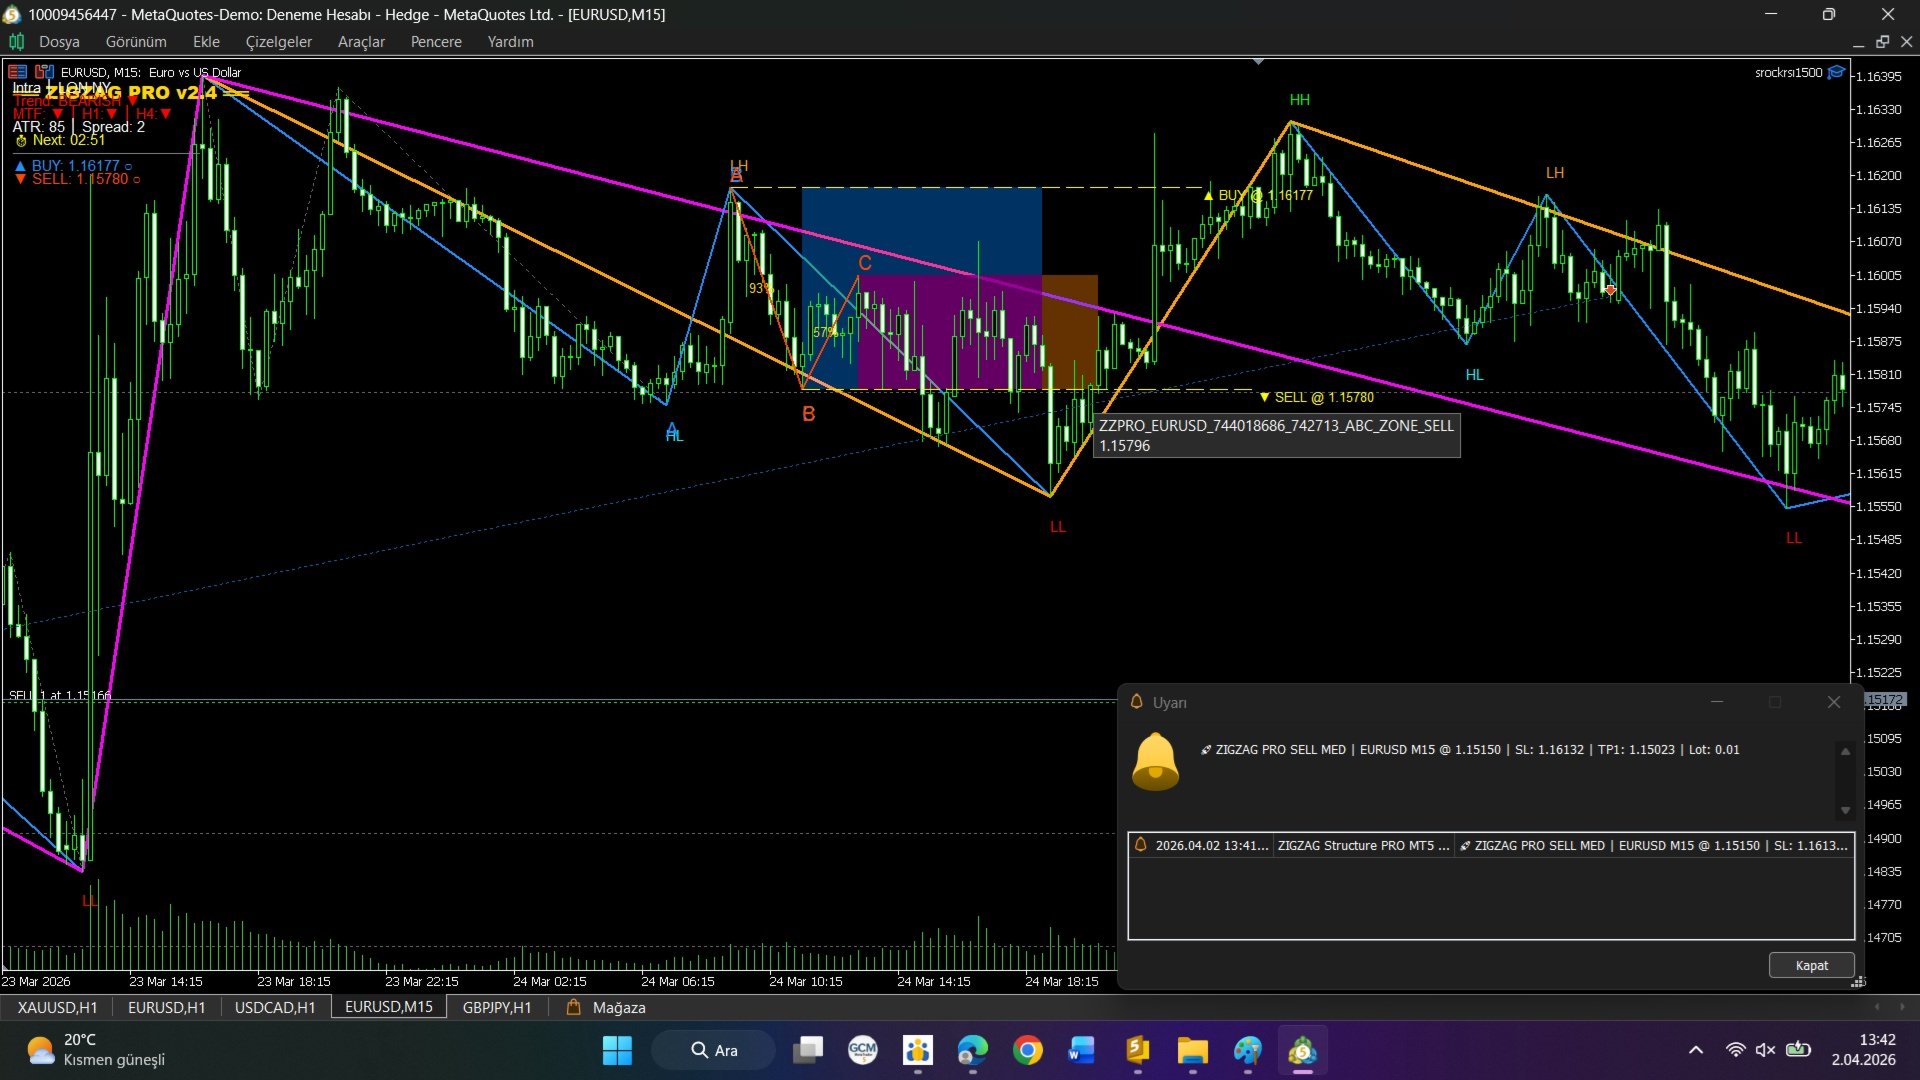
🚀 📦 ZIGZAG STRUCTURE PRO v2.6 – RECURSOS
🧠 MOTOR AVANÇADO DE ESTRUTURA DE MERCADO
- Análise ZigZag multinível (estrutura L1–L4)
- Detecção automática de:
- Máxima mais alta (HH – Higher High)
- Mínima mais alta (HL – Higher Low)
- Máxima mais baixa (LH – Lower High)
- Mínima mais baixa (LL – Lower Low)
- Detecção de Máxima Igual / Mínima Igual com tolerância ATR
- Classificação de tendência em tempo real (Altista / Baixista / Lateral)
🔒 SISTEMA DE SINAIS SEM REPINTURA
- Mecanismo de bloqueio de pivô para sinais estáveis
- Confirmação de pivô configurável (bloqueio baseado em barras)
- Opção de usar apenas pivôs confirmados
- Reduz repintura e sinais falsos
📊 RECONHECIMENTO DE PADRÕES ABC
- Detecção automática de padrão ABC
- Validação inteligente de rompimento
- Barras de confirmação configuráveis
- Lógica de espera máxima para conclusão do padrão
- Rotulagem visual A-B-C e exibição de estrutura
📈 ANÁLISE MULTI-TIMEFRAME (MTF)
- Filtro de viés de timeframe superior
- Confirmação de timeframe duplo (HTF1 + HTF2)
- Sistema de viés de tendência baseado em EMA
- Melhora a precisão dos sinais
⚡ SISTEMA DE FILTRAGEM INTELIGENTE
- Filtro de pontuação de tendência (0–100)
- Filtros opcionais:
- Filtro MTF
- Filtro MA inteligente
- Filtro de volume
- Filtro de confluência
- Reduz ruído e sinais de baixa qualidade
📉 SISTEMA DE MÉDIA MÓVEL INTELIGENTE
- Média móvel adaptativa (VIDYA)
- Média móvel escalonada baseada em ATR
- Filtragem dinâmica de tendência
- Sinais ajustados à volatilidade
📊 AVWAP E NÍVEIS DE ESTRUTURA
- VWAP ancorado a partir de máximas e mínimas
- Detecção automática de níveis de estrutura
- Zonas multinível de suporte/resistência
- Fusão de estruturas e controle de tolerância
📐 SISTEMA FIBONACCI
- Retrações de Fibonacci automáticas
- Extensões de Fibonacci (níveis de TP)
- Níveis configuráveis
- Desenho automático de Fibonacci opcional
🎯 FERRAMENTAS DE GESTÃO DE OPERAÇÕES
- Stop Loss (SL) baseado em ATR
- Take Profit multinível (TP1, TP2, TP3)
- Opção de Risco/Retorno fixo
- Modo TP baseado em Fibonacci
- Sistema de trailing stop
🛡️ GESTÃO DE RISCOS
- Calculadora de riscos integrada
- Controle de percentual de risco
- Validação de distância SL da corretora
- Sistema de buffer de segurança
🕒 FILTRO DE SESSÕES
- Filtros de sessão Londres / Nova York / Ásia
- Horários de negociação personalizados
- Suporte a offset GMT
🖥️ SISTEMA VISUAL E INTERFACE
- Visualização limpa do gráfico
- Setas de sinal (Forte / Fraco)
- Exibição de zona de entrada
- Linhas de TP/SL
- Painel de controle (Dashboard)
🔔 SISTEMA DE ALERTAS
- Alertas popup
- Alertas sonoros
- Notificações push
- Alertas por e-mail
⚙️ TOTALMENTE PERSONALIZÁVEL
- Presets de estilo de negociação (Scalping → Posição)
- Modos de sinal (Agressivo / Conservador / Ultra Seguro)
- Controle total sobre filtros, visuais e comportamento
⚡ DESEMPENHO E ESTABILIDADE
- Motor de cálculo otimizado
- Baixo uso de CPU
- Processamento eficiente de múltiplas barras
- Operação estável a longo prazo