Logarithmic Regression Channel Pro

Un indicatore avanzato che combina la regressione logaritmica dinamica con strumenti di analisi trend intelligente, visualizzazioni personalizzabili e filtri avanzati per confermare la direzione del mercato.

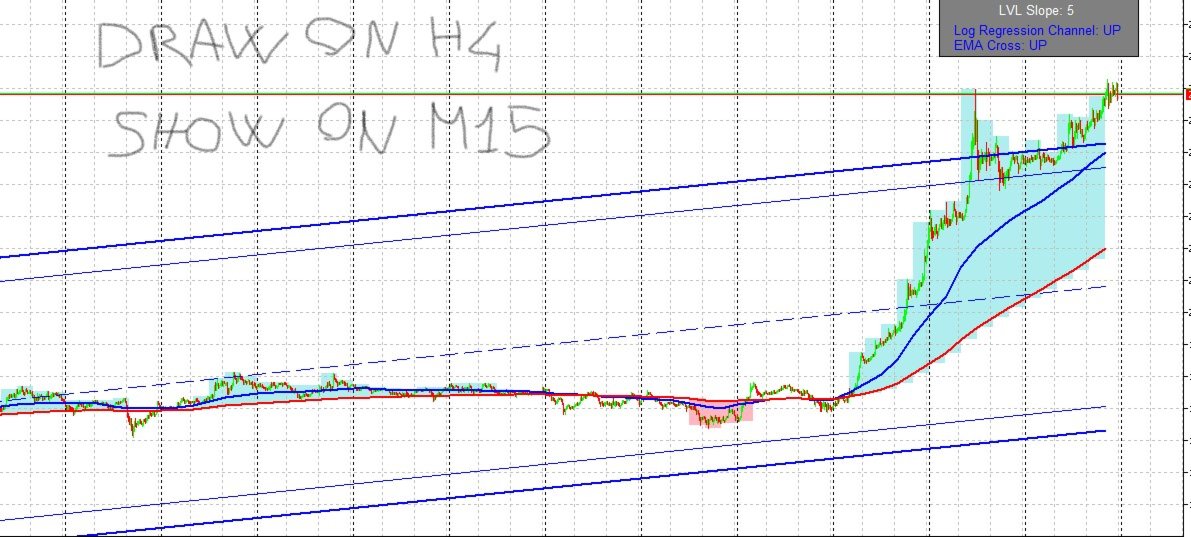
 Come utilizzare l’indicatore Logarithmic Regression Channel - Trend (Disegnato su timeframe superiori)
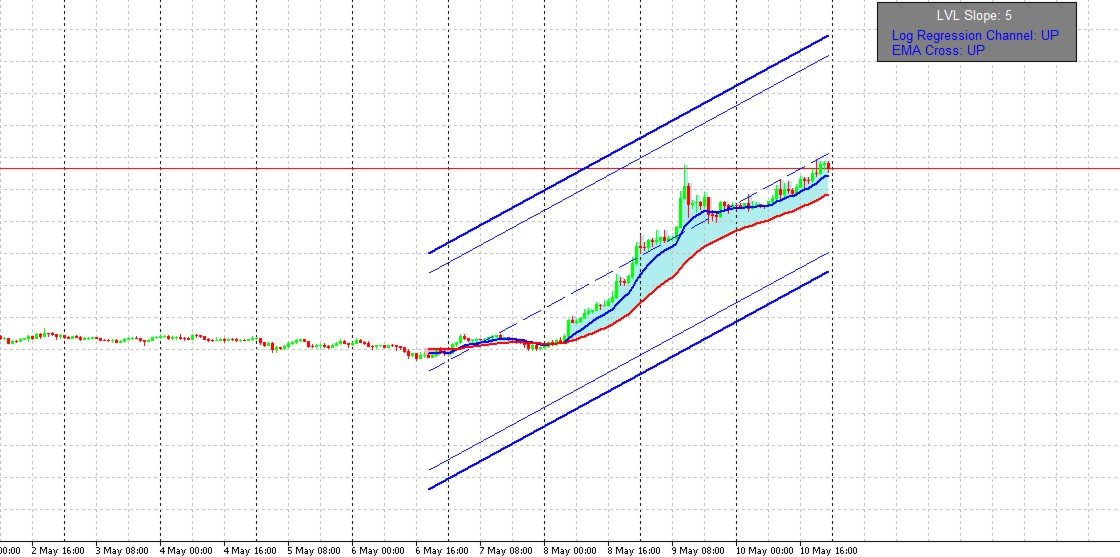
 Trend rialzista
(slope ≥ +3)

  • Si può acquistare in due modi:

    • Quando il prezzo rimbalza sulla banda inferiore del canale (trendline bassa).

    • Quando il prezzo supera la linea centrale del canale.

  • Seguire sempre la direzione del canale.

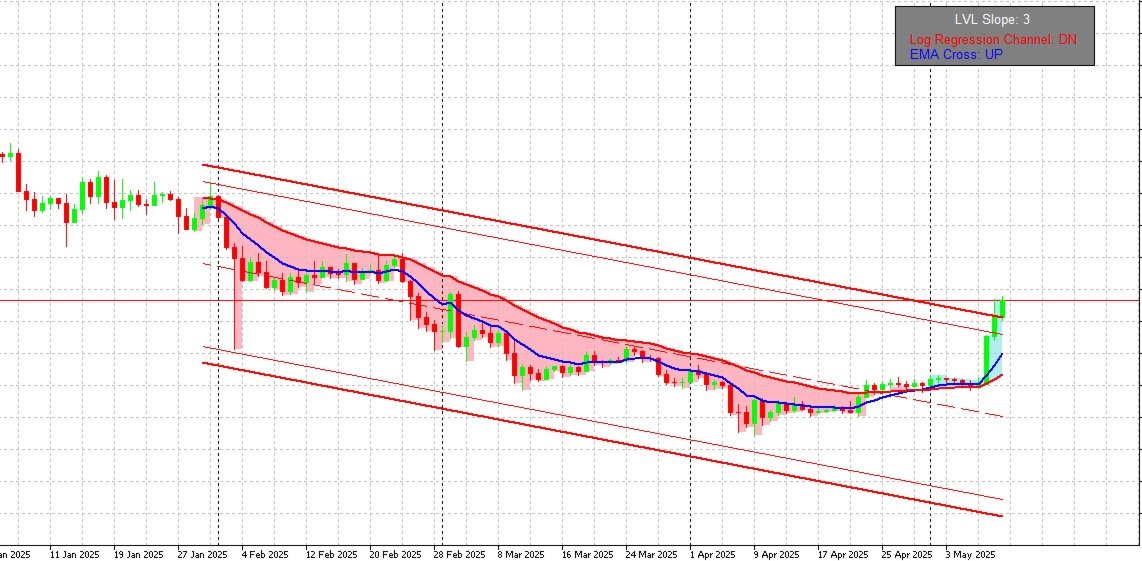
 Trend ribassista

(slope ≥ +3) 

  • Si può vendere in due modi:

    • Quando il prezzo rimbalza sulla banda superiore del canale (trendline alta).

    • Quando il prezzo scende sotto la linea centrale del canale.

  • Anche in questo caso, seguire sempre la direzione del canale.

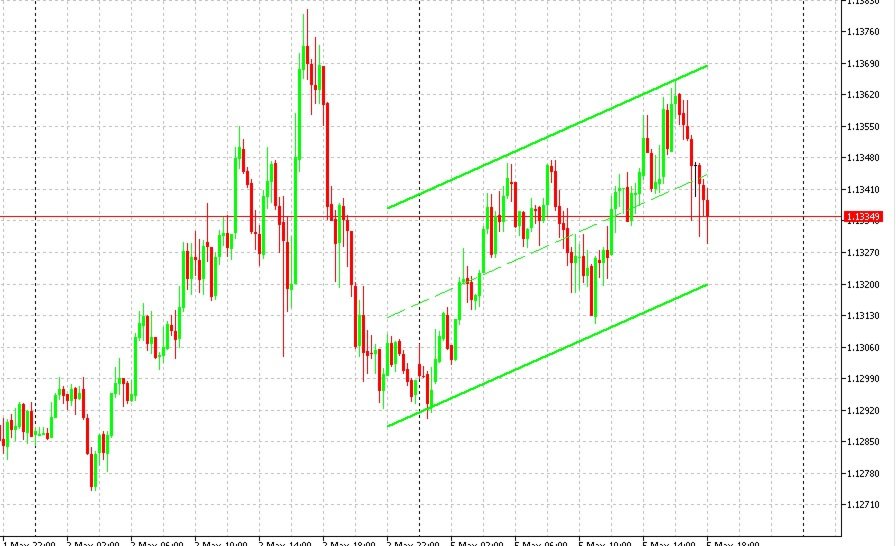
 Fase laterale (slope ≈ 0-2)

  • È possibile tradare rimbalzi sia sulla banda superiore che inferiore, sfruttando l’oscillazione del prezzo nel canale.

 Utilizzo delle medie mobili

  • È possibile usare l’incrocio delle medie mobili per entrare, ma solo nella direzione del trend del canale.

  • In alternativa, dopo l’incrocio, si può aspettare che lo spazio tra le medie si colori:

    • Azzurro → possibile segnale long.

    • Rosso → possibile segnale short.

 Approccio contrarian (avanzato)

  • Quando il colore tra le medie è rosso, si può ipotizzare un ipervenduto:

    • In caso di trend ribassista, attendere un rimbalzo sulla banda inferiore per valutare un long di breve durata con un ritorno sulla linea centrale.


 Funzionalità principali

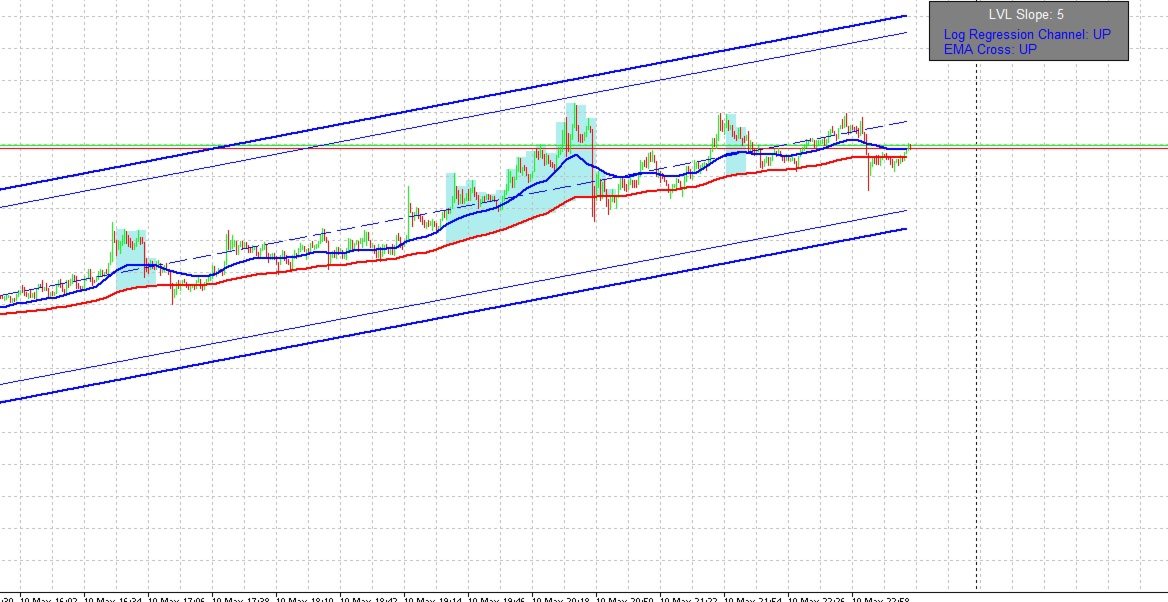
 Canale di regressione logaritmica

Visualizza in tempo reale una curva adattiva che segue il prezzo su base logaritmica, utile per strumenti con crescita esponenziale (come indici o criptovalute).

Bande mobili colorate
Il canale superiore e inferiore segue la regressione e si colora in automatico:

  •  Trend rialzista (bande blu)

  •  Trend ribassista (bande rosse)

 Rettangoli riempiti tra le bande
Puoi attivare un riempimento tra le bande per migliorare la visualizzazione della zona del canale attivo.

 Pendenza e direzione visibili
Un'etichetta mostra la pendenza attuale del canale, utile per capire la forza del trend.

 EMA veloce e lenta + riempimento dinamico
Puoi attivare due medie mobili (veloce e lenta), che mostrano un riempimento colorato quando sono distanti, come conferma aggiuntiva del trend.

 Filtro di distanza tra le EMA: Sensibilità intelligente basata sul contesto

L'indicatore include un filtro avanzato che analizza la distanza tra la EMA veloce e la EMA lenta per rafforzare la validazione del trend.

Come funziona?

  • Il filtro calcola la distanza percentuale tra le due medie.

  • Se la distanza supera una certa soglia (calcolata in punti adattivi), viene attivata una colorazione nel riempimento tra le due linee.

  • Questo evita falsi segnali quando le medie sono troppo vicine.

 Sensibilità regolabile ( Sensitivity Level )

  • Livello 1 = massima sensibilità
    Il filtro si attiva anche con distanze minime → perfetto per timeframe brevi come M1, M5, M15.

  • Livello  10 = bassa sensibilità
    Serve una distanza più ampia tra le medie → adatto a H1, H4, Daily.

 Adattamento automatico al simbolo

Il filtro è intelligente e contestuale: la soglia si adatta in base alla scala dei prezzi del simbolo (es. EURUSD vs NASDAQ), mantenendo coerenza tra strumenti diversi.

 Parametri principali

  • Timeframe : timeframe sul quale vengono disegnati i canali visualizzabili su tutti gli altri timeframe

  • Show EMA : attiva le medie mobili

  • EMA Fast / EMA Slow : periodi delle medie mobili

  • Show Zone : attiva il riempimento colorato tra le medie

  • Sensitivity Level : livello del filtro distanza medie (1 = più sensibile, 10 = meno sensibile)

 Compatibilità

  •  Timeframe: Tutti i timeframe (ottimizzato per M15–H4)

  •  Strumenti: Valute, indici, materie prime, crypto

  •  Multi-instance: Può essere applicato più volte con parametri diversi

 Ideale per:

  • Trader discrezionali e sistematici

  • Strategie trend-following

  • Analisi ciclica e cicli di espansione/contrazione

  • Trading algoritmico o semi-automatico (può essere integrato in EA)

 Codice completamente sviluppato in MQL5 nativo, nessuna dipendenza da indicatori esterni.

Önerilen ürünler
Elite Harmony Signals Pro Panoramica Elite Harmony Signals è un indicatore sofisticato di analisi tecnica che visualizza rettangoli dinamici che forniscono zone di trading chiare e segnali di conferma per decisioni migliorate. Caratteristiche Principali Zone Rettangolo Dinamiche Estensione in Tempo Reale : I rettangoli si estendono automaticamente all'azione corrente del prezzo Chiusura Intelligente : I rettangoli si chiudono solo quando appaiono segnali opposti Conferma Visiva : Zone di trading
Gold Venamax MT5
Sergei Linskii
3.5 (2)
Gold Venamax - bu en iyi hisse senedi teknik göstergesidir. Gösterge algoritması bir varlığın fiyat hareketini analiz eder ve oynaklığı ve potansiyel giriş bölgelerini yansıtır. Gösterge özellikleri: Bu, rahat ve karlı ticaret için Magic ve iki Blok trend oku içeren süper bir göstergedir. Grafikte blokları değiştirmek için Kırmızı Düğme görüntülenir. Magic, gösterge ayarlarında ayarlanır, böylece göstergeyi farklı Blokları görüntüleyen iki grafiğe yükleyebilirsiniz. Gold Venamax farklı ok tampo
Price Magnet — Price Density and Attraction Levels Indicator Price Magnet is a professional analytical tool designed to identify key support and resistance levels based on statistical Price Density. The indicator analyzes a specified historical period and detects price levels where the market spent the most time. These zones act as “magnets,” attracting price action or forming a structural base for potential reversals. Unlike traditional Volume Profile tools, Price Magnet focuses on price-time d
RSI Currency Strength Meter is a powerful and elegant multi-currency indicator that measures the real-time relative strength of the 8 major currencies using RSI logic. By calculating the smoothed performance of each currency across its major pairs and applying the RSI formula, it delivers clean and responsive strength lines that make it easy to spot which currencies are truly strong or weak at any moment. This indicator is particularly useful for visualizing currency correlations and divergence
Volume Profile for MetaTrader 5 Price movement alone does not explain where the market is actually traded . What matters is where volume is built and how these areas shift over time. This Volume Profile displays the volume distribution directly on the chart , making it clear which price levels were accepted by the market and where rejection occurred. This allows structurally relevant zones to be identified and integrated into individual decision-making processes. The tool is designed for high pe
BREAK RETEST NON-REPAINT. WORKS BEST AT M15 AND ABOVE.  Benefits Fewer false breakouts . Combining close confirmation + retest + previous-close filter greatly reduces noise vs. raw high/low breaks. Tighter execution plans . The drawn level line gives an objective spot for entries, stop placement (just beyond the level), and partial-take-profit structure. Non-repainting confidence . Signals are placed on current bar. Flexible across markets . Works on FX, indices, metals, crypto; scalping on M15
Visual Dolphin Indicator
AL MOOSAWI ABDULLAH JAFFER BAQER
Visual Dolphin Indicator Unlock the rhythm of the market with the Visual Dolphin Indicator, your ultimate tool for identifying and capitalizing on market trends with clarity and confidence. Designed for both novice and experienced traders, this indicator eliminates the noise and guesswork, providing crystal-clear buy and sell signals directly on your chart. The Logic Behind the Waves The core of the Visual Dolphin Indicator is a sophisticated yet intuitive dual-wave system based on moving avera
Volume Profile V6
Andrey Kolesnik
4.67 (3)
Piyasa Hacim Profili Göstergesi + Akıllı Osilatör. Döviz çiftleri, hisse senetleri, vadeli işlemler, kripto paralar gibi hemen hemen tüm enstrümanlarda hem gerçek hacimler hem de tick hacimleri üzerinde çalışır. Profil oluşturma aralığını otomatik olarak (örneğin bir haftalık veya bir aylık vb.) belirleyebileceğiniz gibi, sınırları (kırmızı ve mavi iki dikey çizgi) hareket ettirerek aralığı manuel olarak da ayarlayabilirsiniz. Histogram şeklinde görüntülenir. Belirli bir seviyedeki histogram gen
CosmiCLab SMC FIBO CosmiCLab SMC FIBO is a professional trading indicator designed for traders who use Smart Money Concepts (SMC), market structure analysis and Fibonacci retracement levels. The indicator automatically detects market swings and builds Fibonacci levels based on the latest impulse movement. It also identifies market structure changes such as BOS (Break of Structure) and CHOCH (Change of Character), helping traders understand the current market direction. CosmiCLab SMC FIBO also pr
Visual Momentum Flow Indicator
AL MOOSAWI ABDULLAH JAFFER BAQER
Visual Momentum Flow Indicator: Decode the Market's True Intent Are you tired of indicators that only work in trending markets, leaving you confused during consolidations? Do you struggle to distinguish between a genuine momentum breakout and a false move within a ranging market? The Visual Momentum Flow Indicator is your solution. This meticulously engineered tool is designed not just to follow trends, but to interpret the very character of the market, giving you a distinct edge by clearly ide
Order Blocks Scan MT5
Reza Aghajanpour
3.5 (2)
**   All Symbols   x   All Time frames   scan just by pressing scanner button ** Discount : Only 4   of 5 copy  is 35$. ***   Contact me  to send you instruction   and add you in "Order Block group" for sharing or seeing experiences with other users. Introduction: The central banks and financial institutions mainly drive the market,   Order block is considered a market behavior that indicates accumulation of orders from banks and institutions, then   the market tends to make a sharp move(Imbala
Hello friends. I wrote this utility specifically for use in my profile with a large number of Expert Advisors and sets ("Joint_profiles_from_grid_sets"   https://www.mql5.com/en/blogs/post/747929 ). Now, in order to limit losses on the account, there is no need to change the "Close_positions_at_percentage_of_loss" parameter on each chart. Just open   one   additional chart, attach this utility and set the desired percentage for closing all trades on the account. The utility has the following fu
Force Trade X MT5 is an EA based on Force Index. Force Index parameters such as Period, BuyShift, BuyValue, SellShift, and SellValue can be adjusted. Force Trade X MT5 applies BTN TECHNOLOGY's state-of-the-art intelligent technology to help you create optimal results for your trades. May your dreams come true through Force Trade X MT5. Good luck. === Inquiries === E-Mail:support@btntechfx.com
Premium seviye, %80'den fazla doğru tahmin doğruluğuna sahip benzersiz bir göstergedir! Bu gösterge en iyi Ticaret Uzmanları tarafından iki aydan uzun süredir test edilmiştir! Yazarın göstergesini başka hiçbir yerde bulamazsınız! Ekran görüntülerinden bu aracın doğruluğunu kendiniz görebilirsiniz! 1, sona erme süresi 1 mum olan ikili opsiyon ticareti için harikadır. 2 tüm döviz çiftleri, hisse senetleri, emtialar, kripto para birimleri üzerinde çalışır Talimatlar: Kırmızı ok göründüğü an
Gösterge, tarihsel olanlarla karşılaştırılabilecek güncel teklifler oluşturur ve bu temelde bir fiyat hareketi tahmini yapar. Gösterge, istenen tarihe hızlı navigasyon için bir metin alanına sahiptir. Seçenekler: Sembol - göstergenin göstereceği sembolün seçimi; SymbolPeriod - göstergenin veri alacağı dönemin seçimi; GöstergeRenk - gösterge rengi; Ters - doğru tırnakları tersine çevirir, yanlış - orijinal görünüm; Sonraki, tarihi girebileceğiniz ve 'enter' tuşuna basarak hemen atlayab
Apex Fibo Tracer — Smart Auto-Fibonacci Tool Apex Fibo Tracer is a professional analytical indicator that automates one of the most powerful methods in technical analysis — Fibonacci retracement levels. By combining a high-precision ZigZag algorithm with dynamic Fibonacci plotting, the tool delivers instant and accurate visualization of market structure directly on your chart. Most traders lose valuable seconds manually adjusting Fibonacci grids during high volatility. Apex Fibo Tracer eliminate
Key Features: 200+ Fully Implemented Patterns   across all categories Advanced Market Structure Analysis Smart Money Integration   (Wyckoff, Order Blocks, Liquidity) Professional Risk Management Multi-Timeframe Analysis AI-Powered Confidence Scoring Advanced Visualization Real-time Alerts Pattern Categories: Single Candle Patterns (Hammer, Doji, Marubozu, etc.) Multi-Candle Patterns (Engulfing, Stars, Harami, etc.) Chart Patterns (Head & Shoulders, Cup & Handle, Triangles, etc.) Harmonic Pattern
FREE
L'indicatore SMC Venom Model BPR è uno strumento professionale per i trader che operano nell'ambito del concetto di Smart Money (SMC). Identifica automaticamente due modelli chiave sul grafico dei prezzi: FVG   (Fair Value Gap) è una combinazione di tre candele, in cui c'è un gap tra la prima e la terza candela. Forma una zona tra livelli in cui non c'è supporto di volume, il che spesso porta a una correzione dei prezzi. BPR   (Balanced Price Range) è una combinazione di due modelli FVG che for
Trade smarter, not harder: Empower your trading with Harmonacci Patterns This is arguably the most complete harmonic price formation auto-recognition indicator you can find for the MetaTrader Platform. It detects 19 different patterns, takes fibonacci projections as seriously as you do, displays the Potential Reversal Zone (PRZ) and finds suitable stop-loss and take-profit levels. [ Installation Guide | Update Guide | Troubleshooting | FAQ | All Products   |  Get Help ] It detects 19 differen
# XAUUSD Gold Master v4.1 — Professional Gold Trading Indicator for MetaTrader 5 Gold Master v4.1 is a comprehensive, professional-grade trading indicator developed exclusively for XAUUSD (Gold) on MetaTrader 5. It combines multiple technical analysis disciplines into a single, unified system designed to identify high-probability trading opportunities in the gold market. The indicator integrates signal generation, risk management, market context analysis, and a fully interactive information pa
Quantum Channel Pro , trendleri, dönüş noktalarını ve piyasa gürültüsünü doğru bir şekilde belirlemek için tasarlanmış çok kanallı bir volatilite analiz aracıdır. Uyarlanabilir standart sapma kanalları kullanarak üç fiyat seviyesi (iç, orta ve dış) çizer ve daha net işlem kararları almayı sağlar. Temel Özellikler: Üç akıllı kanal (1σ, 2σ, 3σ) Gerçek zamanlı olasılık istatistikleri Uyarlanabilir gürültü filtreleme Tüm zaman dilimlerinde kullanılabilir Sinyaller: Trend devamı Dönüş uyarısı Kırılma
FREE
Monitor your order
Eslam Mohamed Hassanein Hassan Aly
Advanced Lot & Profit Monitor PRO is a powerful MT5 indicator that provides real-time monitoring of your trading positions directly on the chart. It displays the number of orders, total lot sizes, and profit (including swap) for Buy and Sell positions separately, as well as the overall account performance. Designed with a clean and customizable interface, this tool helps traders stay in control of their exposure and risk at all times. Key Features: Real-time monitoring of open positions Sepa
A huge number of traders use the VolumeProfile/MarketProfile analysis method. And I think there is no need to explain such concepts as POC and VAH/VAL. However, the standard VolumeProfile representation has a drawback - we only see the current picture of the market. We see the "convexity" of the volume distribution within the period. But we don't see the main thing - the "migration" of the POC level during the price movement. Our indicator is unique. It is dynamic. The first feature is that the
Wolfe Wave Scanner MT5
Reza Aghajanpour
5 (7)
**  All Symbols  x  All Timeframes  scan just by pressing scanner button ** *** Contact me  to send you instruction and add you in "Wolfe Wave Scanner group" for sharing or seeing experiences with other users. Introduction: A Wolfe Wave is created with five-wave patterns in price. It shows supply and demand and a fight towards a balance price. T hese waves of price actions can help traders identify the boundaries of   the trend . Also  It helps forecast how the price will move in the near futur
HiperCube VIX
Adrian Lara Carrasco
HiperCube VIX'e hoş geldiniz Darwinex Zero'da %25 indirim kodu: DWZ2328770MGM Bu gösterge size sp500 / us500 hacimli piyasa hakkında gerçek bilgi sağlar Tanım HiperCube VIX, CBOE Volatilite Endeksi olarak bilinir ve piyasa korkusu veya stresinin yaygın olarak bilinen bir ölçüsüdür. Geniş piyasa için bir vekil olarak S&P 500 endeksini kullanarak hisse senedi piyasasındaki belirsizlik ve volatilite seviyesini işaret eder. VIX Endeksi, S&P 500 endeksindeki opsiyon sözleşmelerinin fiyatlarına göre
FREE
Ichimoku Kinko Hyo is a purpose-built trend trading charting system that has been successfully used in nearly every tradable market. It is unique in many ways, but its primary strength is its use of multiple data points to give the trader a deeper, more comprehensive view into price action. This deeper view, and the fact that Ichimoku is a very visual system, enables the trader to quickly discern and filter "at a glance" the low-probability trading setups from those of higher probability. This i
THE DAILY DECIDER BUYSELL PRO INDICATOR OVERVIEW Unlock the Market's Daily Secret: The Daily Decider BuySell Indicator is Here! Tired of analysis paralysis? Struggling with false signals and noisy markets? What if you could know the market's primary intention within the first few hours of the day and trade with unwavering confidence? Introducing the Daily Decider BuySell Indicator for MetaTrader 5. Pro Tip: Never Miss the first signal of the day This isn't just another indicator cluttering yo
Trades History Visualizer is a MetaTrader 5 indicator that displays your trading history directly on the chart, providing a clear visual representation of past trades with additional information. Key Features: Visual trade history display with entry arrows Entry, Stop Loss, and Take Profit horizontal lines Color-coded connector lines between entry and exit points (green for profit, red for loss) Risk-Reward ratio display for each closed trade Profit/Loss amount display option Pip display option
Devrim niteliğindeki MT5 göstergesi ile tanışın, DARWIN Assistant   - başarılı ticaret dünyasına açılan nihai kapınız! Hassasiyet ve uzmanlıkla tasarlanan DARWIN Assistant   , tüm zaman dilimlerinde gelişmiş teknik göstergelerin (RSI, Stokastik, CCI ve Trendler) gücünden yararlanan özel bir strateji üzerinde çalışır. Bu son teknoloji gösterge size giriş için en doğru sinyalleri sunarak, piyasalarda benzersiz bir güvenle gezinmenizi sağladığından, olağanüstü bir ticaret deneyimi için kendinizi d
Order Book, known also as Market Book, market depth, Level 2, - is a dynamically updated table with current volumes of orders to buy and to sell specific financial instument at price levels near Bid and Ask. MetaTrader 5 provides the means for receiving market book from your broker, but in real time only, without access to its history. The indicator OrderBook Cumulative Indicator accumulates market book data online and visualizes them on the chart. In addition, the indicator can show the market
Bu ürünün alıcıları ayrıca şunları da satın alıyor
Divergence Bomber
Ihor Otkydach
4.9 (87)
Bu göstergeyi satın alan herkese aşağıdaki ekstra içerikler ücretsiz olarak sunulmaktadır: Her işlemi otomatik olarak yöneten, Stop Loss ve Take Profit seviyelerini ayarlayan ve işlemleri strateji kurallarına göre kapatan özel yardımcı araç: "Bomber Utility" Göstergenin farklı varlıklar üzerinde kullanılmasına yönelik ayar dosyaları (set dosyaları) Bomber Utility için 3 farklı modda kullanım sunan ayar dosyaları: "Minimum Risk", "Dengeli Risk" ve "Bekle-Gör Stratejisi" Bu ticaret stratejisini hı
Grabber System MT5
Ihor Otkydach
4.83 (23)
Size mükemmel bir teknik gösterge olan Grabber’ı tanıtıyorum. Bu araç, kullanıma hazır bir “her şey dahil” işlem stratejisi olarak çalışır. Tek bir yazılım kodu içinde güçlü piyasa teknik analiz araçları, işlem sinyalleri (oklar), uyarı işlevleri ve push bildirimleri entegre edilmiştir. Bu göstergeyi satın alan herkes aşağıdaki hediyeleri ücretsiz olarak alır: Açık emirleri otomatik yönetmek için Grabber Yardımcı Aracı Kurulum, yapılandırma ve nasıl işlem yapılacağını adım adım anlatan video kıl
SignalTech MT5 is a trading system for EURUSD, USDCHF, USDJPY, AUDUSD, NZDUSD, EURJPY, AUDJPY, NZDJPY, CADJPY H2 and H3 Timeframe.  It can generate signals with Buy/Sell Arrows and Pop-Up/Sound Alerts. Each signal has clear Entry and Stop Loss levels, which should be automatically flagged on the chart, as well as potential Targets 1, 2, and 3. The Entry and TP levels are fixed after the trade is taken. The exit level is dynamic. If there are signs of a potential short-term trend reversal, the
Btmm state engine pro
Garry James Goodchild
5 (4)
BTMM State Engine Pro is a MetaTrader 5 indicator for traders who use the Beat The Market Maker approach: Asian session context, kill zone timing, level progression, peak formation detection, and a multi-pair scanner from a single chart. It combines cycle state logic with a built-in scanner dashboard so you do not need the same tool on many charts at once. What it does Draws the Asian session range; session times can follow broker server offset or be set in inputs. Tracks level progression (L
Tanıtım       Quantum Breakout PRO   , Breakout Bölgeleri ile ticaret yapma şeklinizi değiştiren çığır açan MQL5 Göstergesi! 13 yılı aşkın ticaret tecrübesine sahip deneyimli tüccarlardan oluşan bir ekip tarafından geliştirilmiştir.       Kuantum Breakout PRO       yenilikçi ve dinamik koparma bölgesi stratejisiyle ticaret yolculuğunuzu yeni zirvelere taşımak için tasarlanmıştır. Kuantum Breakout Göstergesi, size 5 kar hedefi bölgesi ile kırılma bölgelerinde sinyal okları ve kırılma kutusuna da
Quantum TrendPulse
Bogdan Ion Puscasu
5 (23)
SuperTrend   ,   RSI   ve   Stochastic'in   gücünü tek bir kapsamlı göstergede birleştirerek işlem potansiyelinizi en üst düzeye çıkaran nihai işlem aracı olan   Quantum TrendPulse'u   tanıtıyoruz. Hassasiyet ve verimlilik arayan yatırımcılar için tasarlanan bu gösterge, piyasa trendlerini, momentum değişimlerini ve en uygun giriş ve çıkış noktalarını güvenle belirlemenize yardımcı olur. Temel Özellikler: SuperTrend Entegrasyonu:   Güncel piyasa trendlerini kolayca takip edin ve karlılık dalgası
Top indicator for MT5   providing accurate signals to enter a trade without repainting! It can be applied to any financial assets:   forex, cryptocurrencies, metals, stocks, indices .  Watch  the video  (6:22) with an example of processing only one signal that paid off the indicator! MT4 version is here It will provide pretty accurate trading signals and tell you when it's best to open a trade and close it. Most traders improve their trading results during the first trading week with the help of
OmniSync Projection
Antonio-alin Teculescu
5 (1)
Chronos Fractal Engine is an innovative price projection indicator for MetaTrader 5, designed to transform your technical analysis by intelligently identifying and projecting historical price patterns. Built upon an advanced correlation algorithm and the fractal principles of the market, this powerful tool visualizes potential future price movements, giving you a unique edge in your trading decisions. What is Chronos Fractal Engine? At its core, the Chronos Fractal Engine employs a sophisticat
Azimuth Pro
Ottaviano De Cicco
5 (7)
Azimuth Pro V2: Synthetic Fractal Structure and Confirmed Entries for MT5 Overview Azimuth Pro is a multi-level swing structure indicator by Merkava Labs . Four nested swing layers, swing-anchored VWAP, ABC pattern detection, three-timeframe structural filtering, and closed-bar confirmed entries — one chart, one workflow from micro-swings to macro-cycles. This is not a blind signal product. It is a structure-first workflow for traders who care about location, context, and timing. V2 Launch Offe
Öncelikle, bu Ticaret Aracının Non-Repainting, Non-Redrawing ve Non-Lagging Gösterge olduğunu vurgulamakta fayda var, bu da onu profesyonel ticaret için ideal hale getiriyor. Çevrimiçi kurs, kullanıcı kılavuzu ve demo. Akıllı Fiyat Hareketi Kavramları Göstergesi, hem yeni hem de deneyimli tüccarlar için çok güçlü bir araçtır. İleri ticaret fikirlerini, Inner Circle Trader Analizi ve Smart Money Concepts Ticaret Stratejileri gibi 20'den fazla kullanışlı göstergeyi bir araya getirerek bir araya
RelicusRoad Pro: Kantitatif Piyasa İşletim Sistemi ÖMÜR BOYU ERİŞİMDE %70 İNDİRİM (SINIRLI SÜRE) - 2.000+ TRADER'A KATILIN Neden çoğu trader "mükemmel" indikatörlere rağmen başarısız olur? Çünkü tekil kavramları boşlukta trade ederler. Bağlamı olmayan bir sinyal kumardır. Sürekli kazanmak için KONFLÜANS (UYUM) gerekir. RelicusRoad Pro basit bir ok indikatörü değildir. Tam bir Kantitatif Piyasa Ekosistemi dir. Tescilli volatilite modellemesini kullanarak fiyatın ilerlediği "Adil Değer Yolu"nu har
ARICoins
Temirlan Kdyrkhan
ARICoin is a powerful trading companion designed to generate high-probability entry signals with dynamic TP/SL/DP levels based on volatility. Built-in performance tracking shows win/loss stats, PP1/PP2 hits, and success rates all updated live. Key Features: Buy/Sell signals with adaptive volatility bands Real-time TP/SL/DP levels based on ATR Built-in MA Filter with optional ATR/StdDev volatility Performance stats panel (Success, Profit/Loss, PP1/PP2) Alerts via popup, sound, push, or email Cust
Bill Williams Advanced
Siarhei Vashchylka
5 (11)
Bill Williams Advanced is designed for automatic chart analysis using Bill Williams' "Profitunity" system. The indicator analyzes four timeframes at once. Manual (Be sure to read before purchasing) Advantages 1. Analyzes the chart using Bill Williams' "Profitunity" system. Signals are displayed in a table in the corner of the screen and on the price chart. 2. Finds all known AO and AC signals, as well as zone signals. Equipped with a trend filter based on the Alligator. 3. Finds "Divergence Bar
Advanced Supply Demand MT5
Bernhard Schweigert
4.53 (15)
Herhangi bir Acemi veya Uzman Tüccar için En İyi Çözüm! Bu gösterge benzersiz, yüksek kaliteli ve uygun fiyatlı bir ticaret aracıdır çünkü bir dizi tescilli özelliği ve yeni bir formülü bir araya getirdik. Bu güncelleme ile çift zaman dilimi dilimlerini gösterebileceksiniz. Yalnızca daha yüksek bir TF gösteremeyeceksiniz, aynı zamanda TF grafiğini ve ARTIK daha yüksek TF'yi de gösterebileceksiniz: YUVARLAK BÖLGELERİ GÖSTERMEK. Tüm Arz Talebi tüccarları buna bayılacak. :) Önemli Bilgiler Açıkland
Gartley Hunter Multi
Siarhei Vashchylka
5 (11)
Gartley Hunter Multi - An indicator for searching for harmonic patterns simultaneously on dozens of trading instruments and on all possible timeframes. Manual (Be sure to read before purchasing) | Version for MT4 Advantages 1. Patterns: Gartley, Butterfly, Shark, Crab. Bat, Alternate Bat, Deep Crab, Cypher 2. Simultaneous search for patterns on dozens of trading instruments and on all possible timeframes 3. Search for patterns of all possible sizes. From the smallest to the largest 4. All fou
META Points PRO MT5
Polina Balahura
5 (1)
META Puanları PRO   — Piyasa hareketlerini takip eden ve alım satım işlemlerinde tahmini ortadan kaldıran, piyasanın kararını çoktan vermiş olduğu noktaları gösteren bir araçtır. Bu gösterge, trendlerin, eğilimlerin ve yapıların değiştiği kilit noktaları belirler ve fiyatın büyük oyuncuların pozisyon alması için geri döndüğü alanları vurgular. Sadece hareketi görmüyorsunuz, arkasındaki mantığı da anlıyorsunuz. Tüm sinyaller mum çubuğu kapandıktan sonra kaydedilir, yeniden çizilmez ve grafiğe kay
" Dynamic Scalper System MT5 " göstergesi, trend dalgaları içinde işlem yapmak için scalping yöntemi için tasarlanmıştır. Başlıca döviz çiftleri ve altın üzerinde test edilmiştir, diğer işlem araçlarıyla uyumluluğu mümkündür. Ek fiyat hareketi desteğiyle trend boyunca pozisyonların kısa vadeli açılması için sinyaller sağlar. Göstergenin prensibi. Büyük oklar trend yönünü belirler. Küçük oklar şeklinde scalping için sinyaller üreten bir algoritma trend dalgaları içinde çalışır. Kırmızı oklar yü
KT Alpha Hunter Arrows MT5
KEENBASE SOFTWARE SOLUTIONS
Çoğu ok göstergesi size yalnızca bir sinyal verir ve geri kalan her şeyi sizin çözmenizi bekler. KT Alpha Hunter Arrows ise size tam bir işlem planı sunar. Her sinyal oku, hazır çizilmiş tam bir planla birlikte görünür: giriş çizgisi, stop loss, dört take profit seviyesi ve bu sembol ile zaman diliminin o anda işlem yapmaya değer olup olmadığını gösteren canlı edge değerlendirmesi. Dahil edilen Trade Manager EA, siz işleme girdikten sonra yönetimi üstlenir. Böylece piyasa gürültülü ve stresli ha
Meravith MT5
Ivan Stefanov
5 (1)
Göstergе, herhangi bir noktadan hacmi analiz eder ve bu hacim için piyasanın tükeniş seviyelerini hesaplar. Meravith’in ana çizgileri: Boğa hacim tükeniş çizgisi – hedef olarak kullanılır. Ayı hacim tükeniş çizgisi – hedef olarak kullanılır. Trend çizgisi – piyasa trendini gösterir. Piyasanın boğa mı ayı mı olduğuna bağlı olarak rengi değişir ve trend desteği görevi görür. Nasıl kullanılır: Mor dikey çizgiye çift tıklayın ve istediğiniz konuma taşıyın. Her şeyi analiz edebilirsiniz – trendleri v
Berma Bands
Muhammad Elbermawi
5 (8)
Berma Bantları (BB'ler) göstergesi, piyasa trendlerini belirlemeyi ve bunlardan yararlanmayı amaçlayan yatırımcılar için değerli bir araçtır. Fiyat ile BB'ler arasındaki ilişkiyi analiz ederek, yatırımcılar bir piyasanın trend veya aralıklı fazda olup olmadığını ayırt edebilir. Daha fazla bilgi edinmek için [ Berma Home Blog ] adresini ziyaret edin. Berma Bantları üç belirgin çizgiden oluşur: Üst Berma Bandı, Orta Berma Bandı ve Alt Berma Bandı. Bu çizgiler fiyatın etrafına çizilir ve genel tren
RFI levels PRO MT5
Roman Podpora
3.67 (3)
Bu gösterge, fiyat dönüş noktalarını ve fiyat geri dönüş bölgelerini doğru bir şekilde gösterir.       Başlıca oyuncular   . Yeni trendlerin nerede oluştuğunu görüyorsunuz ve her işlem üzerinde kontrolü elinizde tutarak, azami hassasiyetle kararlar alıyorsunuz. TREND LINES PRO   göstergesiyle birlikte kullanıldığında maksimum potansiyelini ortaya koyar.  VERSION MT4 Göstergenin gösterdiği şey: Yeni bir trendin başlangıcında aktivasyonla birlikte tersine dönüş yapıları ve tersine dönüş seviyeler
CGE Trading Suite
Carl Gustav Johan Ekstrom
5 (2)
Institutional-Grade Analytics for MT5 C GE Trading Suite delivers the analytical edge typically reserved for professional trading desks. The platform integrates a full suite of analytical tools into one seamless workflow: dynamic grid mapping, liquidity behavior analysis, ECM, trend lines, MIDAS, trade cycles, and directional channel projections. Together, these provide a unified view of market structure and momentum. Directional clarity is further enhanced by the capital flow index, which meas
Route Lines Prices MT5 , potansiyel işlem sinyallerini bulmak için tasarlanmış bir göstergedir. Basit arayüzü, birden fazla fiyat davranışı algoritmasının yanı sıra sinyal uç noktası tespiti ve tamamlanmış yörüngelerin hesaplamalarını içerir. Algoritmalar, kullanılan zaman dilimlerine bağlı olarak volatilite ve fiyat düzeltme hesaplamalarını içerir. Göstergenin değerlerini değiştirmek için birincil bir parametresi vardır: " Calculating price values ." Varsayılan 1 değeri, dengeli bir otomatik h
AriX
Temirlan Kdyrkhan
1 (4)
AriX Indicator for MT5 A powerful trend-following and signal-evaluation tool AriX is a custom MT5 indicator that combines Moving Averages and ATR-based risk/reward logic to generate clear buy/sell signals. It visualizes dynamic SL/TP levels, evaluates past trade outcomes, and displays win/loss statistics in a clean on-chart panel. Key features include: Buy/Sell signals based on MA crossovers ATR-based SL/TP1/TP2/TP3 levels with visual lines and labels Signal outcome tracking with real-time stat
Weltrade Spike Sentinel
Batsirayi L Marango
5 (1)
Introducing Indicator for PainX and GainX Indices Traders on Weltrade Get ready to experience the power of trading with our indicator, specifically designed for Weltrade   broker's PainX and GainX Indices.  Advanced Strategies for Unbeatable Insights Our indicator employs sophisticated strategies to analyze market trends, pinpointing optimal entry and exit points.  Optimized for Maximum Performance To ensure optimal results, our indicator is carefully calibrated for 5-minute timeframe charts on
PZ Day Trading MT5
PZ TRADING SLU
2.83 (6)
Effortless trading: non-repainting indicator for accurate price reversals This indicator detects price reversals in a zig-zag fashion, using only price action analysis and a donchian channel. It has been specifically designed for short-term trading, without repainting or backpainting at all. It is a fantastic tool for shrewd traders aiming to increase the timing of their operations. [ Installation Guide | Update Guide | Troubleshooting | FAQ | All Products   |  Get Help ] Amazingly easy to tr
Ziva LSE System
Hassan Abdullah Hassan Al Balushi
ZIVA LSE System A Professional Liquidity & Structure Execution Framework Executive Overview ZIVA LSE System is a professionally engineered analytical framework designed to interpret market behavior through structural logic and liquidity dynamics. It is not positioned as a conventional indicator. Rather, it functions as a structured execution environment that organizes price action into a clear, disciplined decision-making model. The system is built to deliver consistency, clarity, and controlled
ICT PO3 (Power of 3) AMD Protocol Framework Indicator True Time & Structure Integration   |  Non-Repainting | Real-Time  | Multi-Asset  | MT4 Version Available Full Setup Guide & Strategy Playbook: https://www.mql5.com/en/blogs/post/768683 MT4 Version: https://www.mql5.com/en/market/product/171742 Indicator Overview The ICT PO3 AMD Protocol Framework is a complete structural overlay for MetaTrader 5 that maps the True Daily Cycle directly onto your lower-timeframe execution chart. It projects
CRT Multi-Timeframe Market Structure & Liquidity Sweep Indicator Non-Repainting | Multi-Asset | MT4 Version Available MT4 Version: https://www.mql5.com/en/market/product/162556 Full Setup Guide: https://www.mql5.com/en/blogs/post/767525 Indicator Overview CRT Ghost Candle HTF Fractal is a complete institutional-grade market structure toolkit for MetaTrader 5. It projects higher-timeframe candle structure, CRT trap levels, session levels, previous period highs and lows, pivot points, and a real
Gann Kare Göstergesi, W.D. Gann tarafından yazılan "Piyasa Tahminleri için Matematiksel Formül" makalesine dayalı güçlü bir piyasa analizi aracıdır. Bu araç, piyasa analizi için matematiksel ve Gann teorilerini kullanarak hassas analizler gerçekleştirir. 144, 90, 52 karelerini ve ayrıca 9 karesini kullanır. Ayrıca, ın 9 karesi ve bu kareyle ilişkili kanallar ve yıldız modelleri için yöntemini içerir. Kullanıcı Kılavuzu ve Uygulama: Bu göstergeleri kullanmadan önce, kullanıcı kılavuzunu okumanız
Yazarın diğer ürünleri
HA Heikin Ashi
Giuseppe Papa
5 (1)
L'indicatore "Heikin Ashi" è stato progettato per migliorare l'analisi dei grafici finanziari con un sistema di candele Heikin Ashi. Le candele Heikin Ashi sono un metodo avanzato per visualizzare il prezzo, che aiuta a filtrare il rumore del mercato, rendendo più chiara l'interpretazione dei trend e migliorando la qualità delle decisioni di trading. Questo indicatore consente di visualizzare le candele Heikin Ashi al posto delle candele giapponesi tradizionali, rendendo l'analisi grafica più pu
FREE
Pivot Points Classic – L’indicatore essenziale per ogni trader tecnico Questo indicatore disegna automaticamente i livelli di Pivot Point più utilizzati dai trader professionisti, con supporto completo a 4 metodi di calcolo:   Metodi supportati : • Traditional • Fibonacci • Woodie • Camarilla   Caratteristiche principali :  Calcolo su timeframe superiore (multi-timeframe)  Visualizzazione chiara dei livelli P, R1, R2, R3, S1, S2, S3   Etichette dinamiche con nome e valore del livello  Colori per
FREE
Il WaveForce Indicatorsu un sistema di doppia envelope esponenziale e smussamento dinamico, WaveForce separa matematicamente l'energia rialzista e ribassista, tracciando due curve (Bull e Bear) e una linea di segnale centrale. Questo consente al trader di percepire con chiarezza quale delle due forze stia guidando il mercato.  Caratteristiche principali: Calcola la pressione rialzista e ribassista separatamente Include una linea di segnale EMA adattiva per confermare inversioni Oscillatore fluid
FREE
Market Intelligence Hub  contattatemi per ricevere template da usare conAI Descrizione generale Market Intelligence Hub è un indicatore professionale di analisi multi-asset progettato per MetaTrader 5. Trasforma la complessità dei mercati globali in una visione operativa chiara e sintetica, utile sia per trader discrezionali che per analisti quantitativi. Monitora oltre 25 strumenti suddivisi in cinque categorie chiave (USD, EUR, Risk Assets, Safe Haven, Volatility) e fornisce un quadro complet
RealTrend
Giuseppe Papa
To get started, subscribe to the RealTrend Telegram channel. t.me/RealTrendFree RealTrend is an EA that facilitates trading for expert users. The user's aim is to identify the right business trend and let RealTrend suggest the placement of pending orders in strategic points where the price will retrace and then continue its trend. RealTrend is very simple to use and includes a single user-defined stoploss input and an intuitive chart panel. The takeprofit is placed directly by the Bot. risk l
FREE
Un potente indicatore multifunzione progettato per offrire una visione chiara e strutturata della forza del mercato, integrando tre strumenti tecnici in un'unica interfaccia intuitiva:   Caratteristiche principali:   Heikin Ashi RSI Normalizzato Calcolato sul RSI di medie Heikin Ashi, centrato su una scala da -50 a +50 Visualizzazione con candele colorate (blu/rosso) per una lettura chiara della direzione e del momentum   Stocastico Modificato %K e %D convertiti sulla stessa scala -50/+50 Opzion
Questo indicatore avanzato disegna automaticamente pivot High/Low e trendline su un timeframe selezionato (es. H4, D1, ecc.) e li rende visibili su tutti i timeframe inferiori. L'obiettivo principale è fornire un contesto strutturale multi-timeframe unito a segnali di tocco sulle trendline.  Caratteristiche principali:   Trendline Automatiche : Disegnate tra i pivot High e Low rilevati sul timeframe selezionato. Classificate in trendline rialziste (UpTrend), ribassiste (DownTrend) e rotte (Brok
Un indicatore avanzato che identifica in automatico le zone chiave di supporto e resistenza su tre timeframe diversi , mostrandole con rettangoli colorati direttamente sul grafico. Ogni zona viene estesa in avanti, etichettata e aggiornata dinamicamente con il movimento del prezzo.   Caratteristiche principali   3 Timeframe configurabili (es. M15, H1, H4)   Zone di resistenza e supporto calcolate automaticamente   Colori personalizzabili per ciascun timeframe   Etichette automatiche con indicazi
THUNDER WAVE ANALYZER – Professional Multi-Trend Analysis System Il Thunder Wave Analyzer è un indicatore avanzato multi-strumento che combina in un’unica interfaccia la potenza di diversi sistemi di analisi tecnica. Pensato per trader professionisti e scalper, questo tool permette di leggere la forza del trend , rilevare setup ad alta probabilità e individuare con precisione i momenti di pressione del mercato.  Cosa rende unico il Thunder Wave Analyzer?  In un solo indicatore integra più metod
ForceFlow – Momentum & Trend Predictor ForceFlow è un indicatore avanzato che combina la forza del Relative Strength Index (RSI) con un innovativo istogramma dinamico multi-livello , colorato in base alla direzione del trend. I colori si adattano in tempo reale, anticipando la formazione della prossima candela e filtrando i falsi segnali.  Caratteristiche principali: RSI dinamico a colori (blu per fase rialzista, rosso per fase ribassista). Istogramma multilivello  che rappresenta la forza e la
Elite Harmony Signals Pro Panoramica Elite Harmony Signals è un indicatore sofisticato di analisi tecnica che visualizza rettangoli dinamici che forniscono zone di trading chiare e segnali di conferma per decisioni migliorate. Caratteristiche Principali Zone Rettangolo Dinamiche Estensione in Tempo Reale : I rettangoli si estendono automaticamente all'azione corrente del prezzo Chiusura Intelligente : I rettangoli si chiudono solo quando appaiono segnali opposti Conferma Visiva : Zone di trading
Filtrele:
Değerlendirme yok
Değerlendirmeye yanıt