Hit Rate Top Bottom Signal

Hit Rate Top Bottom Signal

Hit Rate Top Bottom Signal

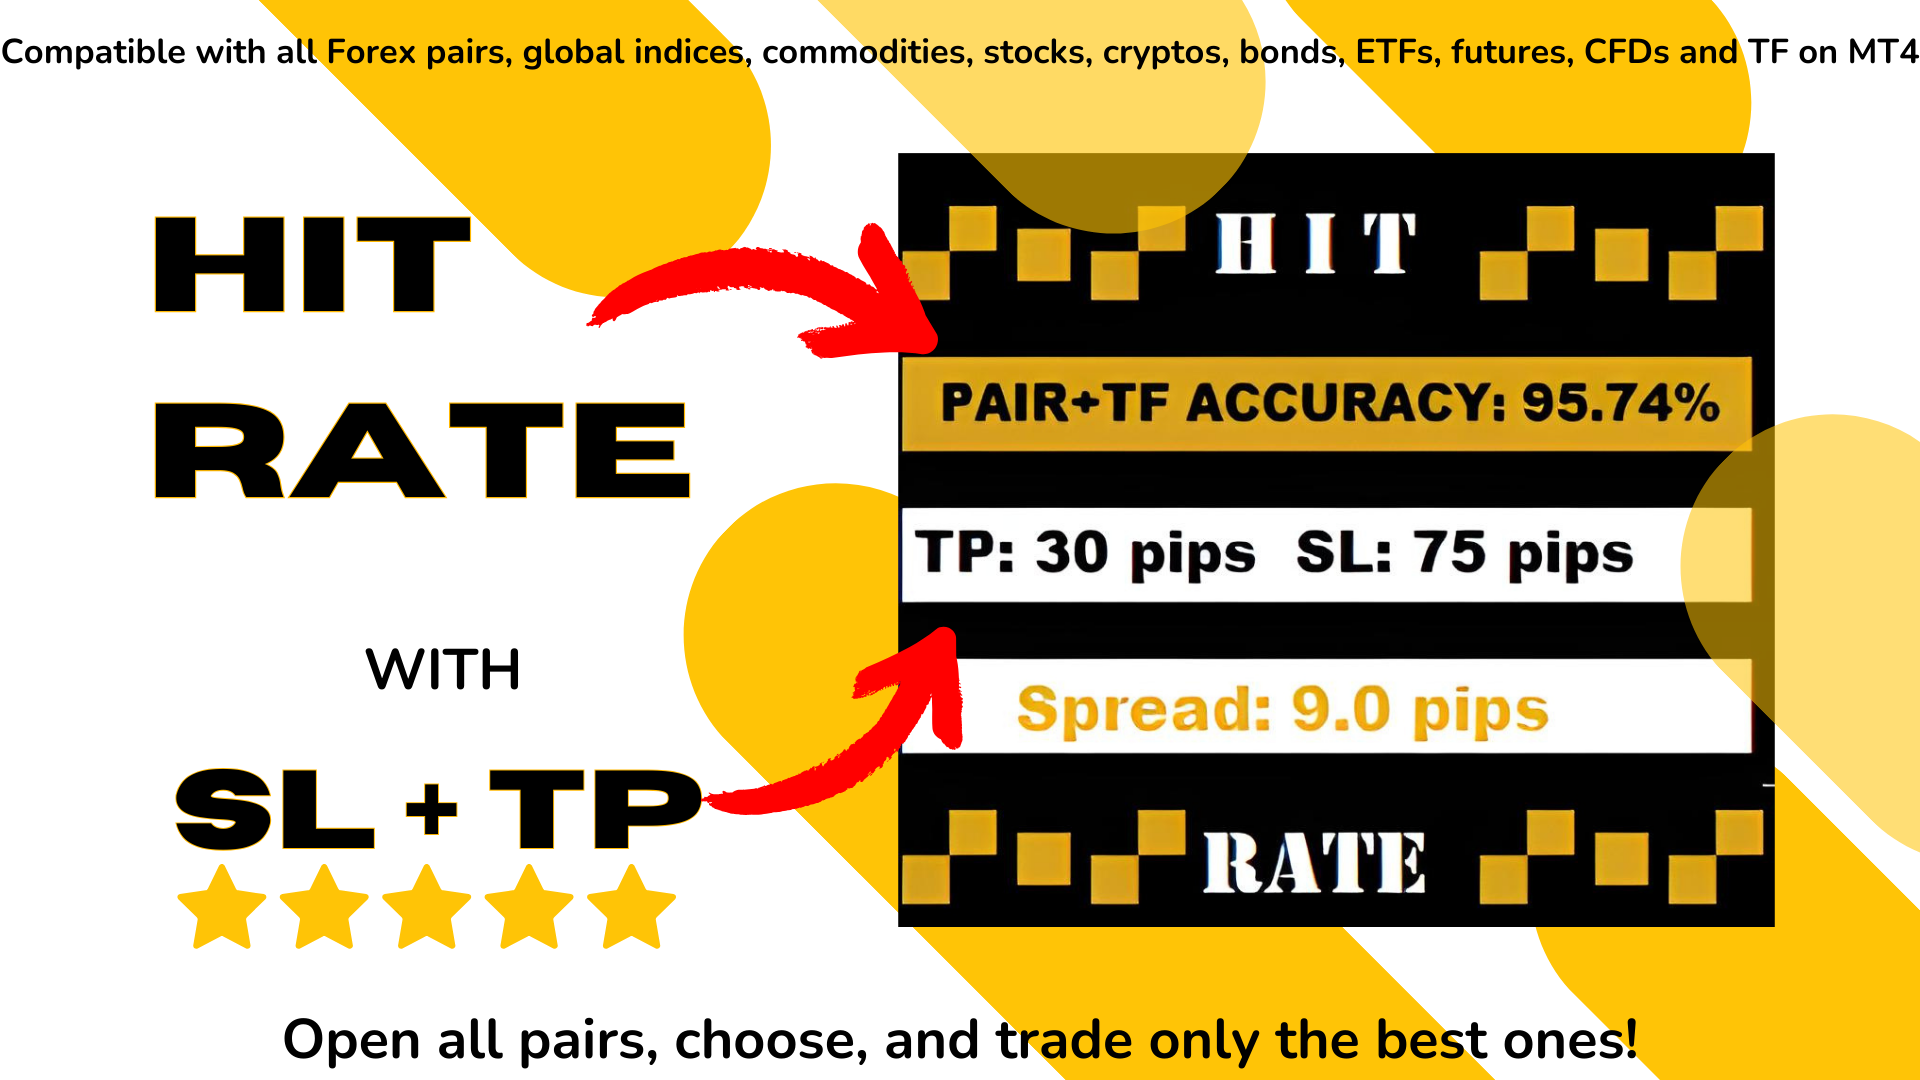
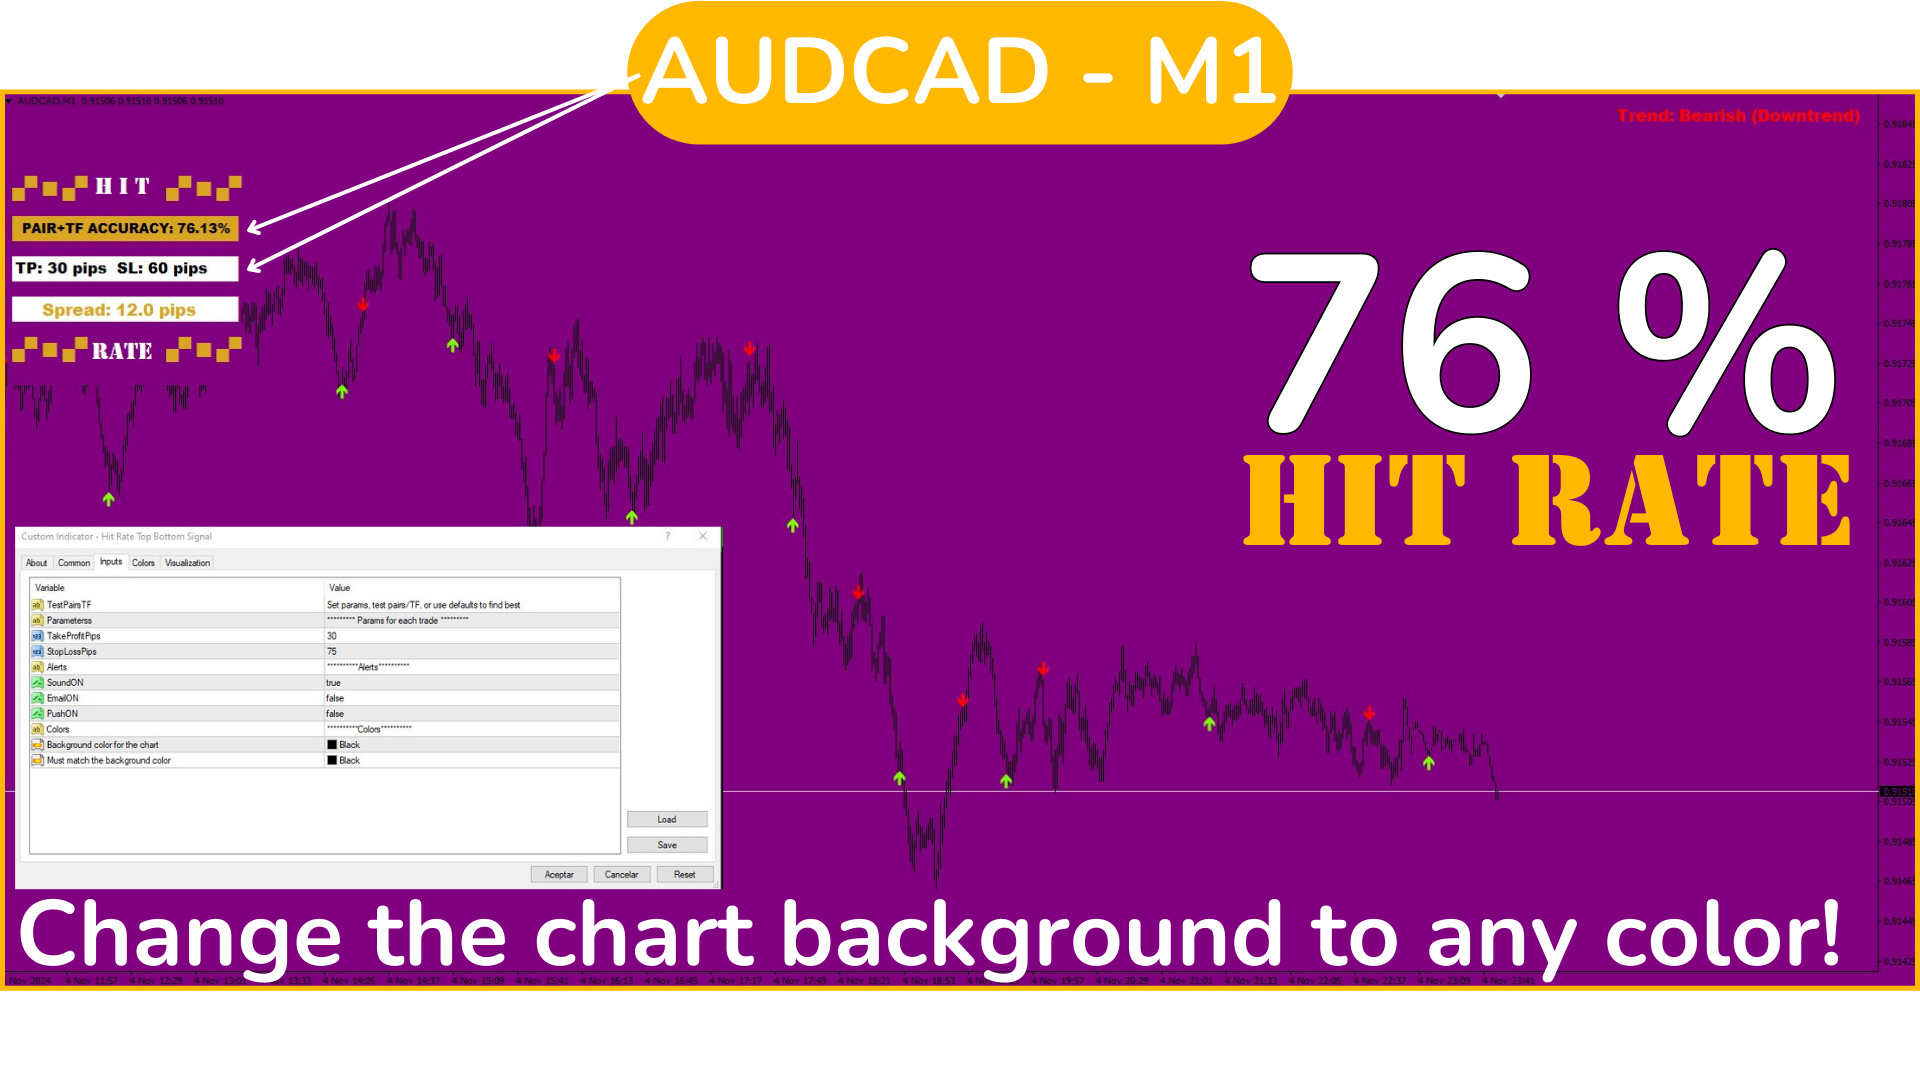
Hit Rate Top Bottom Signal tamamen yenilikçi bir yaklaşım sunar. Belirli bir TP-SL ve hangi ÇİFTLER/TF'lerde en iyi performansı gösterdiğini önceden değerlendirmek isteyenler için idealdir.

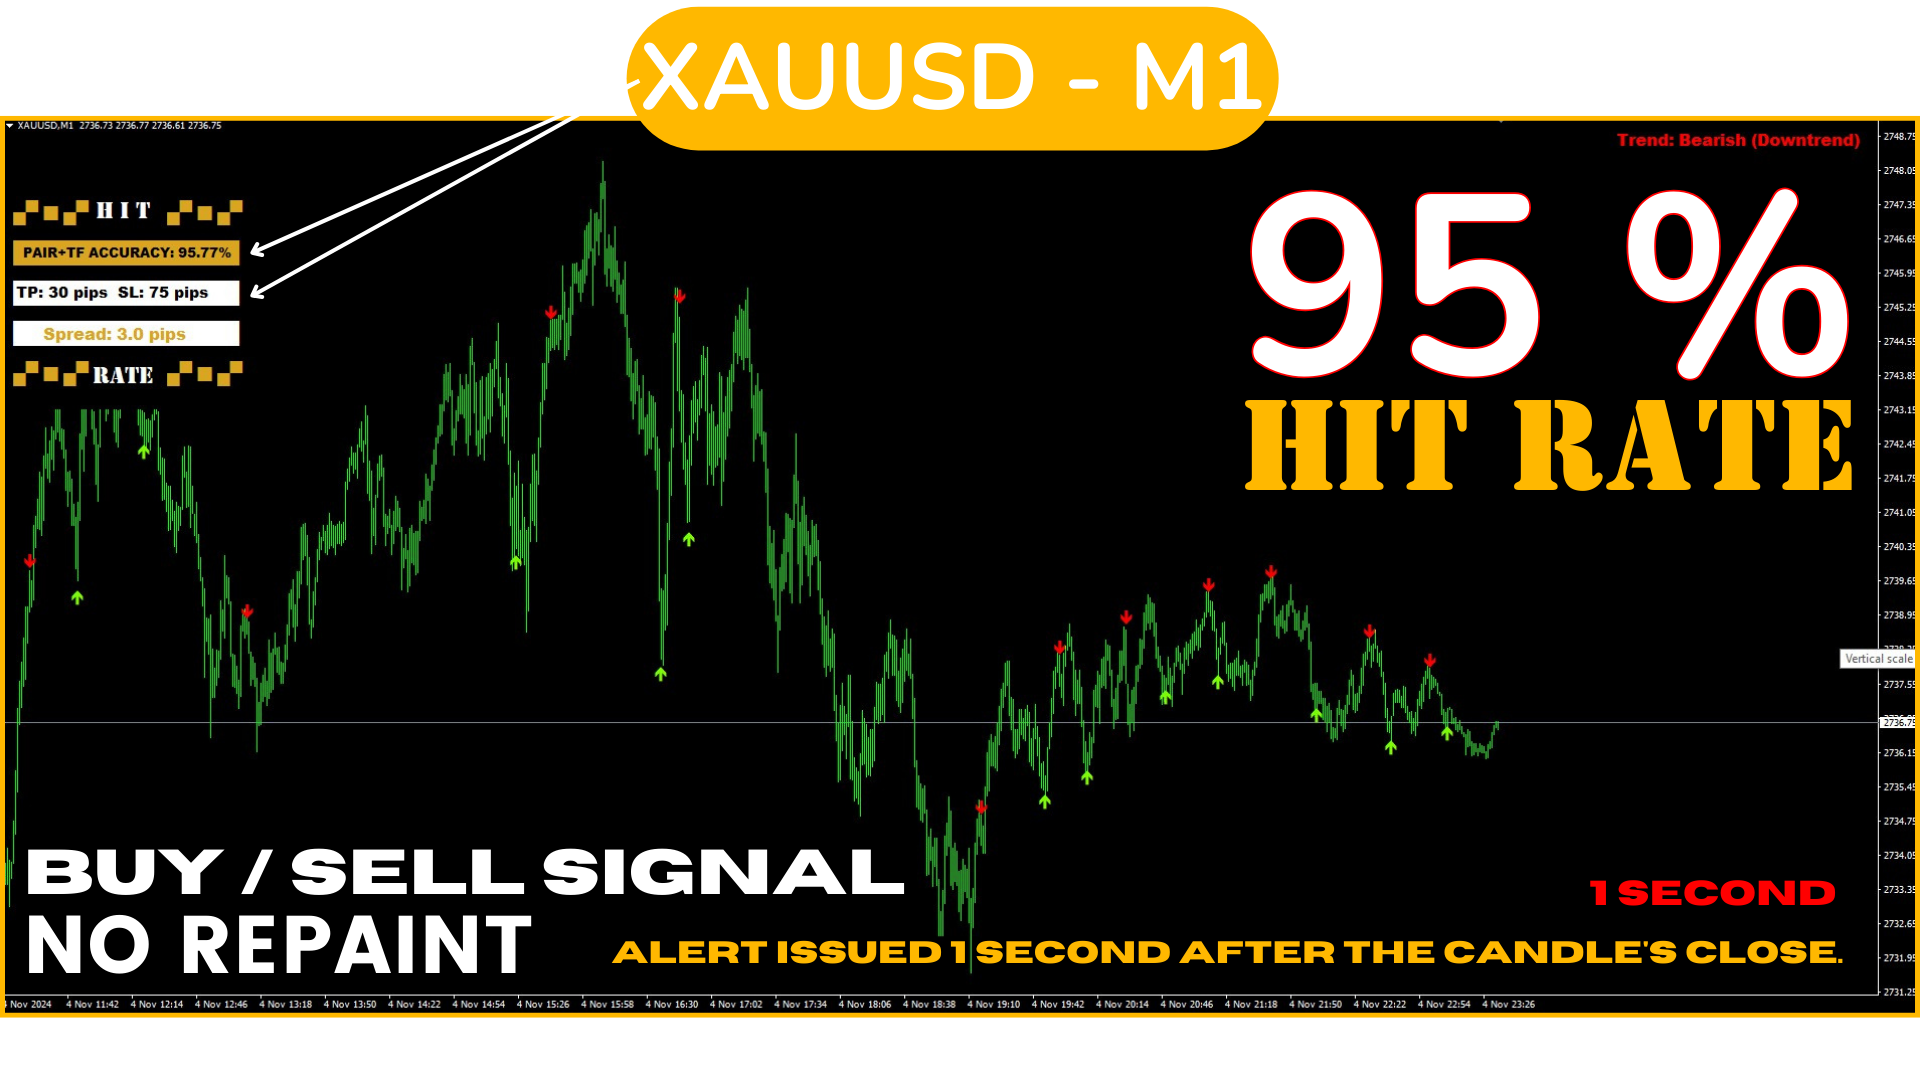
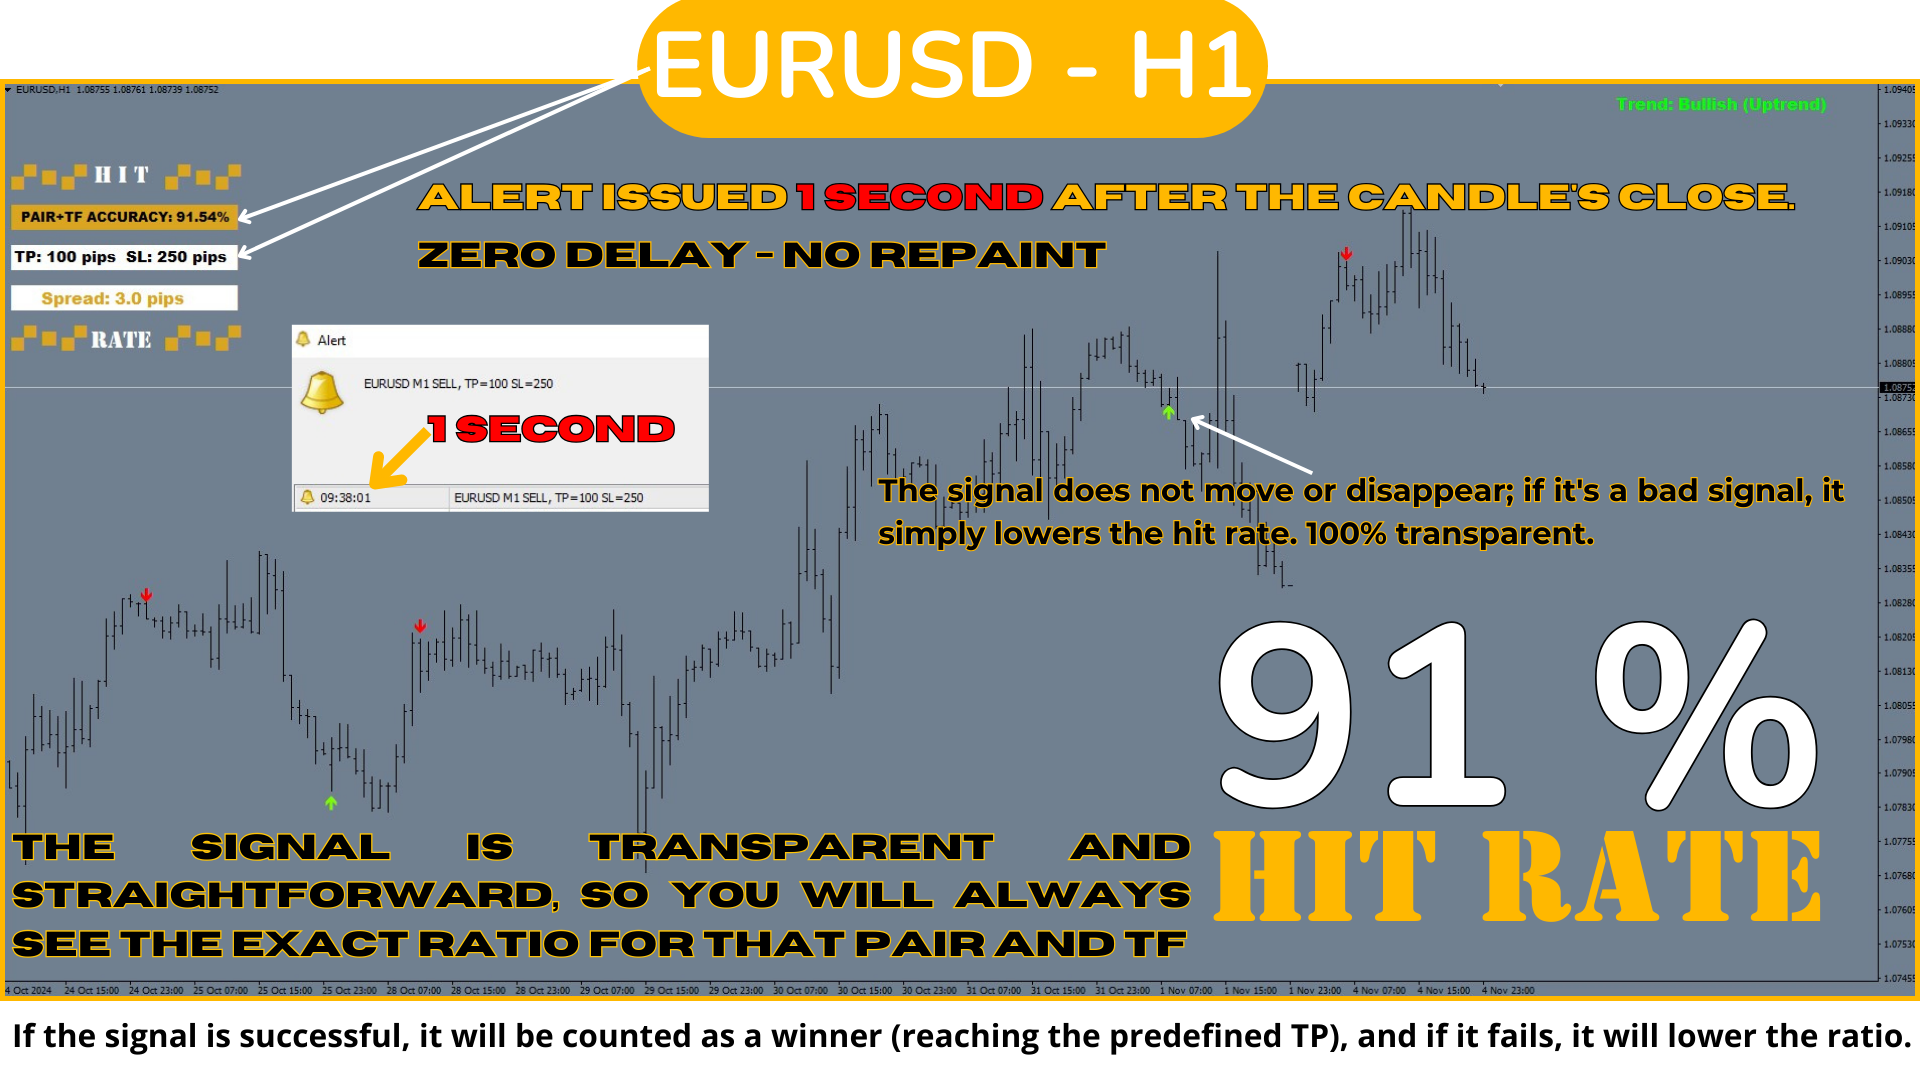
Hit Rate Top Bottom Signal stratejisi, her trader ve her tür ticaret için temel bir araçtır çünkü yalnızca yeniden çizim yapmayan kesin sinyaller sağlamakla kalmaz, aynı zamanda her Parite ve TF için başarı oranının ayrıntılı bir kaydını tutar ve önceden tanımlanmış bir Take Profit (TP) ve Stop Loss (SL) içerir. Bu, sinyalin etkinlik oranını önceden bilmenizi sağlar, bu da iyi bir risk yönetimi ve maksimum hassasiyetle işlem yapma açısından çok önemlidir.

Bu strateji, tam hareketler yerine impuls içindeki dönüş noktalarını algılamaya odaklanması nedeniyle öne çıkar, bu da geleneksel Top-Bottom'a göre daha sık sinyal verir ve
piyasanın her önemli dalgalanmasının içinde ana anlara odaklanır.


Bu sinyalin geçmiş başarısını belirli bir SL/TP oranı ile yüzdelik olarak gösterebilme yeteneği, trader’ın veriye dayalı kararlar almasını sağlayarak bu stratejiyi güvenli bir işlem için en iyi seçenek haline getirir. Yalnızca net ve doğrudan olan bir sinyale güvenmekle kalmaz, aynı zamanda kanıtlanmış bir geçmişe sahip olan bu strateji, mevcut en iyi stratejilerden birini sunar.


Bu sistemle nasıl işlem yapılır?

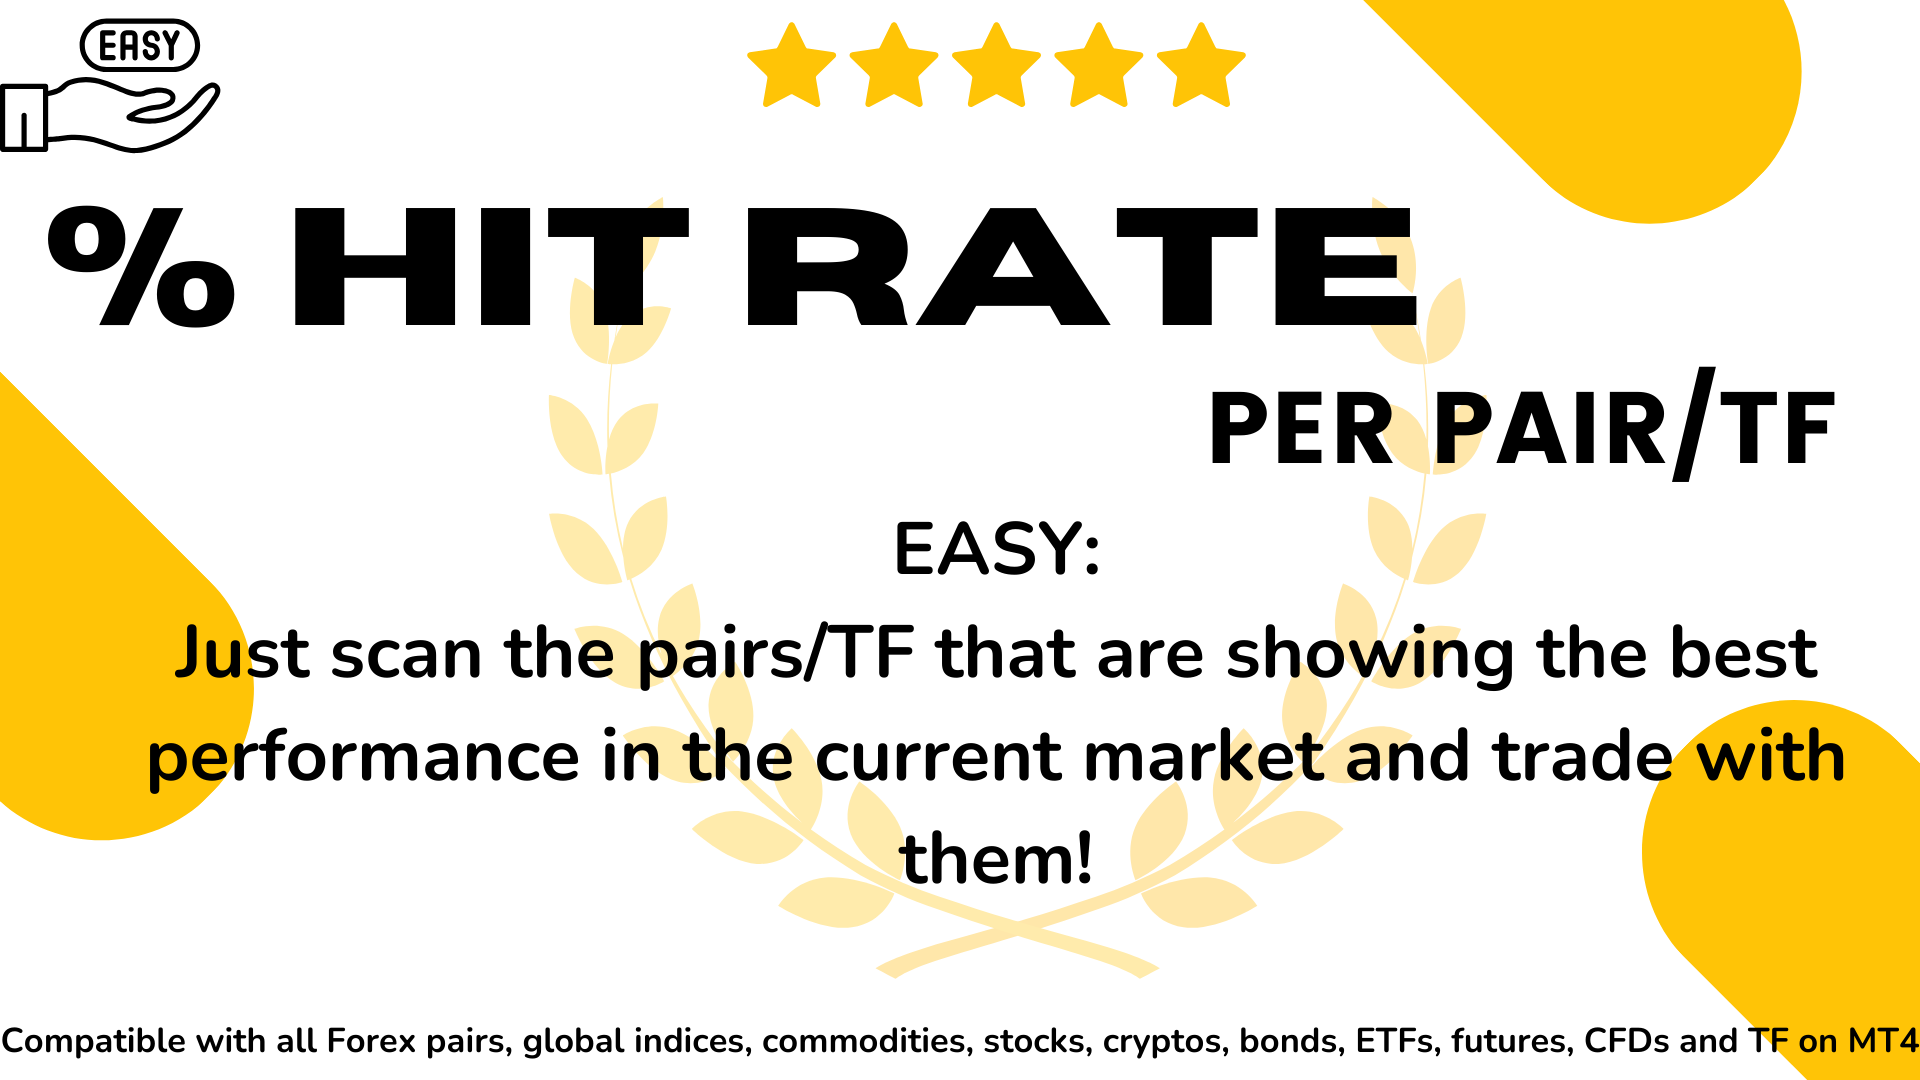
Birden fazla parite açın ve her birine göstergeyi yükleyin. Şimdi, sinyalin en iyi çalıştığı pariteleri ve hangi TF’lerde (zaman dilimi) olduğunu belirlemek için her bir pariteyi analiz edin ve bunlara odaklanın. (RESİMLERE BAKIN)

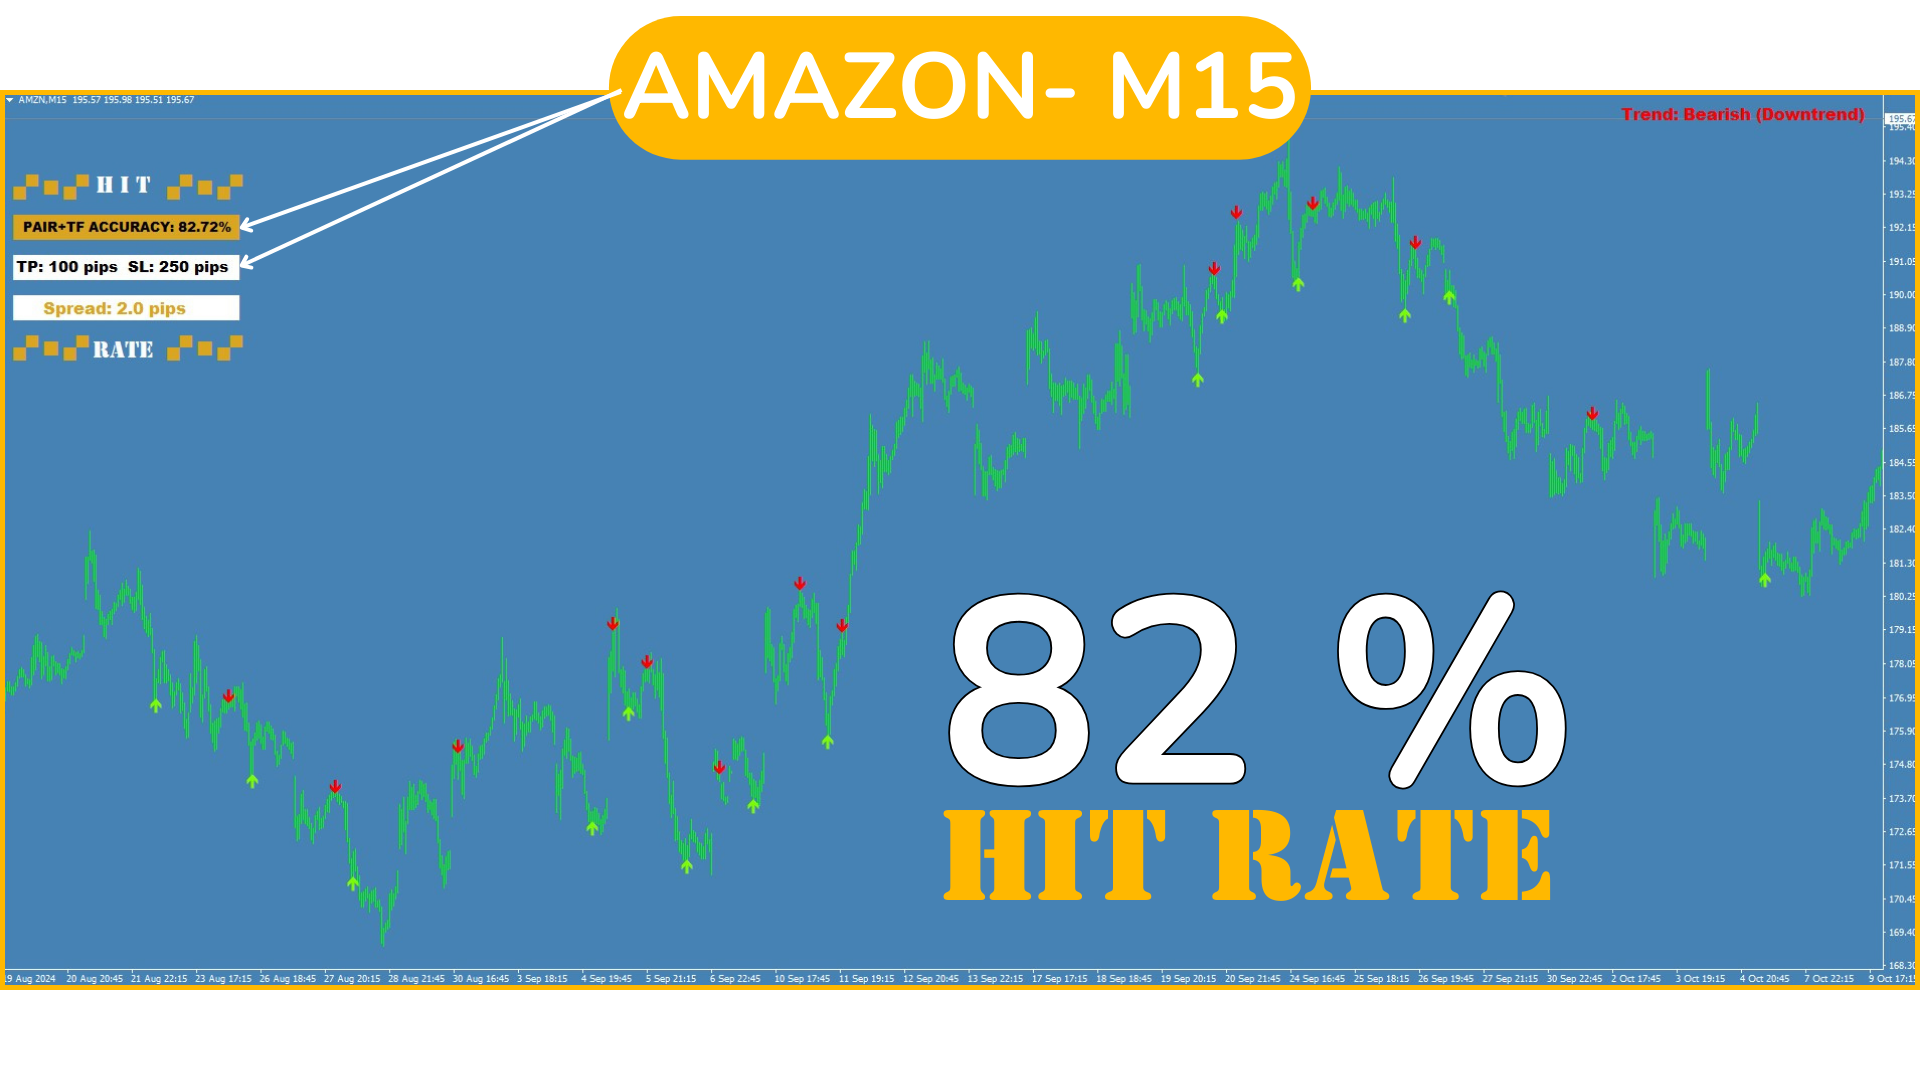
Sinyal, varsayılan olarak 100 pip TP ve 250 pip SL ile gelir, ancak işlem yapmak istediğiniz değerleri belirleyebilir veya varsayılan değerleri bırakabilirsiniz.

H1’de 250 pip SL, M1’de 250 pip SL ile aynı değildir, ancak endişelenmeyin: SL ve TP parametrelerini manuel olarak güncellediğinizde, bu yeni parametreler için sinyalin başarı oranı yeniden hesaplanır ve bu parametrelerle beklenen sonuçları önceden bilmenizi sağlar.

Bu şekilde, her bir paritenin belirli parametrelerini "optimize" ederek bu parite ve TF için stratejiyi uyarlayabilir ve bu bağlamda sinyalin başarı oranını öğrenebilirsiniz. Bu işlemin her gün, işlem yapmaya başlamadan önce gerçekleştirilmesi, mevcut durumda en yüksek etkinlik oranına sahip olan parite/TF’leri belirlemek için önerilir. Varsayılan parametreler, pariteye bağlı olarak M30 veya H1 gibi TF'lerde en iyi şekilde çalışır.

Adım adım:

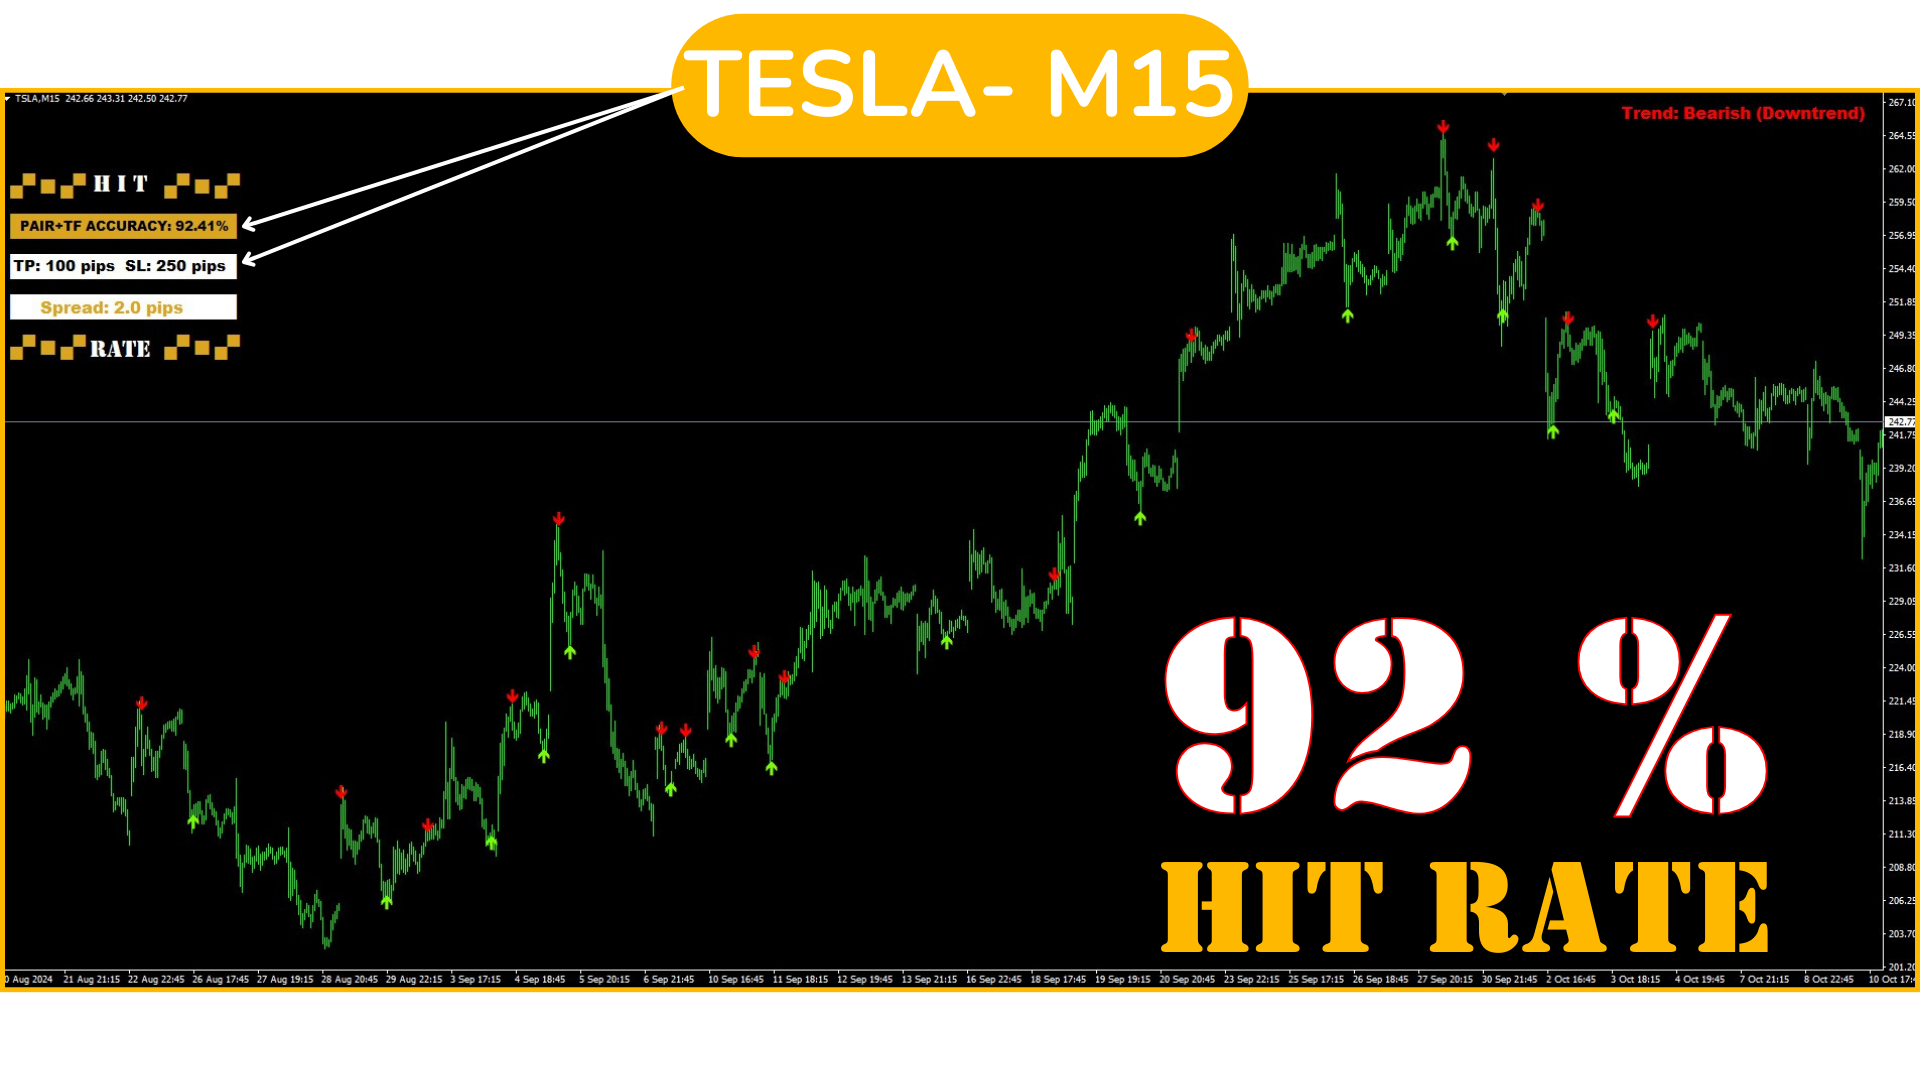
  1. Bir parite seçin ve her TF’yi kontrol edin. Hangi TF'nin en yüksek başarı oranına sahip olduğunu, örneğin %85-90’ın üzerinde olup olmadığını kontrol edin (varsayılan TP ve SL ayarlarını kullanıyorsanız). O TF'yi seçin. Varsayılan TP ve SL'yi kullanmıyorsanız, stratejiniz için en uygun oranın ne olduğunu anlamak için lütfen aşağıdaki "SL/TP ve Başarı Oranı Arasındaki İlişki" başlığını okuyun.

  2. Mevcut tüm paritelerde bu işlemi tekrarlayın; açtığınız parite sayısı arttıkça işlem fırsatlarınız da artacaktır.

  3. Artık sadece sinyalleri bekleyin ve bir sinyal geldiğinde işlemi hemen başlatın, önceden belirlenmiş SL ve TP değerlerine sadık kalarak.

  4. İşlem yapmak istediğiniz TP ve SL'yi belirlemek istiyorsanız önce "Girdiler" sekmesinde verileri değiştirmeli ve her bir parite için değerleri pip cinsinden girmelisiniz. Daha sonra, o paritenin her TF'sini gözlemleyin, en iyi sonuç veren TF’yi seçin ve sinyallere dikkat edin.

Telefonla özgürce işlem yapma:

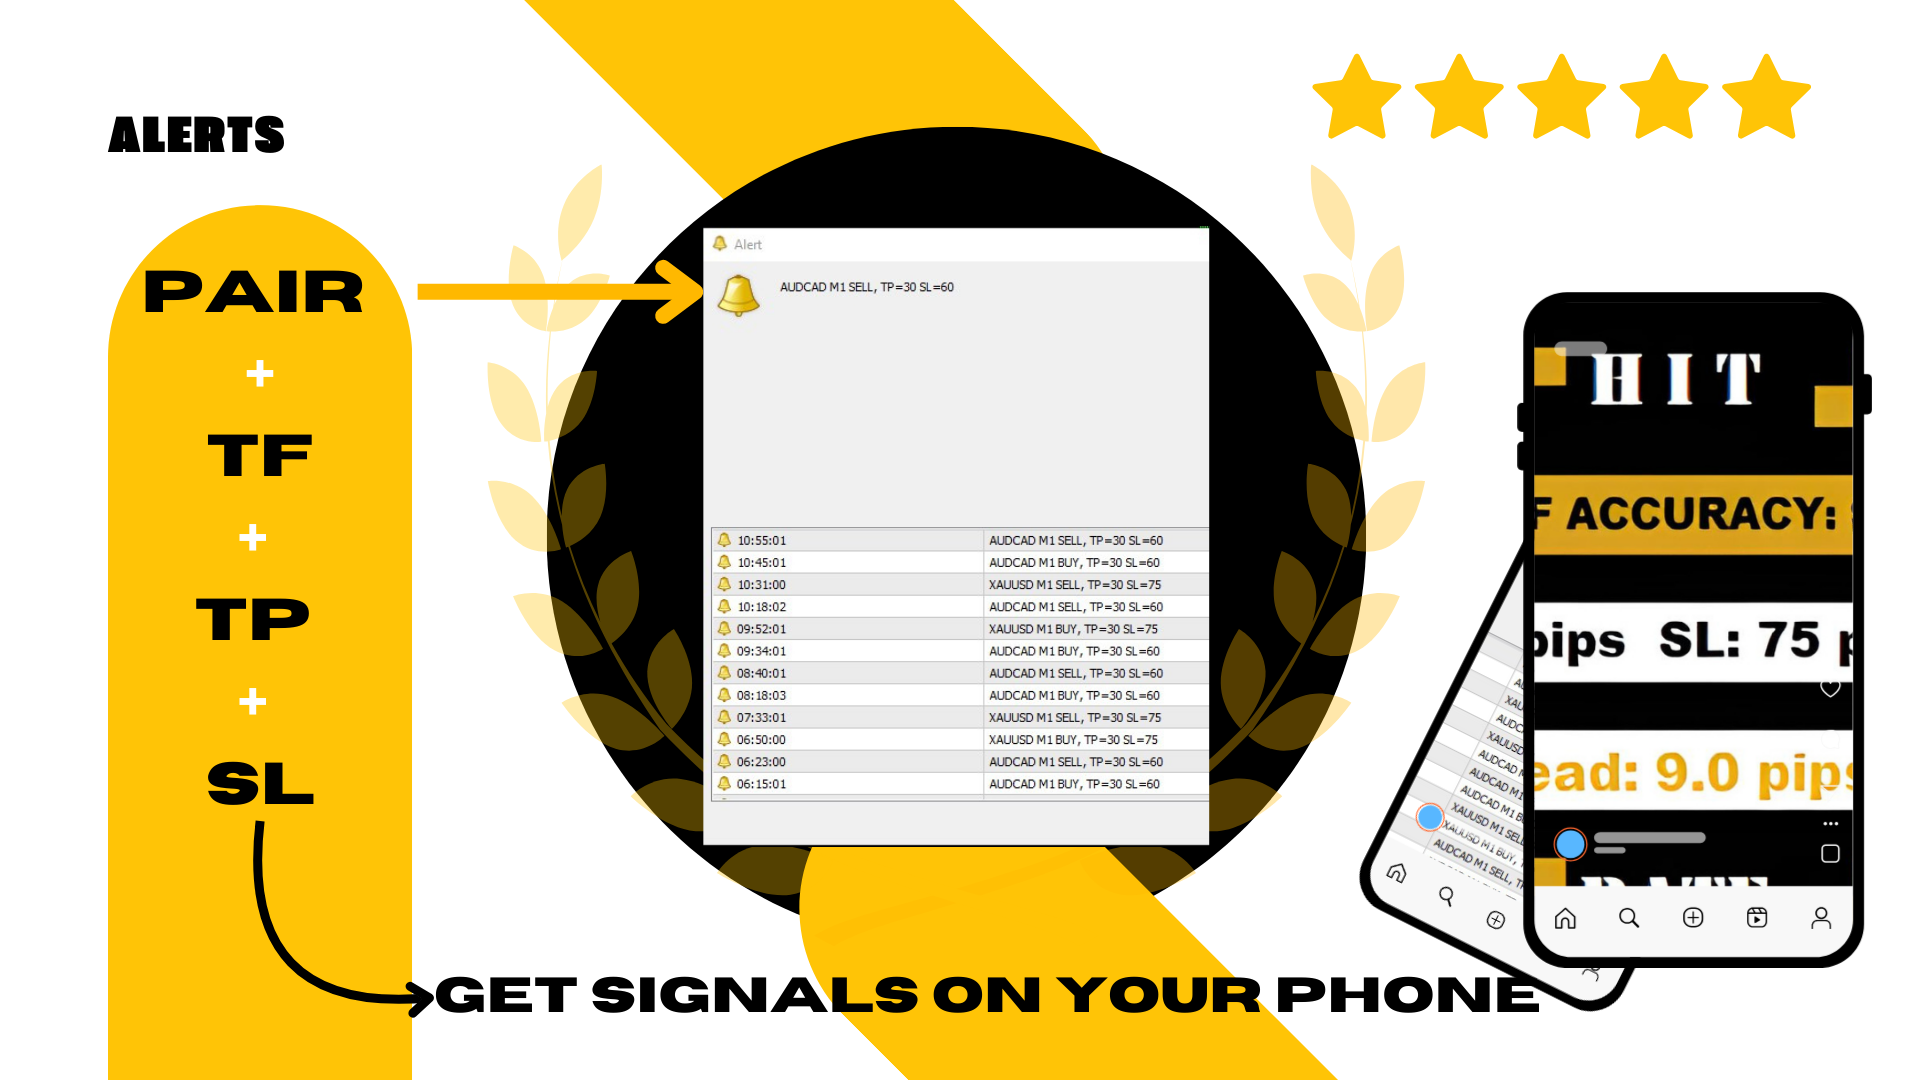
Bu "Adım adım" işlemi bilgisayardan yapılandırılmalıdır, ancak daha sonra işlemlerle ilgili bildirimleri telefonunuzdan alabilirsiniz. Nasıl? Telefonunuzu MT4 terminalinizden push mesajları alacak şekilde ayarlayın ve terminalden telefonunuza bildirim izni verin.

Bir sinyal verildiğinde, telefonunuzda şu bilgileri alırsınız: PARİTE - TF - SİNYAL TÜRÜ (ALIŞ/SATIŞ) - ve o parite için önceden yapılandırılmış TP ve SL değerleri.


Bu şekilde, bilgisayarın başında sürekli kalmanıza gerek kalmaz çünkü işlemleri telefonunuzdan başlatabilir, paritenin SL ve TP'sini ayarlayabilir ve sürekli izleme zorunluluğundan kurtulabilirsiniz.

Bilgisayardan işlem yapmayı tercih edenler için, aynı verilerle (PARİTE - TF - SİNYAL TÜRÜ ve TP ve SL değerleri) sesli ve görsel sinyal, her bir parite için bir sinyal verildiğinde ekranınızda görünür.


SL/TP ve Başarı Oranı Arasındaki İlişkiyi Anlama

Bir ticaret stratejisinin başarısı iki temel faktöre bağlıdır: birincisi Stop Loss (SL) ile Take Profit (TP) arasındaki oran, ikincisi ise sinyalin başarı oranıdır. Her biri stratejinin kârlılığında temel bir rol oynar ve sistemin optimize edilmesi için bu ikisinin nasıl birlikte çalıştığını anlamak önemlidir.

1. SL/TP Oranı:

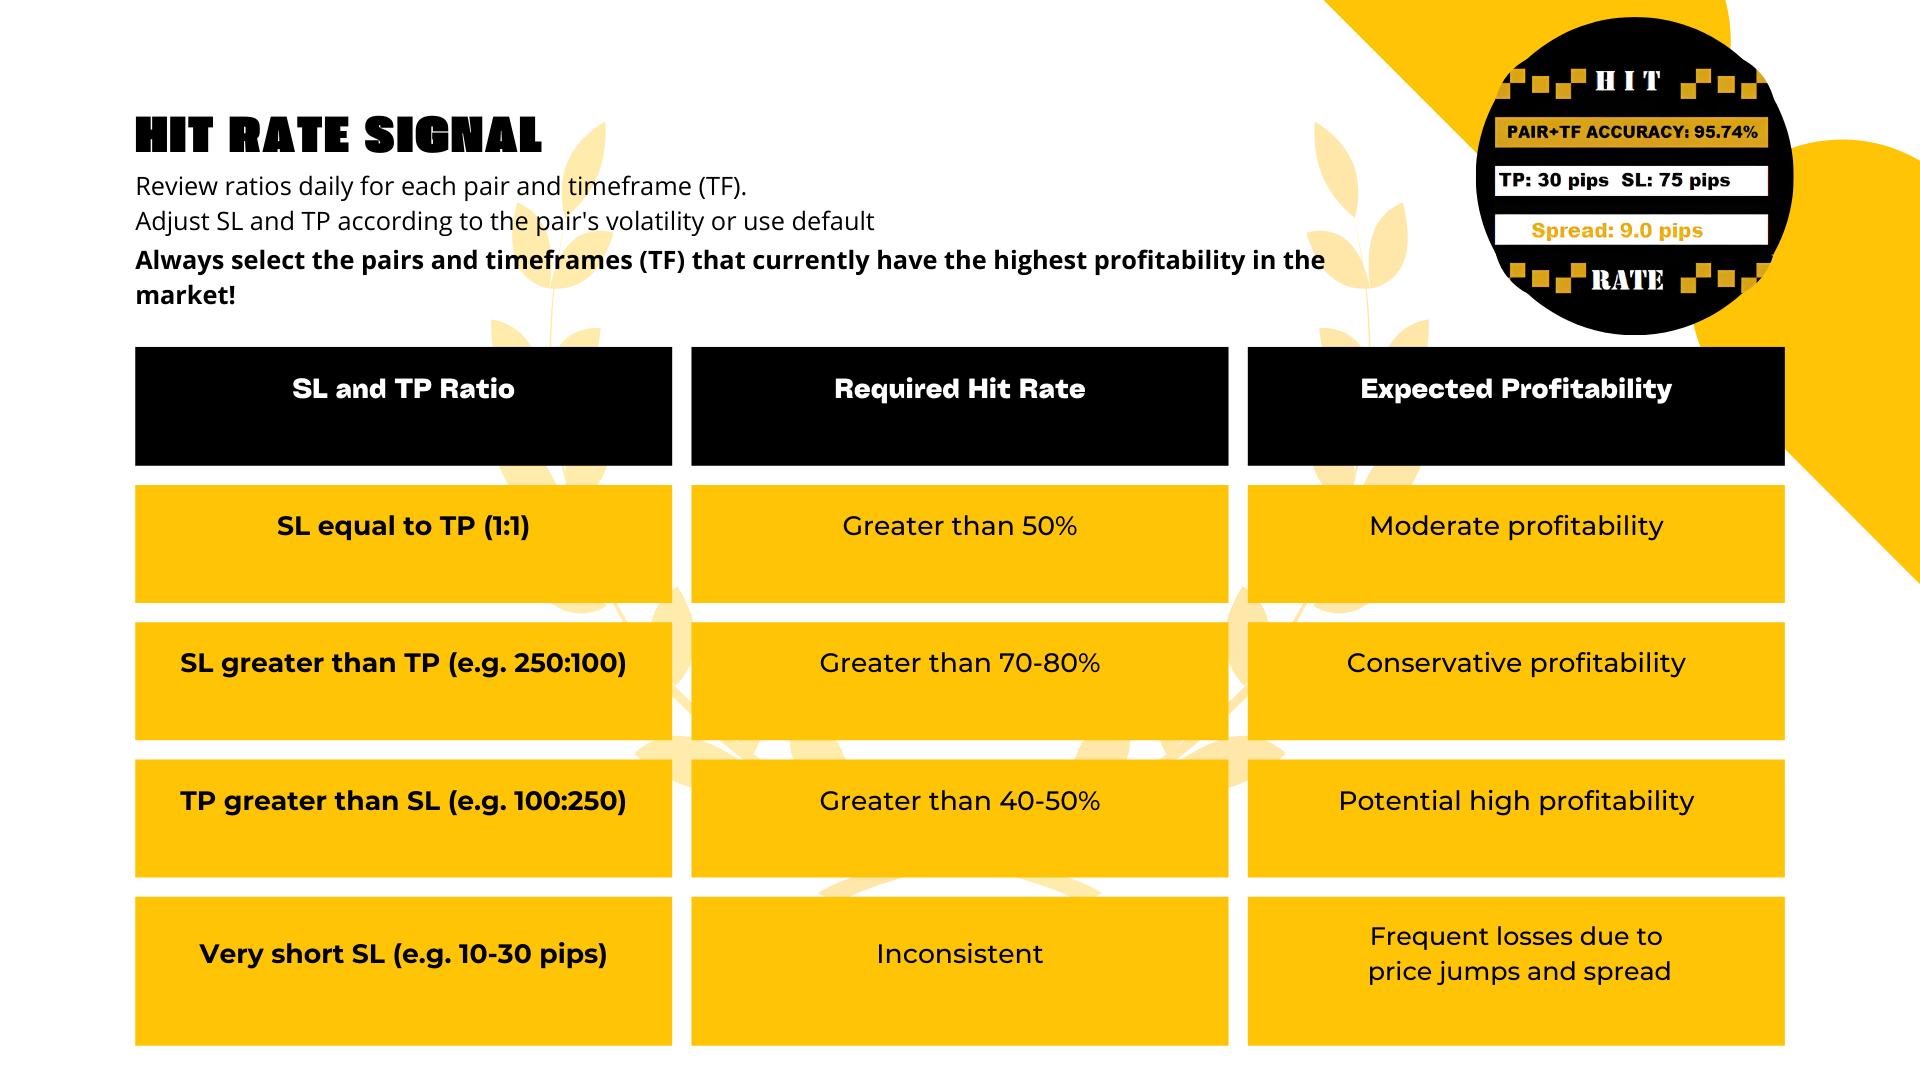
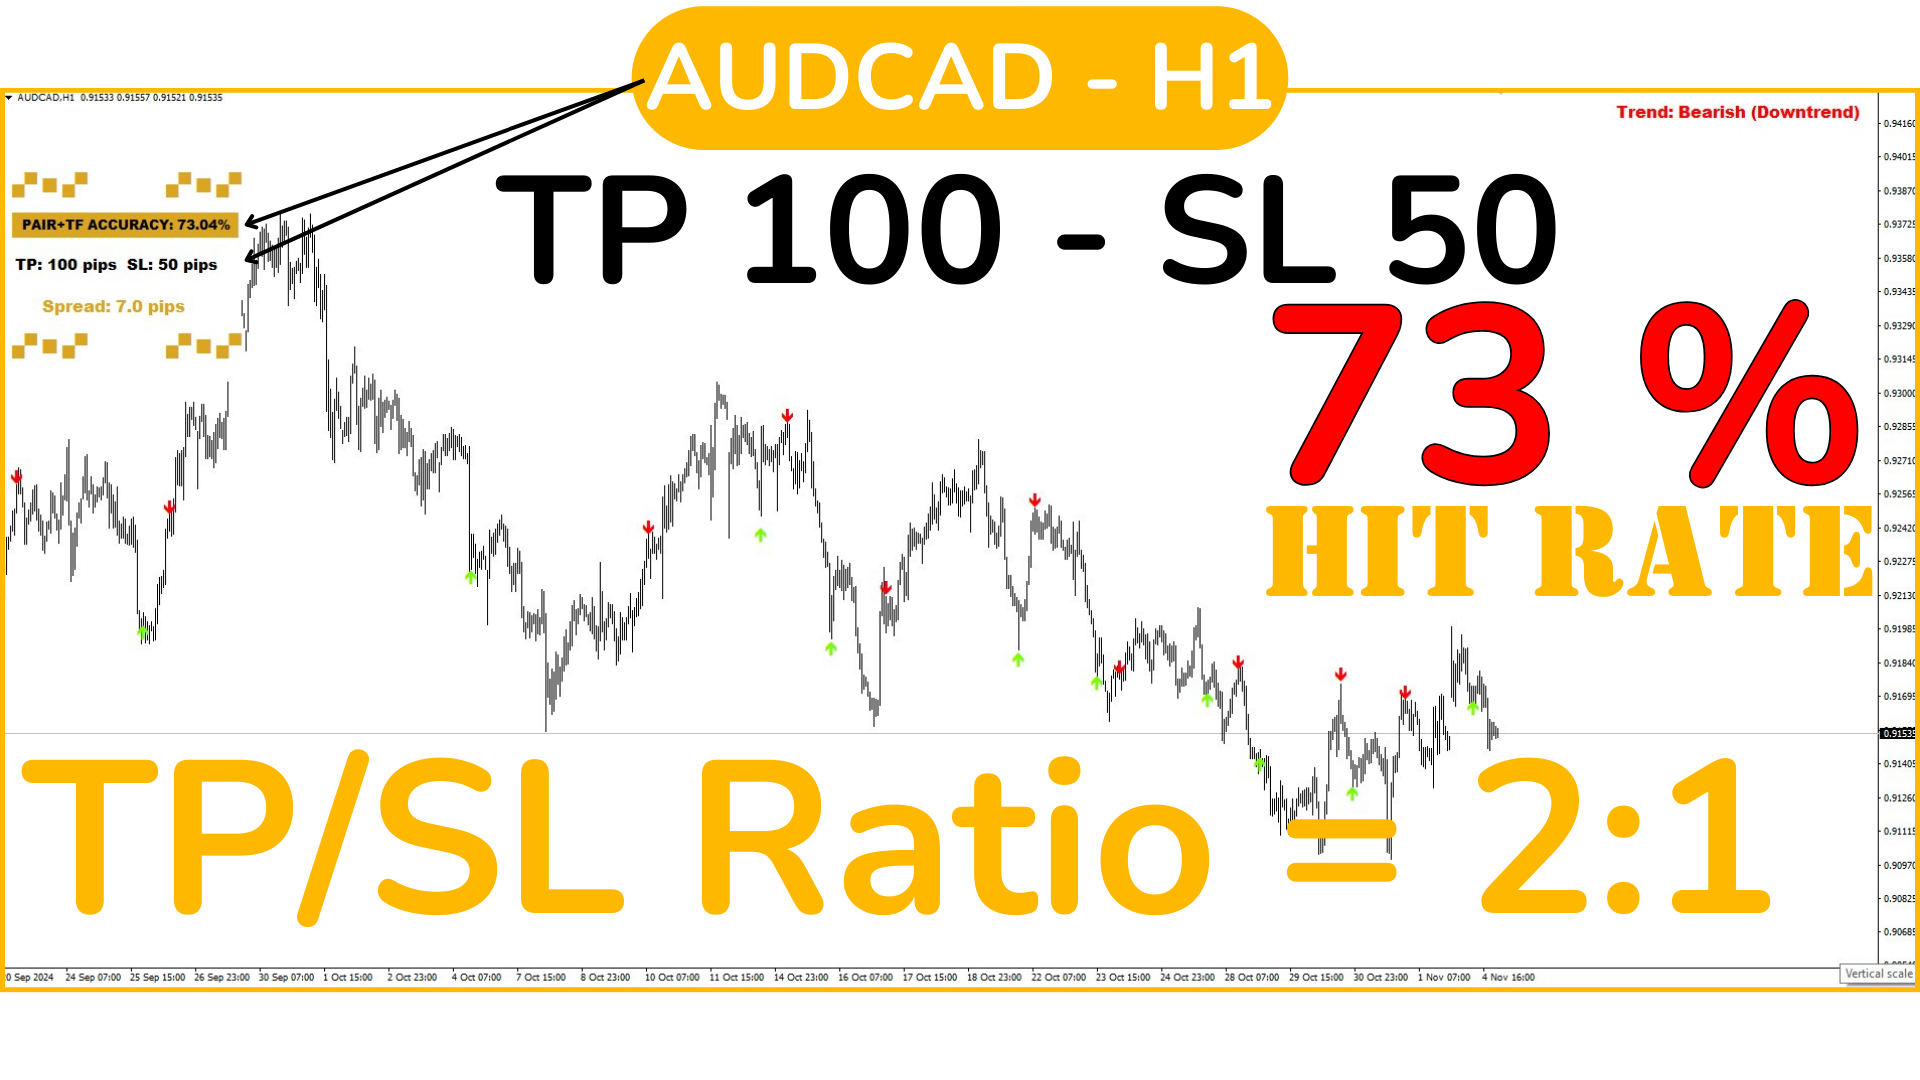
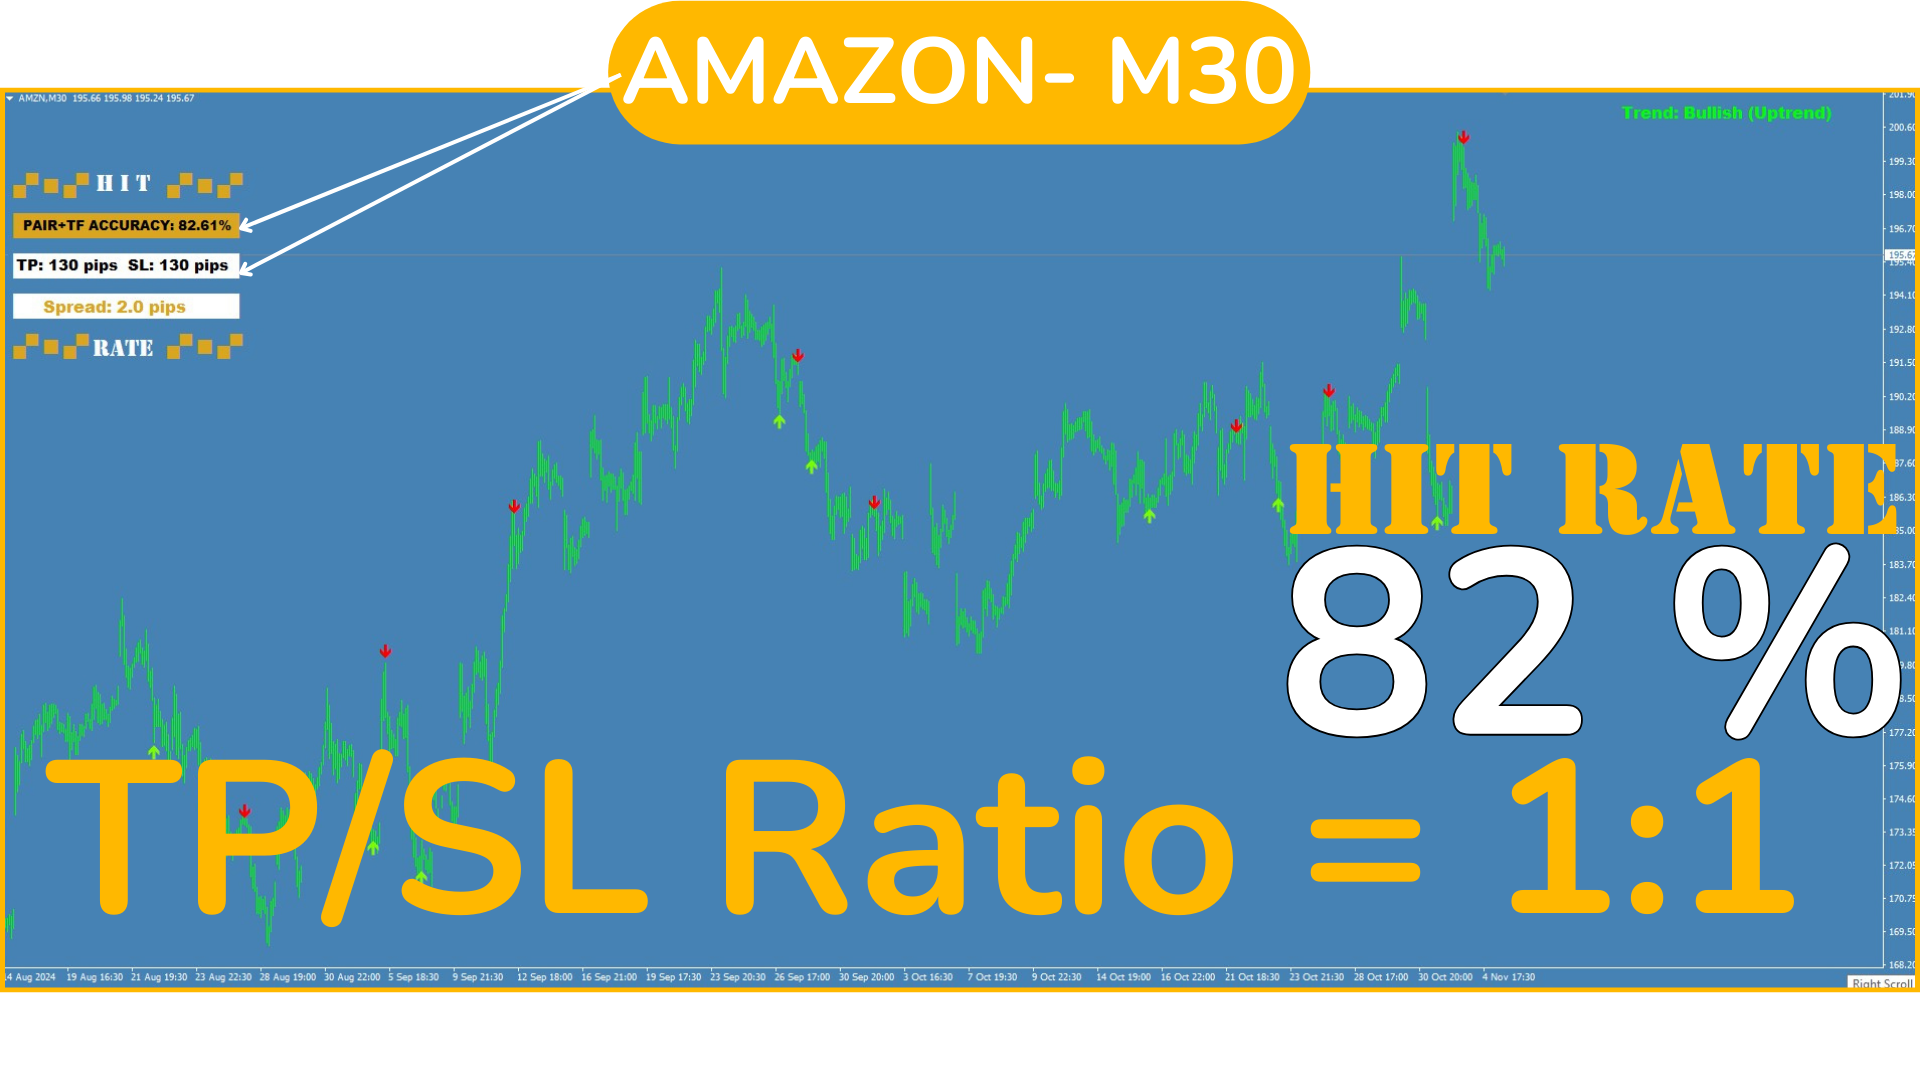
  • SL/TP Oranı 1:1: TP boyutu SL ile aynıdır (örneğin, SL: 100 pip ve TP: 100 pip). Bu durumda, stratejinin kârlı olması için başarı oranının %50'den fazla olması gerekir çünkü kazançlar ve kayıplar benzer olacaktır.
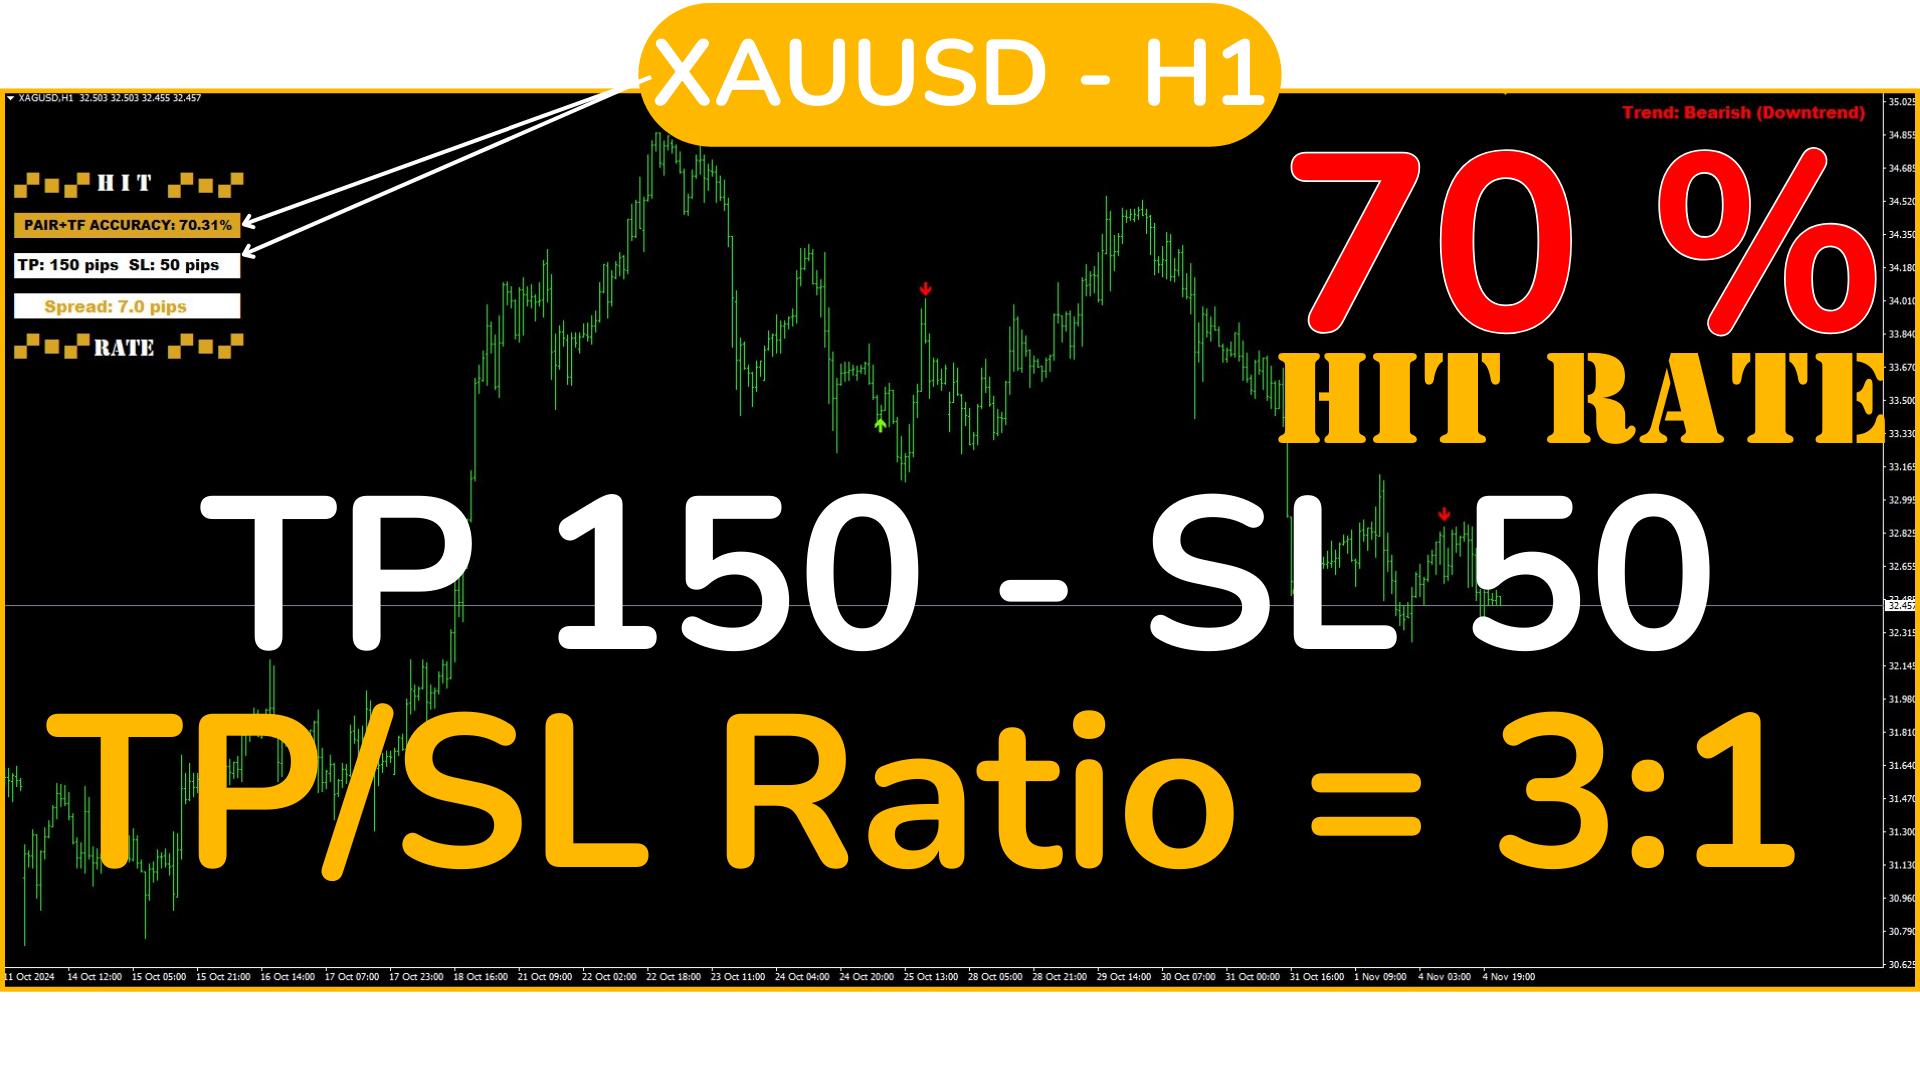
  • SL, TP'den büyük: (örneğin, SL: 250 pip ve TP: 100 pip), SL'ye ulaşıldığında kayıpları telafi etmek için çok daha yüksek bir başarı oranına ihtiyaç duyulur. Bu durumda, %70 veya %80’in üzerinde bir başarı oranı idealdir.
  • TP, SL'den büyük: (örneğin, TP: 250 pip ve SL: 100 pip), her kazanç birkaç kaybı telafi edeceğinden, daha düşük bir başarı oranıyla da strateji kârlı olabilir. Burada %40-50 başarı oranı kâr elde etmek için yeterli olabilir.

Her durumda!! SL çok "kısa" ise, örneğin 10-30 pip, sürekli olarak işleme konulacak (Spread’e dikkat edin) ve aslında kazançlı olacak işlemler kayıpla sonuçlanacaktır. Fiyatın hareket etmesi için yeterli alan bırakmaya özen gösterin (cömert bir SL).

2. Başarı Oranı:

  • Başarı oranı, sistemin tahminlerde ne sıklıkla başarılı olduğunu gösterir. Yüksek bir başarı oranına sahip bir sistem (örneğin %90) daha güvenilirdir ve SL'nin TP’den büyük olduğu daha geniş SL/TP oranlarına izin verir.
  • Bununla birlikte, başarı oranı düşük olsa bile TP, SL’den çok büyük olduğu sürece bu her zaman kayıplara yol açmaz. TP daha büyük olduğunda, az sayıda başarı bile kayıpları kapatır.

    BU NEDENLE SİNYALİN BAŞARI ORANINI ÖNCEDEN BİLMEK, İYİ BİR SERMAYE YÖNETİMİ (SL+TP) İLE BİRLİKTE OPTİMAL SONUÇLAR ELDE ETMEK İÇİN ÇOK ÖNEMLİDİR.


Parite ve TF’ye Göre Optimizasyon:

Her parite ve zaman dilimi, aynı SL/TP oranına farklı tepki verebilir, bu nedenle paritenin ve TF’nin performansına göre SL ve TP’yi ayarlamak önemlidir. Örneğin, volatilitesi yüksek paritelerde veya daha büyük TF'lerde daha geniş bir TP kullanmak faydalı olabilir.

Her parite ve TF için farklı SL ve TP ayarlarını deneyin ve her durumda başarı oranını gözlemleyin. Bu, kazançları maksimize etmek ve kayıpları minimize etmek için en uygun dengeyi bulmanıza yardımcı olur.


Kârlılığı Değerlendirme Örneği:

SL'nin 250 pip, TP'nin ise 100 pip olduğu bir stratejiyi düşünelim. Bu ayarın kârlı olması için, başarı oranının İDEAL OLARAK %70-%80’DEN YÜKSEK OLMASI gerekir. Bu, belirli paritenin volatilitesi ve davranışına bağlı olarak değişir, kazançların SL'ye ulaşıldığında oluşan kayıpları telafi edebilmesi için gereklidir.

Bununla birlikte, oran tersine çevrilerek SL 100 pip ve TP 250 pip olarak ayarlanırsa, %40-50 başarı oranı yeterli olabilir çünkü her kazanç işlemi birkaç kaybı telafi edecektir.


Özet:

  • SL, TP’den büyük: Yüksek bir başarı oranı gereklidir (idealde %70’in üzerinde).
  • TP, SL’den büyük: Daha düşük bir başarı oranıyla çalışabilir, yaklaşık %40-50.
  • Günlük Optimizasyon: En iyi performansı elde etmek için her parite ve TF'de seçilen oranın korunduğundan emin olmak için günlük olarak kontrol edin ve bir paritenin performansının düştüğünü fark ederseniz, "adım adım" süreci tekrarlayın ve en iyi yapılandırmayı yeniden değerlendirin.

Bu stratejinin Forex, Altın, Gümüş, Hisse Senetleri, Endeksler ve hatta brokeriniz izin veriyorsa Kripto paritelerinde, ayrıca herhangi bir TF’de kullanılabileceğini anlamak önemlidir; bu nedenle, 1- Spread’in çok yüksek olduğu 2- Aradığımız orana sahip olmayan paritelerde işlem yapmaya gerek yoktur, en iyi olanları seçin!


Son olarak, tek bir ideal yapılandırma olmadığını unutmayın. Ayarları değiştirdikçe, farklı yapılandırmaların parite ve TF’ye bağlı olarak iyi sonuçlar verebileceğini göreceksiniz. Bu nedenle, her bir SL ve TP (önceden test edilmiş) ile ne zaman işlem yapmamız gerektiğini bildiren açık bir sinyal almak, Hit Rate TopBottom Signal’i eksiksiz bir strateji yapar. Bildirimlerdeki verileri okuyarak ve buna göre hareket ederek, analiz edilen ve test edilmiş bilgilere dayanarak güvenli bir şekilde karar alabilirsiniz.

Stres olmadan işlem yapma, basit ve net. Tahmin veya şüpheye yer yok!


Önerilen ürünler
THIS IS A NEW PRODUCT RELEASE -  RENT FOR 1 MONTH FOR JUST $49.99: OFFER EXTENDS UNTIL THE END OF JANUARY 2026.   STRATEGY TESTER HAS LIMITED FUNCTIONS AND DOES NOT BEHAVE EXACTLY AS THE INDICATOR WOULD ON A DEMO. Transform Your Trading with Advanced Multi-Timeframe MACD Analysis The Continuation and Reversal Indicator is a sophisticated technical analysis tool that revolutionizes how you interpret MACD signals by analyzing multiple timeframes simultaneously. This professional-grade indicator p
Arbitrage Indicators is a professional and easy-to-use Forex trading indicator that uses the best trading principles of the latest AI arbitrage models. This indicator provides accurate buy and sell signals. Applies to currency pairs only. It has six different metrics options, MACD, KDJ, RSI, CCI, RVI, DEMARK. It can be freely switched by users, and intuitively shows the direction and reversal signal of the currency pair. When the two lines cross colors, the currency has a high probability of rev
Alpha Trend sign has been a very popular trading tool in our company for a long time. It can verify our trading system and clearly indicate trading signals, and the signals will not drift. Main functions: Based on the market display of active areas, indicators can be used to intuitively determine whether the current market trend belongs to a trend market or a volatile market. And enter the market according to the indicator arrows, with green arrows indicating buy and red arrows indicating se
VR Cub
Vladimir Pastushak
VR Cub , yüksek kaliteli giriş noktaları elde etmenin bir göstergesidir. Gösterge, matematiksel hesaplamaları kolaylaştırmak ve bir pozisyona giriş noktalarının aranmasını basitleştirmek için geliştirildi. Göstergenin yazıldığı ticaret stratejisi uzun yıllardan beri etkinliğini kanıtlamaktadır. Ticaret stratejisinin basitliği, acemi yatırımcıların bile başarılı bir şekilde ticaret yapmasına olanak tanıyan büyük avantajıdır. VR Cub, pozisyon açılış noktalarını ve Kâr Al ve Zararı Durdur hedef sev
This is the complete REX package. It consists of the lite, pro and ULTRA version.  Perfect for beginners and intermediates. REX complete is 100% non repaint. The strategy is based on a mix of different strategies, statistics, including pivot points, oscillators and patterns.  As the trading idea consists of a variety of some classic indicators like Momentum, Williams Percent Range, CCI, Force Index, WPR, DeMarker, CCI, RSI and Stochastic, it is clear that the fundamental indicators have being u
Chart Patterns Detect 15 patterns (Ascending Triangle, Descending Triangle, Rising Wedge, Falling Wedge, Bullish Flag, Bearish Flag, Bullish Rectangle, Bearish Rectangle Symmetrical triangle, Head and Shoulders, Inverted Head and Shoulders, Triple top, Triple Bottom, Double Top, Double Bottom) Use historical data to calculate the probability of each pattern to succeed (possibility to filter notification according to the chance of success) gives graphic indication about the invalidation level and
Szia! Egy indikátorral. Több idő gyertyájának kirajzoltatása egy charton. Különböző színek rendelhetők a long és short gyertyákhoz. Vonal vastagsága állítható. A gyertya kitöltése engedélyezhető. Hello! With an indicator. Drawing multiple time candles on a chart. Different colors can be ordered for long and short candles. Line thickness can be adjusted. Filling the candle can be allowed. Videó: https://www.youtube.com/watch?v=-9bequnAw-g&amp ;ab_channel=GyulaKlein
Preface: First of all, let me introduce myself. I am a programmer and have been working for over 20 years. 2023 has passed, and our studio has achieved a record of 500 times with 7 manual transmissions. Below, we will show you how to do it through a series of operations. The first step is to model. Modeling is to find a fixed trading pattern. I think everyone has heard of a 2/8 probability, and through this probability, we can further refine it, which means that 1 to 4 is the optimal state. We h
The main idea of this indicator is rates analysis and prediction by Fourier transform. Indicator decomposes exchange rates into main harmonics and calculates their product in future. You may use the indicator as a standalone product, but for better prediction accuracy there is another related indicator - FreqoMaster - which uses FreqoMeterForecast as a backend engine and combines several instances of FreqoMeterForecast for different frequency bands. Parameters: iPeriod - number of bars in the ma
Visual Vortex Indicator MT4
AL MOOSAWI ABDULLAH JAFFER BAQER
Unleash the Power of Market Dynamics with the Vortex Indicator! The Visual Vortex Indicator is your advanced tool for decoding market trends, reversals, and momentum shifts. Priced at $65, this indicator provides a comprehensive view of market behavior, but it’s designed for you to fine-tune and optimize it according to your unique trading strategy. What Makes It Unique? The Vortex Indicator is based on a strategy that identifies directional movements and trend strength by analyzing key price d
This indicator is another variant of the famous powerful indicator Fibonacci-SS https://www.mql5.com/en/market/product/10136 but has different behaviour in placing Pending Order and TP Line. Automatically places Fibonacci retracement lines from the last highest and lowest visible bars on the chart with: An auto Pending Order (Buy/Sell). Taking Profit 1, Taking Profit 2 is pivot point and Taking Profit 3 for extended reward opportunity. The best risk and reward ratio. Simple and powerful indicat
This advisor enters the market at the opening of   London Market . It has a automatic function that give buy (arrow up green) and sell (arrow down red) signal when the indicator met high probabilities requirements.Once the signal is generated it is the trader discretions to start the order button and do trade manually. Stop loss are base on ATR. Recommended Take profit is 20pips.  The trading system is suitable for both experienced traders and beginners.  Timeframe is  M5 . Minimum account bal
Stratos Pali
Michela Russo
5 (5)
Stratos Pali Indicator   is a revolutionary tool designed to enhance your trading strategy by accurately identifying market trends. This sophisticated indicator uses a unique algorithm to generate a complete histogram, which records when the trend is Long or Short. When a trend reversal occurs, an arrow appears, indicating the new direction of the trend. Important Information Revealed Leave a review and contact me via mql5 message to receive My Top 5 set files for Stratos Pali at no cost! Dow
The indicator provides a superior alternative to price action analysis. It enables the identification of normalized patterns, which are then transformed into a graphical representation to forecast future steps within a time series. In the top-left corner, you'll find information regarding the expected prediction accuracy, determined through a complex MSQE calculation. You have the flexibility to adjust the time window, making it easy to validate the indicator's performance. Additionally, you can
True SnD
Indra Lukmana
5 (1)
This Supply & Demand indicator uses a unique price action detection to calculate and measures the supply & demand area. The indicator will ensure the area are fresh and have a significant low risk zone. Our Supply Demand indicator delivers functionality previously unavailable on any trading platform. Trading idea You may set pending orders along the supply & demand area. You may enter a trade directly upon price hit the specific area (after a rejection confirmed). Input parameters Signal - Set
Simple to read and powerful, no fancy lines and drawings to clutter your chart or distract you. The trend probability oscillator estimates how likely a trend will continue in a certain period. The cummulator period controls how many bars in the past to use and is a proxy for the timescale the trend probability should hold. The use of a Max Line improves this further by indicating when a trend is likely to reverse. In most cases a trend must lose momentum before reversing. Hence, a trend probabil
Arz ve Talep Bölgesi Temel Fiyat Göstergeleri arka plan Sistem K-çizgisindeki arz ve talep alanlarını otomatik olarak arar ve gerçek zamanlı anahtar fiyat çizgilerini çizer. Yatırımcılar fiyat işlem hatlarına göre işlem yapabilirler. Ana Özellikler Sistem K-çizgisindeki arz ve talep alanlarını otomatik olarak arar. Sistem aynı zamanda gerçek zamanlı anahtar fiyat çizgilerini de çizecek ve yatırımcılar fiyat işlem çizgilerine göre işlem yapabilecekler. Dolayısıyla arz ve talep bölgesi stratejisi
Watch the Clock
David Leander Tschacher
Watch the Clock shows a clock at a desired position. The clock is useful if you want to check when a candle closes. You can also set an alert to be prepared before the news. ️ Watch the Clock works also in the strategy tester. ️ Watch the Clock requires a minimum of CPU power. ️ Watch the Clock can improve your manual style of trading. Inputs Alert -> At which time should the alert occur? Time Shift in Minutes -> Should the time be incremented by x minutes? Size -> The font size of the tim
MACD Divergence
Sergey Deev
2.5 (2)
The indicator detects divergence signals - the divergences between the price peaks and the MACD oscillator values. The signals are displayed as arrows in the additional window and are maintained by the messages in a pop-up window, e-mails and push-notifications. The conditions which formed the signal are displayed by lines on the chart and in the indicator window. Indicator Parameters MacdFast - fast MACD line period MacdSlow - slow MACD line period MacdSignal - MACD signal line period MacdPric
Dynamic Forex28 Navigator
Bernhard Schweigert
4.43 (7)
Dynamic Forex28 Navigator - Yeni Nesil Forex Ticaret Aracı. ŞU ANDA %49 İNDİRİM. Dynamic Forex28 Navigator, uzun zamandır popüler olan göstergelerimizin evrimidir ve üçünün gücünü tek bir göstergede birleştirir: Gelişmiş Döviz Gücü28 Göstergesi (695 inceleme) + Gelişmiş Döviz İMPULS ve UYARI (520 inceleme) + CS28 Kombo Sinyalleri (Bonus). Gösterge hakkında ayrıntılar https://www.mql5.com/en/blogs/post/758844 Yeni Nesil Güç Göstergesi Ne Sunuyor?  Orijinallerde sevdiğiniz her şey, şimdi yeni
Crypto_Forex Göstergesi MT4 için "Sabah Yıldızı deseni". - "Sabah Yıldızı deseni" göstergesi Fiyat Hareketi ticareti için çok güçlü bir göstergedir: Yeniden boyama yok, gecikme yok. - Gösterge grafikte boğa Sabah Yıldızı desenlerini algılar: Grafikte mavi ok sinyali (resimlere bakın). - PC, Mobil ve E-posta uyarılarıyla. - Ayrıca kardeşi - ayı "Akşam Yıldızı deseni" göstergesi mevcuttur (aşağıdaki bağlantıyı takip edin). - "Sabah Yıldızı deseni" göstergesi Destek/Direnç Seviyeleriyle birleştir
ZhiBiMACD MT4
Qiuyang Zheng
4.5 (2)
This is a unique MACD indicator that is more accurate and easy to use than traditional MACD. It is suitable for any chart cycle and is suitable for any market variety. The red column is the (Buy) band signal, and the blue column is the (Sell) band signal. The yellow and green lines are trend lines, and the two lines never cross. Buy: In the blue column, look at the green line up through the middle 0 axis. Sell: In the red column, look at the yellow line down the middle 0 axis. The MACD's de
The indicator identifies two most important patterns of technical analysis - Pin Bar and Engulfing. MT5-version  https://www.mql5.com/en/market/product/53701 Settings: Mincandle size for PinBar - The minimum size of the Pin-Bar candlestick; Percentage of candle body on size - The percentage of the candle body in relation to its length; PinBar Alert - Alert when a Pin-Bar is detected; PinBar Mail - Sends an email when a Pin Bar is found; PinBar Notification - Sends a push notification when a Pin
PABT Pattern Indicator - it's classical system one of the signal patterns. Indicator logic - the Hi & Lo of the bar is fully within the range of the preceding bar, look to trade them as pullback in trend. In the way if indicator found PABT pattern it's drawing two lines and arrow what showing trend way.  - First line - it's entry point and drawing at: 1. On the high of signal bar or on middle of the signal bar (depending from indicator mode) for buy; 2. On the low of signal bar or on middle of t
RQL Trend Board – Description RQL Trend Board   is a simple but powerful multi-timeframe trend dashboard. It shows the current market bias across several timeframes at the same time, using an internal trend-classification method. Each timeframe is displayed as a colored box:   Green   – bullish bias → look for   long   setups   Yellow   – ranging / unclear →   no trade zone   Red   – bearish bias → look for   short   setups The indicator gives a clear   overall picture   of where the
FREE
MT4 için Crypto_Forex Göstergesi PINBAR Deseni, Yeniden Çizme Yok, Gecikme Yok. - "PINBAR Deseni" göstergesi, Fiyat Hareketi işlemleri için çok güçlü bir göstergedir. - Gösterge, grafikteki PinBar'ları algılar: - Boğa PinBar - Grafikte mavi ok sinyali (resimlere bakın). - Ayı PinBar - Grafikte kırmızı ok sinyali (resimlere bakın). - Bilgisayar, Mobil ve E-posta uyarılarıyla. - "PINBAR Deseni" göstergesi, Destek/Direnç Seviyeleriyle birleştirmek için mükemmeldir. Yüksek kaliteli Trading Robotl
Owl smart levels
Sergey Ermolov
4.24 (37)
MT5 versiyonu  |  FAQ Owl Smart Levels Indicator ,   Bill Williams'ın gelişmiş fraktalları , piyasanın doğru dalga yapısını oluşturan Valable ZigZag ve kesin giriş seviyelerini gösteren   Fibonacci seviyeleri   gibi popüler piyasa analiz araçlarını içeren tek gösterge içinde eksiksiz bir ticaret sistemidir. pazara ve kar elde edilecek yerlere. Stratejinin ayrıntılı açıklaması Gösterge ile çalışma talimatı Baykuş Yardımcısı ticaretinde Danışman Yardımcısı Kullanıcıların özel sohbeti -> Satın ald
Spirit mt4
Alena Snigireva
5 (1)
Spirit mt4 is an indicator that works without flashing, the signals are triggered after the arrow at the beginning of the next candle Includes several indicators for overbought and oversold levels. Works with any currency pair: EUR/USD, AUD/USD and others. After the purchase, send me a private message and I will send you the settings that I use for this indicator. Suitable for trading cryptocurrencies. I like to trade cryptocurrency more, so I use it more there. It can also be used for bi
Distinctive
Tatiana Savkevych
Distinctive is a forex trending arrow indicator for identifying potential entry points. I like it, first of all, because it has a simple mechanism of work, adaptation to all time periods and trading tactics. Created on the basis of a regression channel with filters. Plotting the Lawrence indicator signals on a price function chart using a mathematical approach. How it works - when the price breaks out in the overbought / oversold zone (channel levels), a buy or sell signal is generated. Everyt
MetaTrader 5 version available here : https://www.mql5.com/en/market/product/24882 FFx Basket Scanner is a global tool scanning all pairs and all timeframes over up to five indicators among the 16 available. You will clearly see which currencies to avoid trading and which ones to focus on. Once a currency goes into an extreme zone (e.g. 20/80%), you can trade the whole basket with great confidence. Another way to use it is to look at two currencies (weak vs strong) to find the best single pairs
Bu ürünün alıcıları ayrıca şunları da satın alıyor
Miraculous Göstergesi – Gann Dokuz Kareye Dayalı %100 Tekrarlamayan Forex ve İkili Araç Bu video, Forex ve İkili Opsiyon traderları için özel olarak geliştirilmiş son derece doğru ve güçlü bir ticaret aracı olan Miraculous Göstergesi 'ni tanıtıyor. Bu göstergeyi benzersiz kılan, efsanevi Gann Dokuz Karesi ve Gann Titreşim Yasası 'na dayanmasıdır; bu da onu modern ticarette mevcut en hassas tahmin araçlarından biri yapmaktadır. Miraculous Göstergesi tamamen tekrarlamaz ; yani mum kapandıktan son
Precautions for subscribing to indicator This indicator only supports the computer version of MT4 Does not support MT5, mobile phones, tablets The indicator only shows the day's entry arrow The previous history arrow will not be displayed (Live broadcast is for demonstration) The indicator is a trading aid Is not a EA automatic trading No copy trading function The indicator only indicates the entry position No exit (target profit)  The entry stop loss point is set at 30-50 PIPS Or the front hi
Pulse Scalping Line - an indicator for identifying potential pivot points. Based on this indicator, you can build an effective Martingale system. According to our statistics, the indicator gives a maximum of 4 erroneous pivot points in a series. On average, these are 2 pivot points. That is, the indicator shows a reversal, it is erroneous. This means that the second signal of the indicator will be highly accurate. Based on this information, you can build a trading system based on the Martingale
BinaryIndicator is a highly accurate indicator for trading binary options. It shows excellent results in scalping. This indicator is based in multifactor analysis of trend indicators, as well as confirmation oscillators, which in the end gives an increased accuracy of signals. Advantages of the indicator Increased accuracy of signals. Excellent results when trading binary options with a short expiration time from M30 to M1 . It works on any timeframes. Works with any trade symbols. Parameters
Rtc ML Ai | Predictor CORE MACHINE LEARNING ENGINE Adaptive ML Market Predictor – Multi-Bar Trend & Candle Forecast What This Indicator Does This indicator is a  real-time market prediction engine  designed to analyze price behavior and estimate  future market tendencies . Unlike conventional indicators, this system  does not rely on static parameters or historical curve-fitting , but adapts its internal state dynamically during live market operation. Instead of using static rules, the indic
FFx Engulfing Setup Alerter gives trade suggestions with Entry, Target 1, Target 2 and StopLoss. Below are the different options available: Entry suggestion - pips to be added over the break for the entry 3 different options to calculate the SL - by pips, by ATR multiplier or at the pattern High/Low 3 different options to calculate the 2 TPs - by pips, by ATR multiplier or at Risk/Reward Offset the dashboard - any place on the chart Remove the suggestion once the price reached the SL line Lines
FFx InsideBar Setup Alerter gives trade suggestions with Entry, Target 1, Target 2 and StopLoss. Below are the different options available: Entry suggestion - pips to be added over the break for the entry Minimum candle size - to avoid too close buy/sell entry suggestions 3 different options to calculate the SL - by pips, by ATR multiplier or at the pattern High/Low 3 different options to calculate the 2 TPs - by pips, by ATR multiplier or at Risk/Reward Offset the dashboard - any place on the c
FFx OutsideBar Setup Alerter gives trade suggestions with Entry, Target 1, Target 2 and StopLoss. Below are the different options available: Entry suggestion - pips to be added over the break for the entry. 3 different options to calculate the SL - by pips, by ATR multiplier or at the pattern High/Low. 3 different options to calculate the 2 TPs - by pips, by ATR multiplier or at Risk/Reward. Offset the dashboard - any place on the chart. Remove the suggestion once the price reached the SL line.
FFx PinBar Setup Alerter gives trade suggestions with Entry, Target 1, Target 2 and StopLoss. Below are the different options available: Entry suggestion - pips to be added over the break for the entry Minimum candle size - to avoid too small candles 3 different options to calculate the SL - by pips, by ATR multiplier or at the pattern High/Low 3 different options to calculate the 2 TPs - by pips, by ATR multiplier or at Risk/Reward Offset the dashboard - any place on the chart Remove the sugges
Automatic, live & interactive picture of all trendlines. Assign push, email and sound alerts to the lines of your choice and be informed about price rollback, breakout, rollback after breakout, number of rollbacks, line expiration by double breakout. Correct, drag or delete the lines and interactively tune the line system. https://youtu.be/EJUo9pYiHFA . Chart examples https: //www.mql5.com/en/users/efficientforex Price Interaction Events All events are effective immediately and only after one
The purpose of this new version of the MT4 standard indicator provided in your platform is to display in a sub-window multiple timeframes of the same indicator with its divergences. See the example shown in the picture below. But the display isn't like a simple MTF indicator. This is the real display of the indicator on its timeframe. Here's the options available in the FFx divergences indicator: Select the timeframes to be displayed (M1 to Monthly) Define the width (number of bars) for each tim
The purpose of this new version of the MT4 standard indicator provided in your platform is to display in a sub-window multiple timeframes of the same indicator with its divergences. See the example shown in the picture below. But the display isn't like a simple MTF indicator. This is the real display of the indicator on its timeframe. Here's the options available in the FFx divergences indicator: Select the timeframes to be displayed (M1 to Monthly). Define the width (number of bars) for each ti
The FFx Dashboard MTF alerter will show you on a single chart all the timeframes (M1 to Monthly) with their own status for the indicator. 2 Alert Options: Single timeframe: each selected timeframe alert separately when a signal occurs Multi timeframes: all selected timeframes must agree for an alert to be triggered Both options have an input to select the timeframes to be used for the alert(s). How to Understand the Status: Green/Red square: histogram above/below 0 line Green square + Red bord
The FFx Dashboard MTF alerter will show you on a single chart all the timeframes (M1 to Monthly) with their own status for the indicator. 2 Alert Options: Single timeframe: each selected timeframe alert separately when a signal occurs Multi timeframes: all selected timeframes must agree for an alert to be triggered Both options have an input to select the timeframes to be used for the alert(s). How to understand the status: Green/Red square: RSI above/below 50 line Green square + Red border: R
The FFx Dashboard MTF alerter will show you on a single chart all the timeframes (M1 to Monthly) with their own status for the indicator. 2 Alert Options: Single timeframe: each selected timeframe alert separately when a signal occurs Multi timeframes: all selected timeframes must agree for an alert to be triggered Both options have an input to select the timeframes to be used for the alert(s). How to understand the status: Green/Red square: Stoch above/below 50 line Green square + Red border:
The FFx Dashboard MTF alerter will show you on a single chart all the timeframes (M1 to Monthly) with their own status for the indicator. 2 Alert Options: Single timeframe: each selected timeframe alert separately when a signal occurs Multi timeframes: all selected timeframes must agree for an alert to be triggered Both options have an input to select the timeframes to be used for the alert(s). How to understand the status: Green/Red square: Price above/below Cloud (Kumo) Green square + Red bo
The FFx Dashboard MTF alerter will show you on a single chart all the timeframes (M1 to Monthly) with their own status for the indicator. 2 Alert Options: Single timeframe: each selected timeframe alert separately when a signal occurs Multi timeframes: all selected timeframes must agree for an alert to be triggered Both options have an input to select the timeframes to be used for the alert(s). How to understand the status: Green/Red square: MA pointing Up/Down Green square + Red border: MA po
The FFx Dashboard MTF alerter will show you on a single chart all the timeframes (M1 to Monthly) with their own status for the indicator. 2 Alert Options: Single timeframe: each selected timeframe alert separately when a signal occurs. Multi timeframes: all selected timeframes must agree for an alert to be triggered. Both options have an input to select the timeframes to be used for the alert(s). How to understand the status: Green square: Price above PSAR Red square: Price below PSAR Options
The FFx Dashboard MTF alerter will show you on a single chart all the timeframes (M1 to Monthly) with their own status for the indicator. 2 Alert Options: Single timeframe: each selected timeframe alert separately when a signal occurs Multi timeframes: all selected timeframes must agree for an alert to be triggered Both options have an input to select the timeframes to be used for the alert(s). How to understand the status: Green/Red square: CCI above/below levels (ie. 100/-100) Grey square: C
The FFx Dashboard MTF alerter will show you on a single chart all the timeframes (M1 to Monthly) with their own status for the indicator. 2 Alert Options: Single timeframe: each selected timeframe alert separately when a signal occurs Multi timeframes: all selected timeframes must agree for an alert to be triggered Both options have an input to select the timeframes to be used for the alert(s). How to understand the status: Green/Red square: ADX above level Grey square: ADX below level Red bor
The FFx Dashboard MTF alerter will show you on a single chart all the timeframes (M1 to Monthly) with their own status. 2 Alert Options: Single timeframe: each selected timeframe alert separately when a signal occurs Multi timeframes: all selected timeframes must agree for an alert to be triggered Both options have an input to select the timeframes to be used for the alert(s). How to understand the status: Green/Red square: bullish/bearish candle Options available in the FFx Dashboard Alerter
The [GRAFF] III manual trading system is based on multiple MetaTrader (MT4) indicators. Together, the entire PACK of GRAFF III indicators makes an advanced trading tool. The system consists of over 20 different custom-built indicators which have been carefully selected and tested in the long term to produce strong and efficient trading signals. The particular indicators are based on different mathematical formulas, so the entire system is calibrated to remove false signals from its own indicator
FFx Universal Strength Meter PRO is more than a basic strength meter. Instead of limiting the calculation to price, it can be based on any of the 19 integrated strength modes + 9 timeframes. With the FFx USM, you are able to define any period for any combination of timeframes. For example, you can set the dashboard for the last 10 candles for M15-H1-H4… Full flexibility! Very easy to interpret... It gives a great idea about which currency is weak and which is strong, so you can find the best pai
A simplistic indicator informing a user on RSI divergence by sending messages to mobile device and email. The indicator draws 2 vertical lines, marking two RSI extrema that formed the divergence. You get the alert, open the charts and make a decision. The indicator does not show past divergences, thus when you attach it to a chart for the first time you see nothing. Graphics and alerts will appear as soon as divergences do. Drop it in Tester to see how it works. Parameters: RSIPeriod - number of
Pan PrizMA CD Phase is an analogue of the МetaТrader 5 indicator , and is an option based on the Pan PrizMA indicator. Details . Averaging by a quadric-quartic polynomial increases the smoothness of lines, adds momentum and rhythm. Extrapolation by the sinusoid function near a constant allows adjusting the delay or lead of signals. The value of the phase - wave status parameter (which is close in meaning to the trigonometric phase or the angle of the radius-vector rotation in the trigonometric p
Green Wall Arrows
Daniel Luchinger
1 (1)
The Name Green Wall : Arrows hits a lot of TP, by changing the idea of non using SL as something bad, but instead use Small TP and a lot of free Margin and Patience. Use micro TP and a lot of Free Margin with this indicator on Forex. It also can be used with Binary Options. This strategy is intended to be traded Manually. This Indicator runs on Open Bar, arrows will delete when price are against it. The only Indicator Parameter is Alerts true/false, all the rest is included inside the code. Arro
Golden Monowave is monowave indicator, the monowave theory is one of Elliott wave approach and one of most complicate and accurate method. Golden Monowave can shortcut many major steps to identify and describe the monowave. It works on any timeframe and with any trading instrument, including currencies, indices, futures, etc. Input Parameters initial_Bars - set the initial number of bars to calculate. wave_color - select the color of the wave. label_color - select the color of labels. temp_labe
Yazarın diğer ürünleri
HFT Fast M1 Gold Scalper MT5 EA
Martin Alejandro Bamonte
2.11 (9)
HFT AI FAST SCALPER V10.1 Bugüne kadarki en gelişmiş EA sürümümüz; Yapay Zeka tabanlı karar verme , çoklu AI oylama ve dinamik işlem mantığı ile tamamen yeniden tasarlandı. Artık yalnızca XAUUSD (Altın) M1 ile sınırlı değil, aynı zamanda BTCUSD ve ETHUSD ’yi de tam olarak destekliyor. Yüksek frekanslı girişler, akıllı risk yönetimi ve tam adaptasyon sunuyor. Bu EA, OpenRouter üzerinden bağlanan ücretsiz AI modellerini gelişmiş filtrelerle birleştirerek her piyasa koşulunda hassas işlem sağlar
HFT Fast M1 Gold Scalper V8 EA
Martin Alejandro Bamonte
2.33 (3)
ULTRA-OPTİMİZE EDİLMİŞ SÜRÜM – MT4 HFT FAST M1 GOLD SCALPER V8.2 , MT4 versiyonunda şimdiye kadarki en güçlü, en kararlı ve en rafine sürümdür. HFT, yalnızca Altın (XAUUSD) üzerinde M1 zaman diliminde işlem yapan yüksek frekanslı bir scalping uzman danışmandır. Günlük olarak çok sayıda işlem gerçekleştirir. Gerçek bir scalping stratejisi için çok makul lot büyüklükleriyle çalışır ve bu nedenle özel scalping hesapları (RAW veya ECN) gerektirir. ICMarkets , özellikle düşük spread ve daha az slippa
ARIA Connector EA
Martin Alejandro Bamonte
2.17 (30)
Aria Connector EA – V4 (Öğrenme Makinesi + XGBoost Öğrenme Modeli +112 Ücretli ve Ücretsiz AI + Oylama Sistemi + Harici ve Düzenlenebilir Promptlar) Piyasadaki EA'ların çoğu "AI" veya "sinir ağları" kullandığını iddia ederken gerçekte sadece temel scriptler çalıştırırken, Aria Connector EA V4 gerçek AI güdümlü ticaretin anlamını yeniden tanımlıyor. Bu teori değil, pazarlama abartısı değil, MetaTrader 5 platformunuz ile 112 gerçek AI modeli arasında doğrudan, doğrulanabilir bir bağlantı, yeni n
Candle Probability Scalper Kullanım Kılavuzu Bu gösterge, scalping'i kolay ve %100 sezgisel hale getirir. Candle Probability Scalper , GERÇEK ZAMANLI olarak mevcut mum üzerinde alıcıların ve satıcıların güç yüzdelerini bir bakışta gösterir. Yüzdeler her tikte güncellenir, bu sayede alıcı ve satıcıların çoğunluğunun ne yaptığını saniye saniye gecikme olmadan bilirsiniz. Bu, her bir tarafın gücünü belirlemenize veya doğrulamanıza ve dolayısıyla fiyatın olası yönünü tahmin etmenize büyük ölçüde ya
Aurum Apex Mt4 EA
Martin Alejandro Bamonte
5 (2)
Artık Aurum Apex'in demo sürümünü Yorumlar sekmesinden indirerek kendi brokerınızda canlı performansını değerlendirebilirsiniz! Açıklaması Aurum Apex EA, MT4 Platformu için tasarlanmış güçlü bir %100 otomatik ticaret aracıdır. Piyasayı gerçek zamanlı olarak analiz eder ve çeşitli ticaret fırsatlarını tespit eder. Tüm seviyelerdeki tüccarlar için uygun olan Aurum Apex EA, Risk parametresi aracılığıyla ayarlanabilen üç risk modu sunar: Risk = 0.1 (Düşük Risk): Altın hareketlerine aşina olmayan ye
Scalping Signal NO Repaint NO Lag
Martin Alejandro Bamonte
3 (2)
"Scalping Signal No Repaint No Lag", herhangi bir şemaya sürüklendiğinde, herhangi bir şablon veya başka bir gösterge yüklemeye gerek kalmadan tüm gerekli göstergeleri otomatik olarak yükleyen piyasadaki tek göstergedir. Şemayı, sağlanan resimdekiyle tam olarak aynı olacak şekilde otomatik olarak yapılandırır. Bu gösterge, yeniden boyama veya gecikme olmadan sinyaller garanti eder, bu nedenle tüm döviz çiftleri ve zaman dilimlerinde (TF) scalping stratejileri için idealdir. Özellikler Göstergele
Clear Breakout
Martin Alejandro Bamonte
5 (2)
"Breakout Buy-Sell" göstergesi, farklı piyasa seansları (Tokyo, Londra ve New York) sırasında fiyat kırılmalarına dayalı olarak potansiyel alım ve satım fırsatlarını belirlemek ve vurgulamak için tasarlanmıştır. Bu gösterge, traderların alım ve satım bölgelerini, ayrıca kâr alma (TP) ve zarar durdurma (SL) seviyelerini net bir şekilde görselleştirmelerine yardımcı olur. Kullanım Stratejisi Gösterge şu şekilde kullanılabilir: İlk Kurulum : Piyasa seansını seçin ve GMT farkını ayarlayın. Piyasa Gö
GBPUSD Pip Hunter EA Ana Özellikler: M15 Zaman Çerçevesinde GBPUSD için Optimize Edilmiştir: Özellikle GBPUSD çifti için 15 dakikalık grafik üzerinde tasarlanmış ve test edilmiştir. Minimum Tavsiye Edilen Hesap Boyutu: Düşük geri çekilmeler sağlamak için minimum $1000 hesap bakiyesi gereklidir. Spread Uyumluluğu: Karlılığı maksimize etmek için düşük spread veya ECN hesaplarla en iyi şekilde kullanılır. Risk Yönetimi: Ticaret ihtiyaçlarınıza göre Ekponansiyel Lot özelliğini 1.0 olarak ayarlayarak
MTFMA (Çok Zaman Çerçeveli Hareketli Ortalamalar) göstergesi, ana grafikten ayrı bir pencerede farklı zaman dilimlerinde birden fazla hareketli ortalamayı (MA) kullanarak alım ve satım sinyalleri sağlar (yeniden boyamaz). Küçük zaman dilimlerinde scalping için ve daha büyük zaman dilimlerinde uzun vadeli ticaret için uygun, çok yönlü ve kolay yorumlanabilen bir göstergedir. Neden Multi-Frame? Çok zaman çerçeveli terimi, göstergenin birden fazla zaman diliminden gelen verileri kullanma ve birleşt
NextCandlePredictor Göstergesi NextCandlePredictor, yeniden boyamayan, rengini değiştirmeyen, hareket etmeyen, kaybolmayan ve gecikme olmayan bir uyarılı sinyal göstergesidir. Herhangi bir zaman diliminde bir sonraki veya yaklaşan mumların yönünü belirlemenize yardımcı olacaktır. New York, Londra veya her ikisinin de çakıştığı yüksek volatiliteye sahip piyasalar için şiddetle tavsiye edilir. Ana Özellikler: Zaman Dilimlerinde Esneklik: M1'den H1'e ve ötesine kadar herhangi bir zaman diliminde hı
"MultiSymbol & TF Chart Integrated" göstergesi, tek bir grafikte (çoklu mod) tercih ettiğiniz zaman dilimlerinde 60'a kadar döviz çiftini izleyebilmenizi veya işlem yaptığınız çifti tüm TF'lerde görüntüleyebilmenizi (basit mod) sağlayarak piyasaya hızlı ve kapsamlı bir bakış sunmak üzere tasarlanmıştır. Ana Avantajlar: Tam İzleme: Tek bir grafikte tüm istenen çiftleri bir bakışta gerçek zamanlı olarak izlemeye olanak tanır. Zaman Tasarrufu: Grafikler arasında geçiş yapma ihtiyacını ortadan kaldı
Pairs and TF Changer
Martin Alejandro Bamonte
Farklı para çiftlerini ve zaman dilimlerini izlemek için birden fazla grafik arasında geçiş yapmaktan bıktınız mı? Pairs and TF Changer göstergesi ticaret deneyiminizi devrim yapacak! Stratejiniz için tüm göstergeleri yükledikten sonra, Pairs and TF Changer 'i grafiğe ekleyin. Gerekirse, konumunu, renklerini veya görüntülenen sütun sayısını ayarlayabilirsiniz! Ana Özellikler: Kesintisiz Entegrasyon: Bu göstergeyi ticaret stratejinize zahmetsizce entegre edin. Tek bir tıklamayla tüm para çiftler
GO Trend MultiTimeFrame
Martin Alejandro Bamonte
GoTrend Çok Zaman Dilimli Gösterge "GoTrend Multi-Timeframe" göstergesi, farklı zaman dilimlerinde bir döviz çiftinin genel ve spesifik eğilimlerini hızlı ve verimli bir şekilde değerlendirmek isteyen tüccarlar için vazgeçilmez bir araçtır. Bu gösterge, tüccarların piyasa yönünü bir bakışta net ve kapsamlı bir şekilde görmelerini sağlayarak karar alma süreçlerini optimize eder ve ticaret stratejilerinin etkinliğini artırır. Ana Özellikler: Çok Zaman Dilimli Analiz: Bu gösterge, M5, M15, M30, H1,
Gold Vertex EA
Martin Alejandro Bamonte
Gold Vertex EA is a reliable and stable option for those looking to automate their trading in the gold market. With a robust system based on one of the most effective indicators and a solid trend-following strategy, Gold Vertex EA is a powerful tool for traders who want precise, worry-free trading. Requirements Platform : MetaTrader 4 Supported Instruments : Specifically developed and configured for Gold (XAUUSD) Recommended Account Type : ECN or low spread Minimum Deposit Recommended : $100 Tim
Inferno Signals EA
Martin Alejandro Bamonte
Inferno Signals EA , piyasanın önemli hareketlerinden yararlanmak üzere tasarlanmıştır ve sağlam M30 zaman diliminde çalışmaktadır. Bu EA, düşük bir başlangıç sermayesi ile başlamak isteyenler için idealdir ve çift başına sadece 100 $'dan başlayan, otomatik sermaye yönetimi, dinamik lot ayarlamaları ve Stop-Loss (SL) gibi güvenlik seviyelerini içermektedir. Düşük bir drawdown ve en iyi fırsatları yakalamaya odaklanan bir strateji ile Inferno Signals EA, yatırımınızın güvenliğini riske atmadan ge
MarketPrice Indicator
Martin Alejandro Bamonte
The MarketPrice Indicator is designed to provide a quick, one-glance visualization of the trend direction for a currency pair across all time frames (Time Frames), streamlining decision-making. MarketPrice Indicator is based on daily levels and trading signals derived from moving average crossovers and market strength according to various technical indicators. It comes fully configured, though you can, of course, modify any parameters as desired. Indicator Logic The indicator uses a combination
Last 50 Pips
Martin Alejandro Bamonte
Last 50 Pips göstergesi, son fiyat hareketlerine dayalı olarak alım ve satım fırsatlarını hızlı bir şekilde belirlemek için tasarlanmıştır. Son mumlardaki fiyat değişimini ölçer ve fiyatın yön değiştirebileceği anları sarı renkle vurgular. Alım sinyali: Gösterge KIRMIZI dan SARI ya değiştiğinde ALIM pozisyonu açmalısınız, bu da düşüş trendinden yükseliş trendine geçişi önerir. Ne kadar kolay olduğunu görmek için lütfen resimlere bakın. Satış sinyali: Gösterge YEŞİL den SARI ya değiştiğinde SAT
FlashPoints Breakout
Martin Alejandro Bamonte
Her gün piyasanın başında, Flashpoints Breakout pivot, destek ve direnç seviyelerini önceki günün verilerini (yüksek, düşük ve kapanış) kullanarak inceleyerek iki kırılma seviyesi (boğa ve ayı) hesaplar. Bu şekilde, sabah ilk iş olarak yeni giriş seviyelerine ek olarak Take Profit (TP) ve Stop Loss (SL) değerlerine sahip olursunuz, böylece ek hesaplama yapmadan Buy Stop veya Sell Stop bekleyen emirleri verebilirsiniz. Flashpoints Breakout ile her gün, beklenen kırılma seviyelerine göre 1 veya 2
Buy Sell Magic Signal
Martin Alejandro Bamonte
BUYSELLMAGIC is a non-repainting signal-type trading indicator designed to precisely detect entry points in the market.  Features Reliable and permanent signals : BUYSELLMAGIC signals are final once the candle closes, ensuring they will not be modified or removed from the chart. This gives you the confidence of working with an indicator that keeps its signals stable and trustworthy. Comprehensive alerts : In addition to signals on the chart, you’ll receive notifications via email, pop-up alerts
Automatic Fibonacci Pivots automatically calculates pivot levels and support/resistance based on Fibonacci, clearly showing key reference points that indicate potential reversal or trend continuation zones, as well as buy and sell areas . Designed for traders seeking clarity on charts without having to recalculate and manually place Fibonacci levels each time. Once set up on your computer, it will send an alert to your phone when a potential buy/sell signal is issued, allowing you to trade direc
M1 Easy Scalper
Martin Alejandro Bamonte
4 (3)
M1 EASY SCALPER is a scalping indicator specifically designed for the 1-minute (M1) timeframe, compatible with any currency pair or instrument available on your MT4 terminal. Of course, it can also be used on any other timeframe, but it works exceptionally well on M1 (which is challenging!) for scalping. Note: if you're going to scalp, make sure you have an account suitable for it. Do not use Cent or Standard accounts as they have too much spread! (use ECN, RAW, or Zero Spread accounts) Robustn
Trade Insights Display
Martin Alejandro Bamonte
Trade Insights Display is the ideal companion for traders who want to operate with clarity and precision. This indicator provides real-time access to critical account data, such as: Balance Equity Margin Spread Swap Remaining time for the current candle . These data points are essential, regardless of the strategy or other indicators you use. Having this indicator always visible allows you to quickly assess your account status, the swap for each pair (helping you avoid high-cost trades), and the
EuroGeddon EA
Martin Alejandro Bamonte
EUROGEDDON EA – Eşsiz Performans ve Kontrollü Risk Yönetimi EUROGEDDON EA , adaptif zeka ile çalışan tamamen otomatik bir ticaret robotudur. Küçük hesapları büyütmek isteyenler için tasarlanmıştır ve hesabınız üzerinde tam kontrol sağlayarak istikrarlı sonuçlar elde etmeyi hedefler. Her 200$ için 0.01 lot ile son derece düşük riskle işlem yapar, bu da düşük bir drawdown ile birlikte gelir. Performansı gerçekten etkileyici ve denemeye değer. Demo sürümünü indir ve kendin test et! Sadece b
ZeroLag TrendCandle — Real-time Candle Coloring & Alerts System (No Repaint) ZeroLag TrendCandle is a real-time trend detection tool that applies non-repainting candle coloring based on an advanced Williams Percent Range (WPR) analysis. It highlights trend shifts, momentum changes, and potential reversals through a dynamic color-coded system— allowing traders to instantly understand current market direction with a clean, intuitive chart, as shown in the images. At a glance, you can clearly ide
Candle Fusion Pro
Martin Alejandro Bamonte
Candle Fusion Pro — Formasyon Tanıma + Trend Filtresi + Momentum Filtresi (Repaint Yok) Güçlü mum formasyonlarını tespit edin ve trend ile momentum analizini canlı olarak yaparak güvenilirliğini doğrulayın. Candle Fusion Pro , fiyat hareketi hassasiyetine , trend yapısına ve çok katmanlı onaylara güvenen traderlar için nihai görsel araçtır. Temel Özellikler Formasyona Dayalı Giriş : 10'dan fazla gelişmiş Japon mum formasyonu algılar: Yıldız kayması (seviye 2, 3, 4) Boğa / Ayı Yutan Mumlar Saba
ClearView Trend Finder
Martin Alejandro Bamonte
ClearView Trend Finder — Ne Kadar Net Olduğunu Görebiliyor Musun? Grafiğin çok mu karmaşık olduğunu hissettin mi? Çok fazla gösterge, çelişkili sinyaller ve sadece analizi zorlaştıran çizgiler mi var? ClearView Trend Finder , bu görsel karmaşayı tamamen ortadan kaldırır ve seni gerçekten önemli olana odaklanmaya davet eder: net trend . Bu sistem, grafiği hiçbir zaman yeniden çizmeyen veya değiştirmeyen temiz ve net bir görünüme dönüştürür. Her mum çubuğu, yalnızca piyasanın baskın yönünü göste
Ai FGS EA
Martin Alejandro Bamonte
1 (1)
This EA is a private edition developed for traders who are part of our advanced testing and support program. It offers early access to selected configurations and system updates that will later be integrated into the main public release. Only users who have previously communicated with our team and received confirmation should proceed with the purchase. The EA operates using our latest optimization logic and is intended for professional traders who understand the importance of running control
Filtrele:
İnceleme yok
İncelemeye yanıt