Hit Rate Top Bottom Signal

Hit Rate Top Bottom Signal

Hit Rate Top Bottom Signal

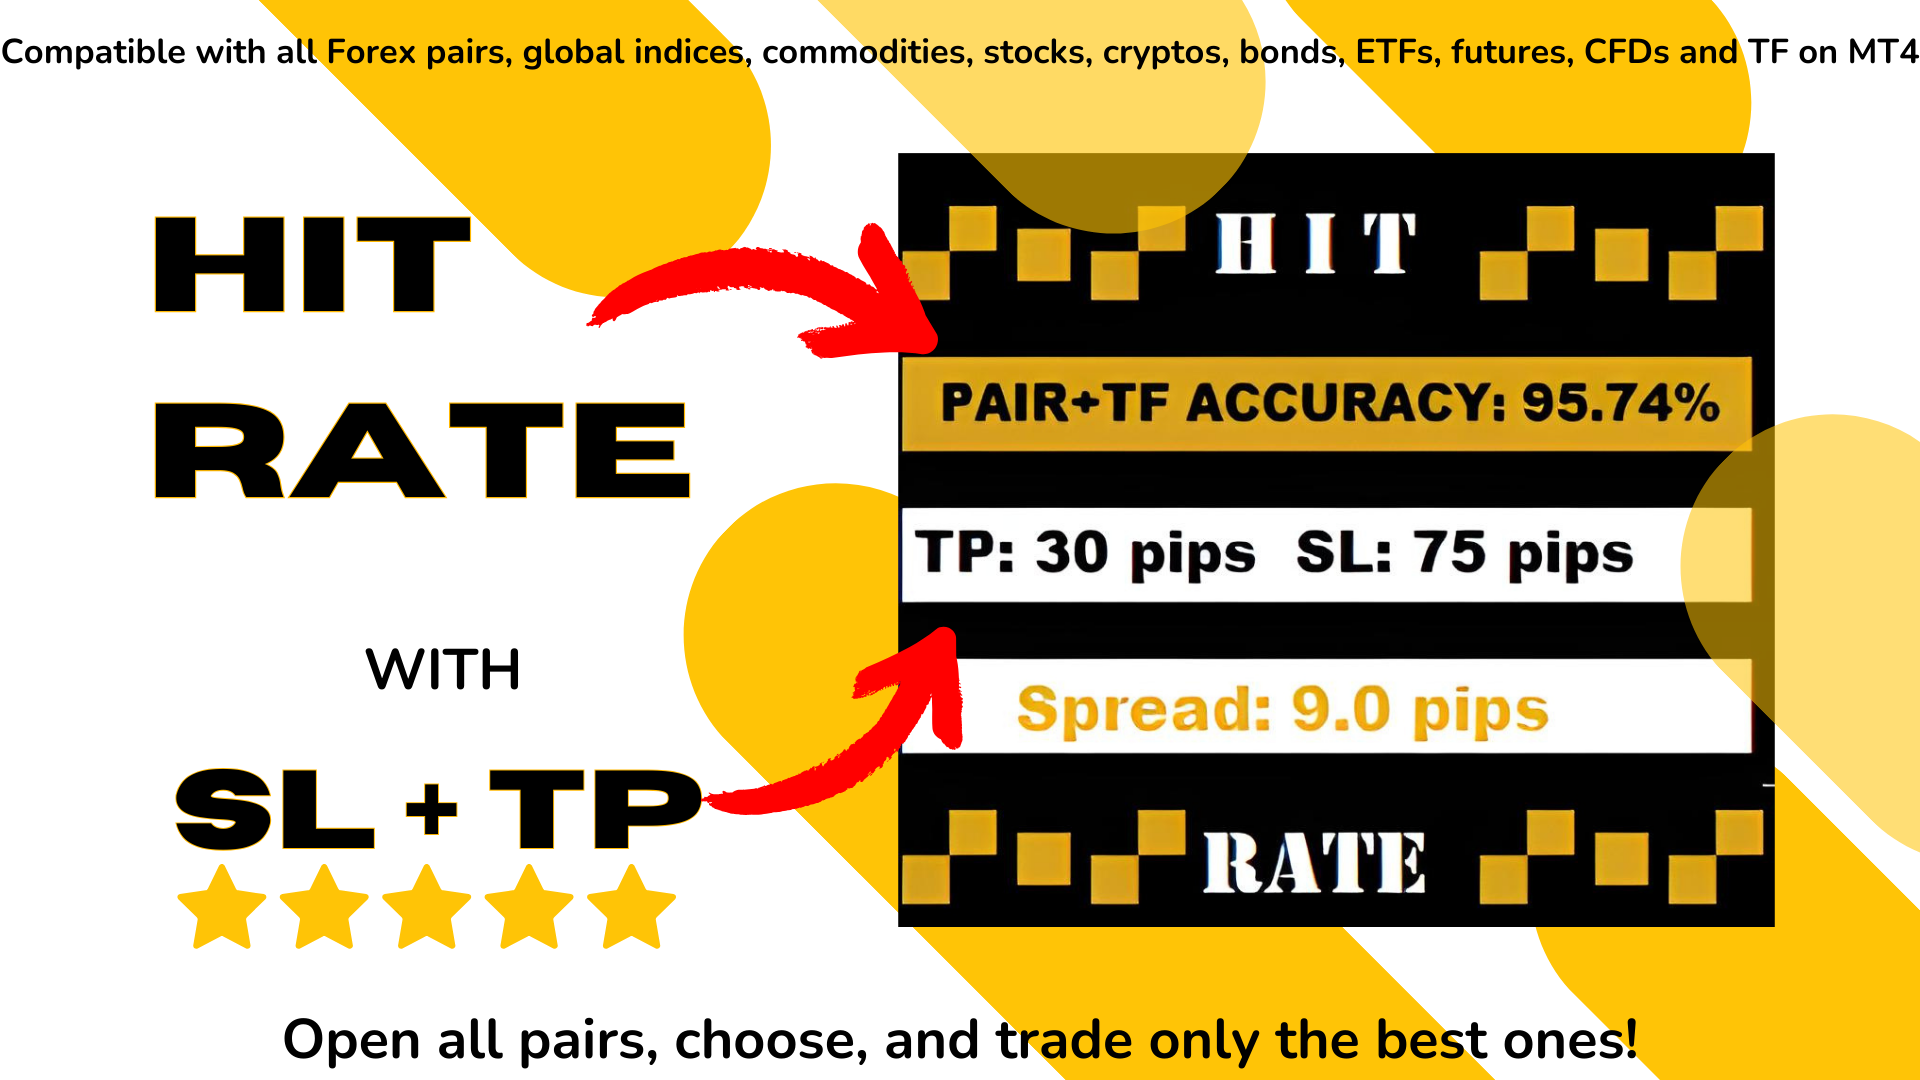
Hit Rate Top Bottom Signal oferece uma abordagem completamente inovadora. É ideal para aqueles que desejam avaliar previamente como o sinal funciona com um TP-SL específico e em quais PARES/TFs ele apresenta melhor desempenho.

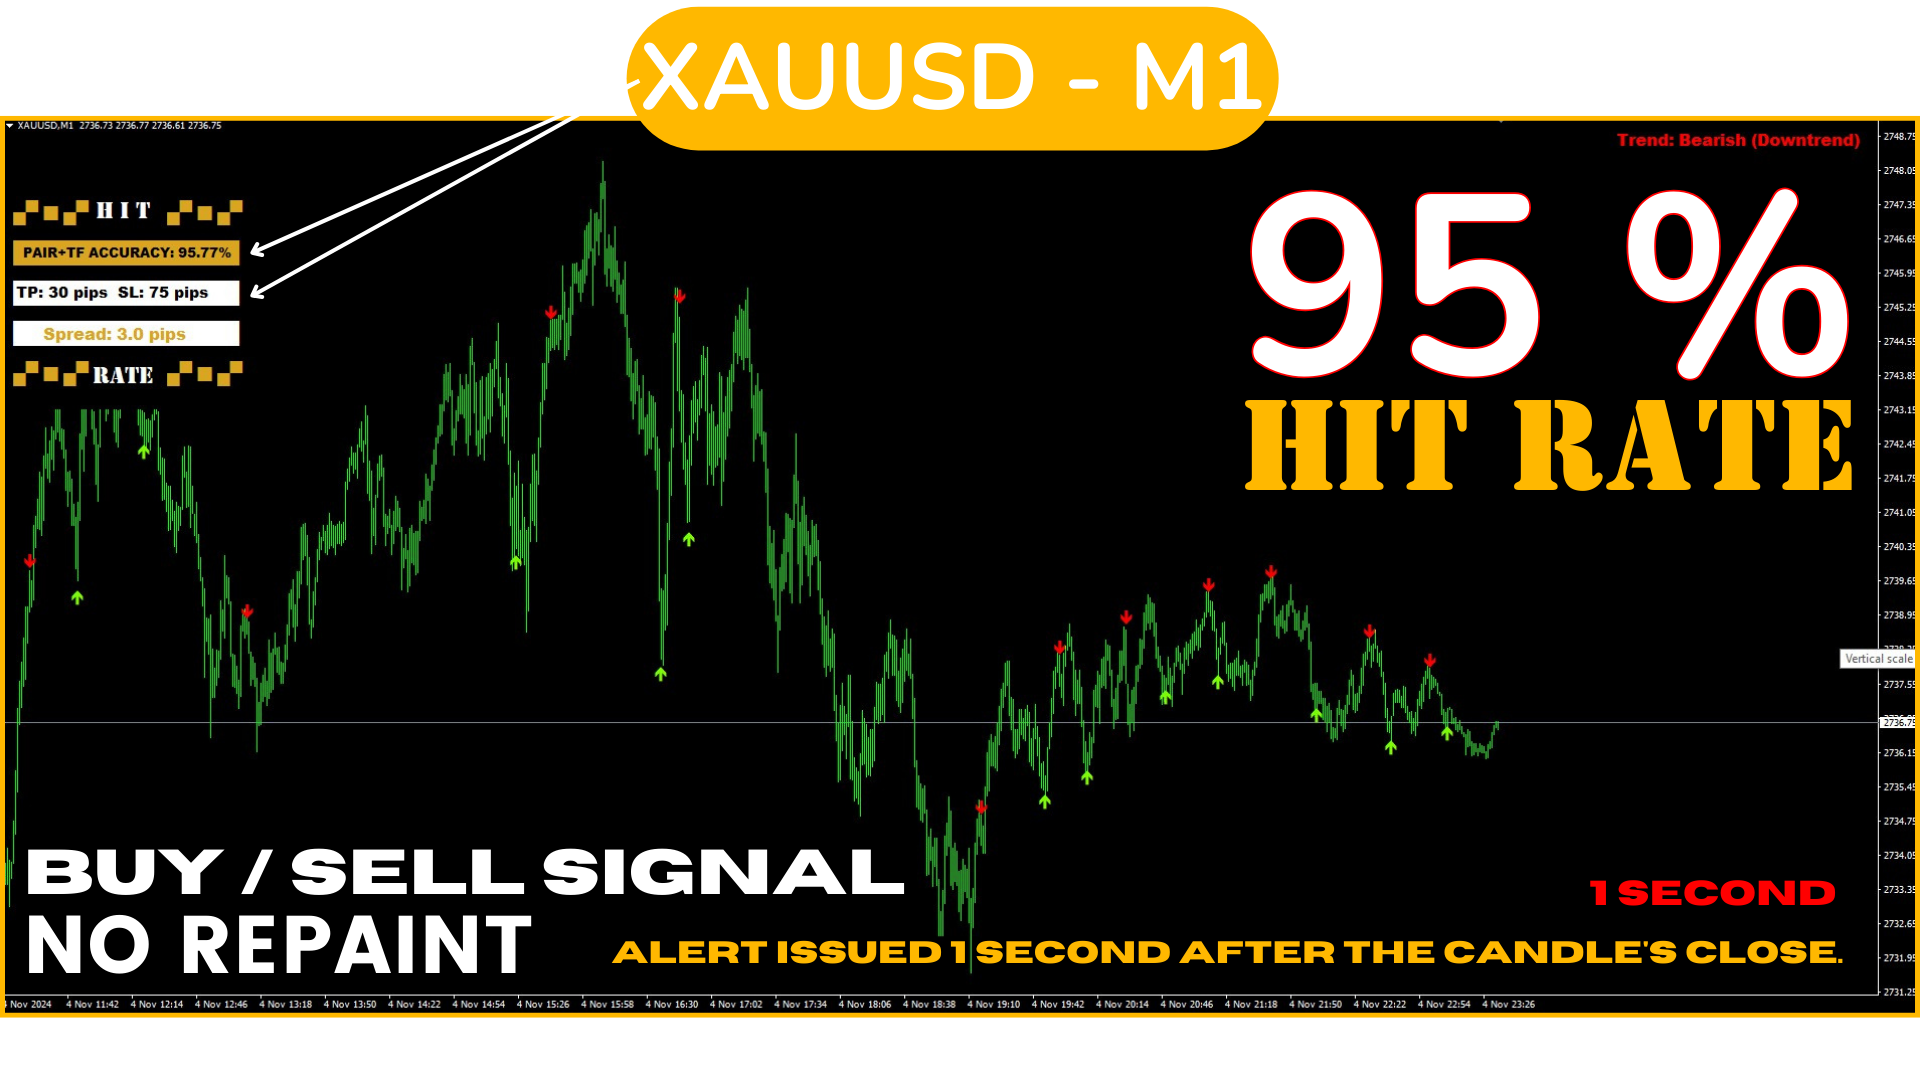
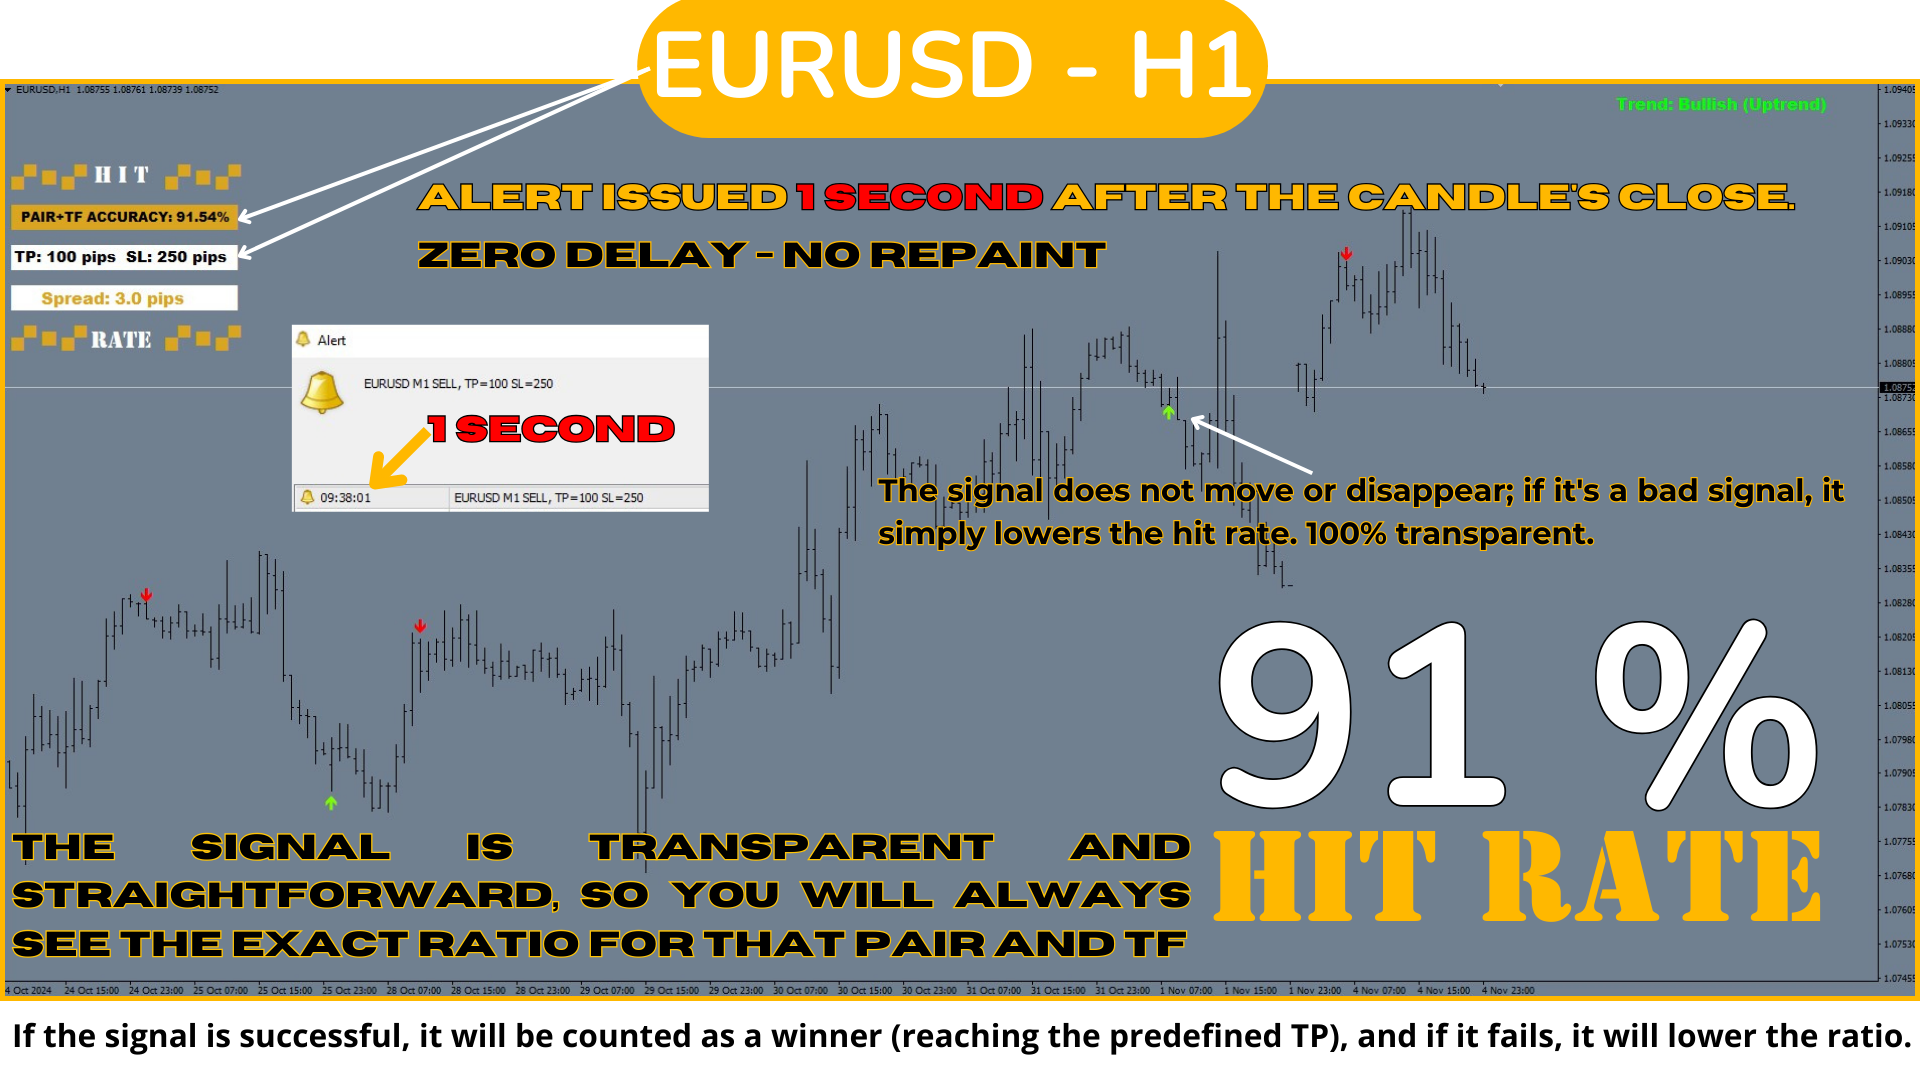
A estratégia Hit Rate Top Bottom Signal é uma ferramenta fundamental para qualquer trader e qualquer tipo de trading porque não só emite sinais precisos e sem repaint, indicando claramente quando operar e em qual direção, mas também mantém um registro detalhado da taxa de acerto para cada Par e TF, com um Take Profit (TP) e Stop Loss (SL) predefinidos. Isso permite conhecer antecipadamente a taxa de eficácia do sinal, o que é essencial para uma boa gestão de risco e para operar com máxima precisão.

Essa estratégia se destaca por focar na detecção de pontos de reversão em impulsos, ao invés de movimentos completos, o que faz com que os sinais emitidos sejam mais frequentes que o tradicional Top-Bottom, concentrando-se em
momentos-chave dentro de cada oscilação importante do mercado.


Essa capacidade de exibir, em porcentagem, a eficácia histórica do sinal em combinação com uma proporção SL/TP definida, faz dessa estratégia a melhor opção para operar com segurança, permitindo que o trader tome decisões baseadas em dados. Ao confiar em um sinal que não só é claro e direto, mas também possui um histórico comprovado, estamos diante de uma das melhores estratégias disponíveis.


Como operar com este sistema?

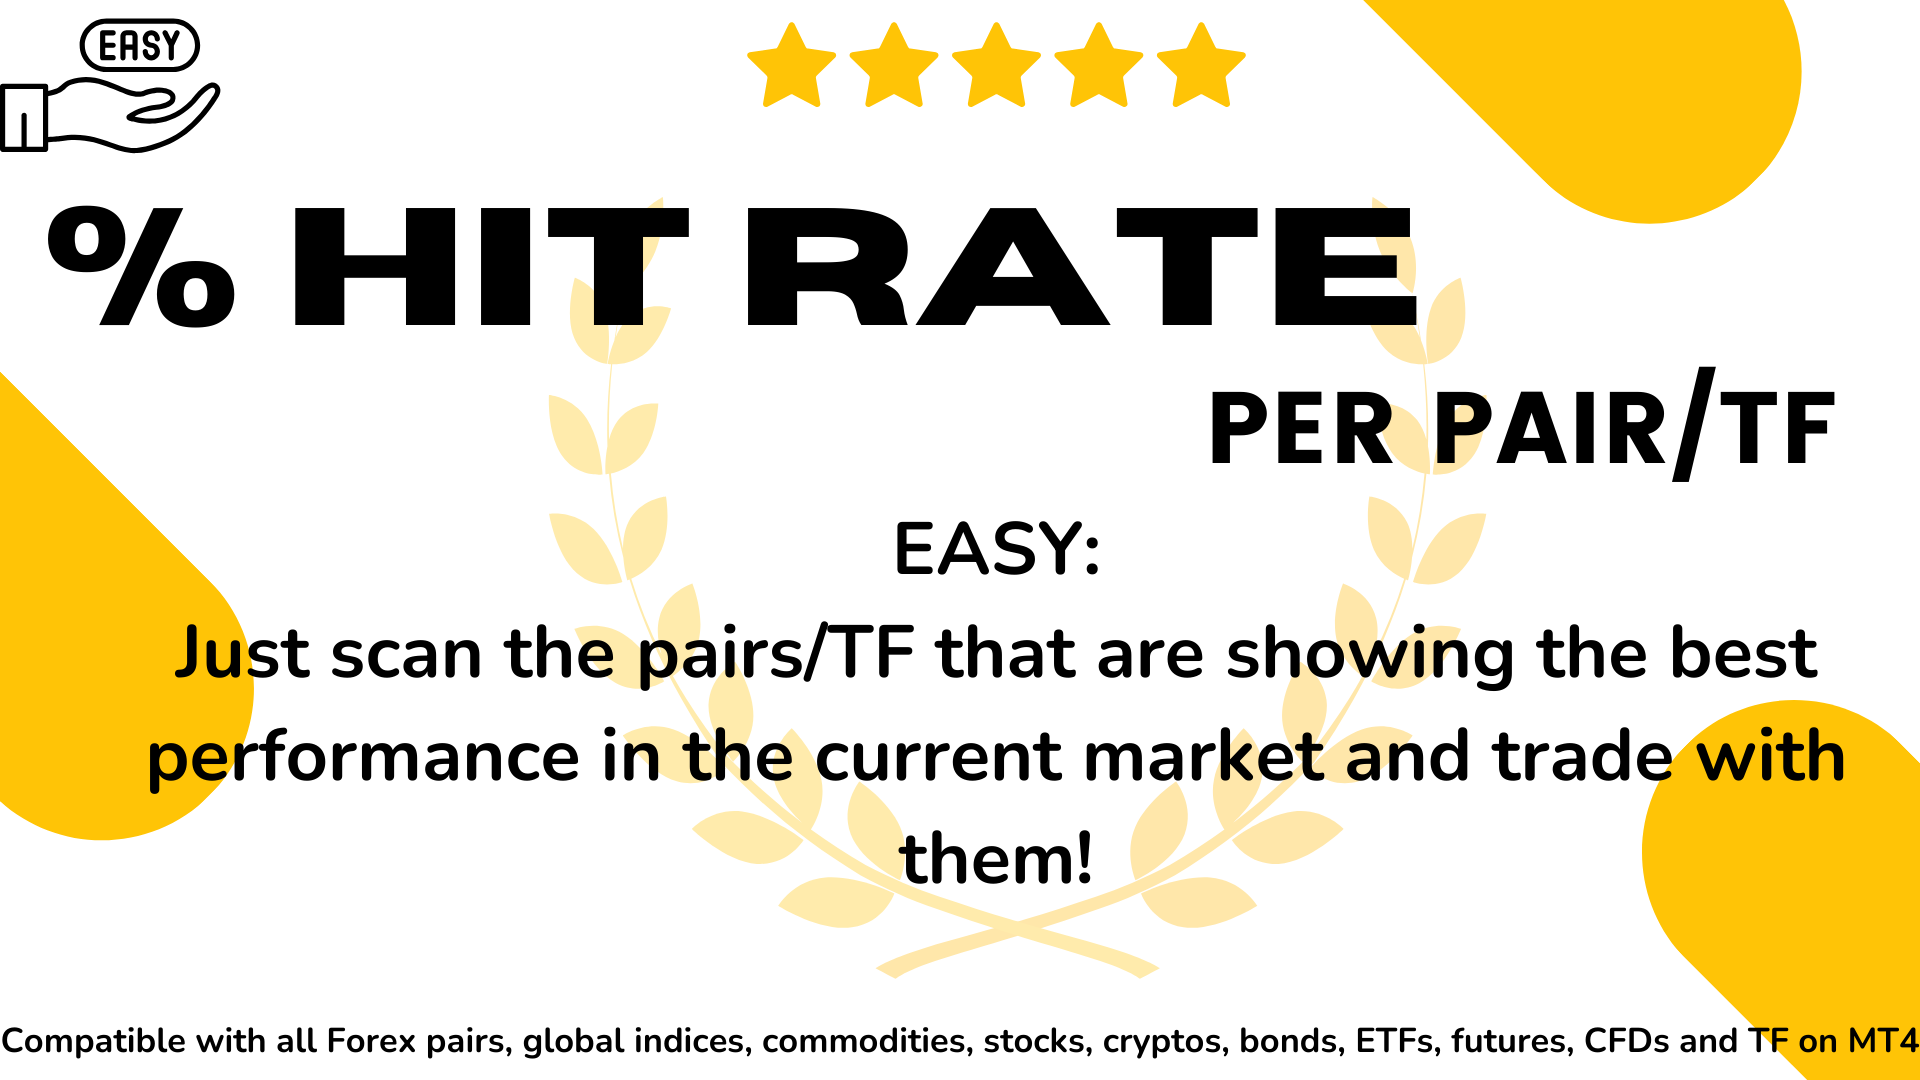
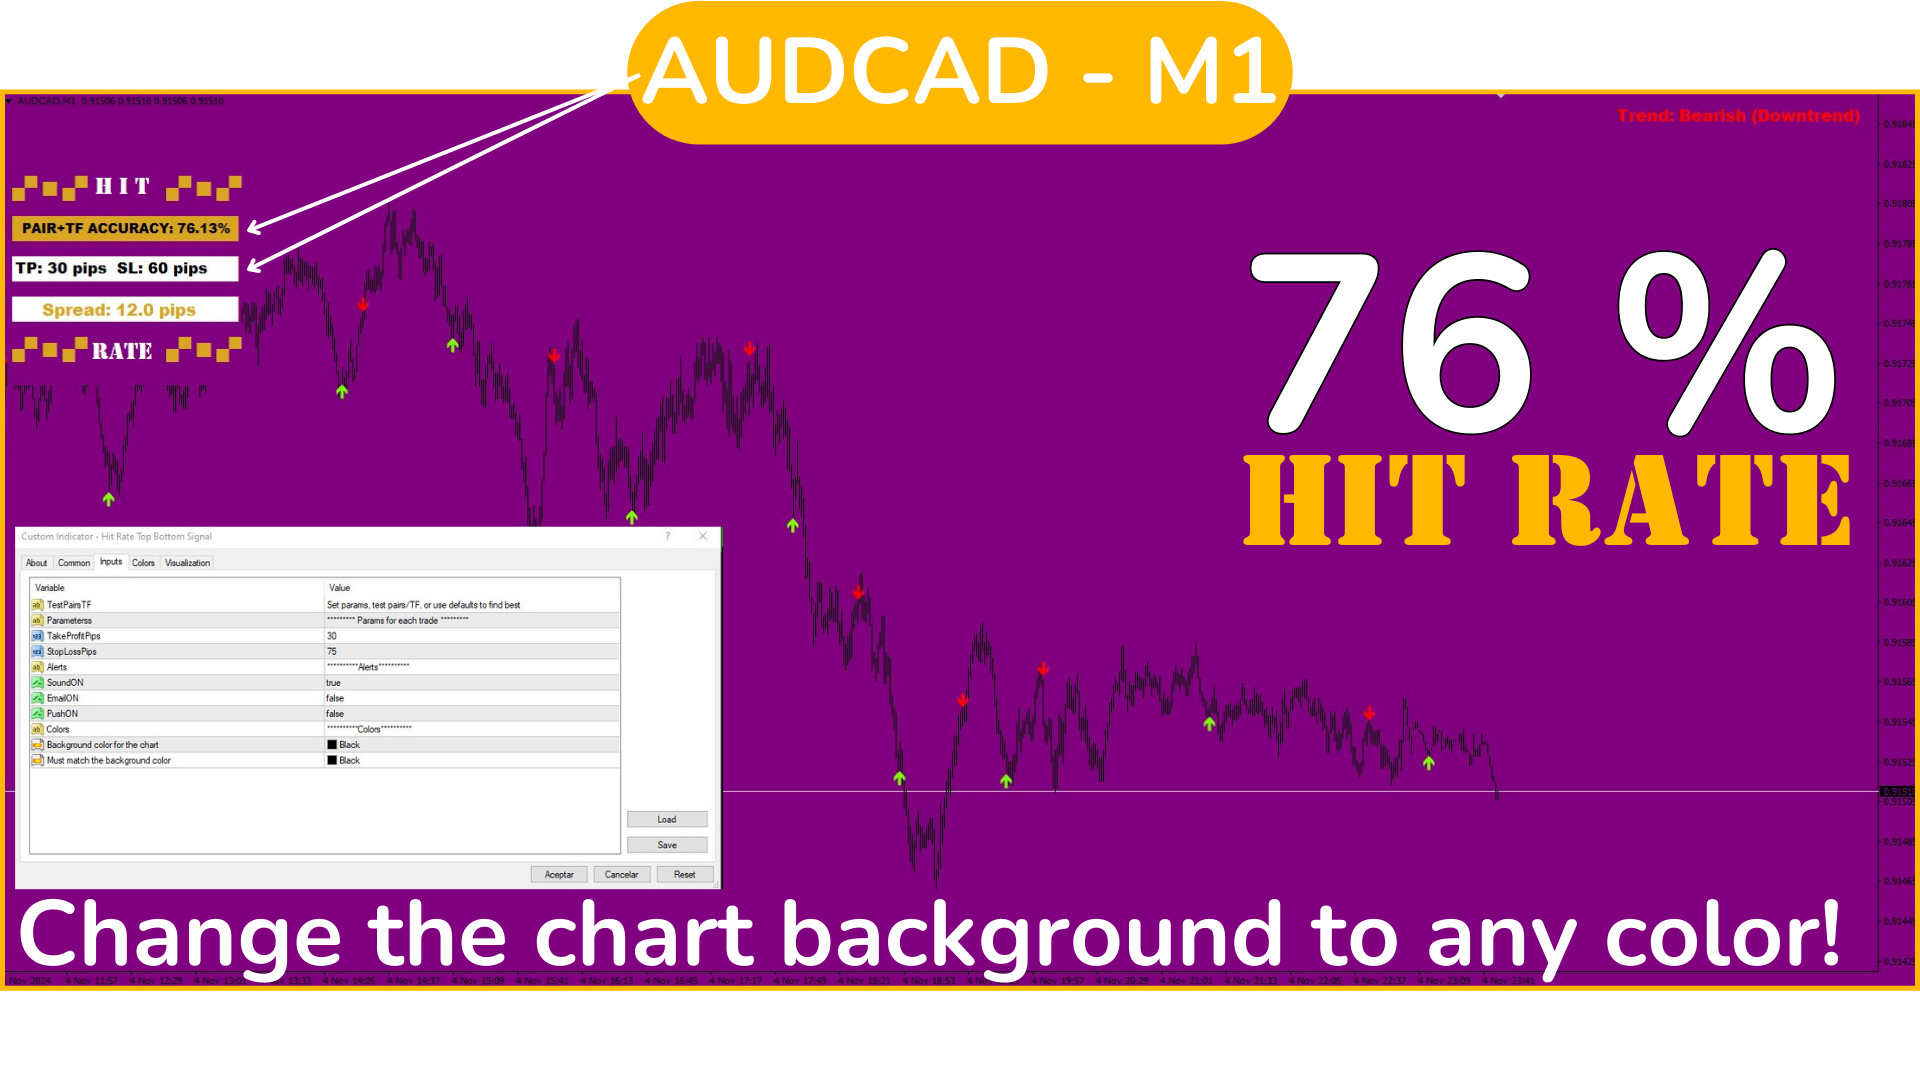
Abra vários pares e carregue o indicador em cada um deles. Agora, analise cada par para identificar em quais e em quais TFs (temporalidades) o sinal está funcionando melhor, e concentre-se neles. (VEJA AS IMAGENS)

O sinal, por padrão, tem um TP de 100 pips e um SL de 250 pips, mas você pode definir os valores que deseja operar ou deixar os valores padrão.

Tenha em mente que um SL de 250 pips em H1 não é o mesmo que em M1, mas não se preocupe: ao atualizar manualmente os parâmetros de SL e TP, a taxa de acerto do sinal para esses novos parâmetros será recalculada, permitindo que você conheça antecipadamente os resultados esperados com esses parâmetros.

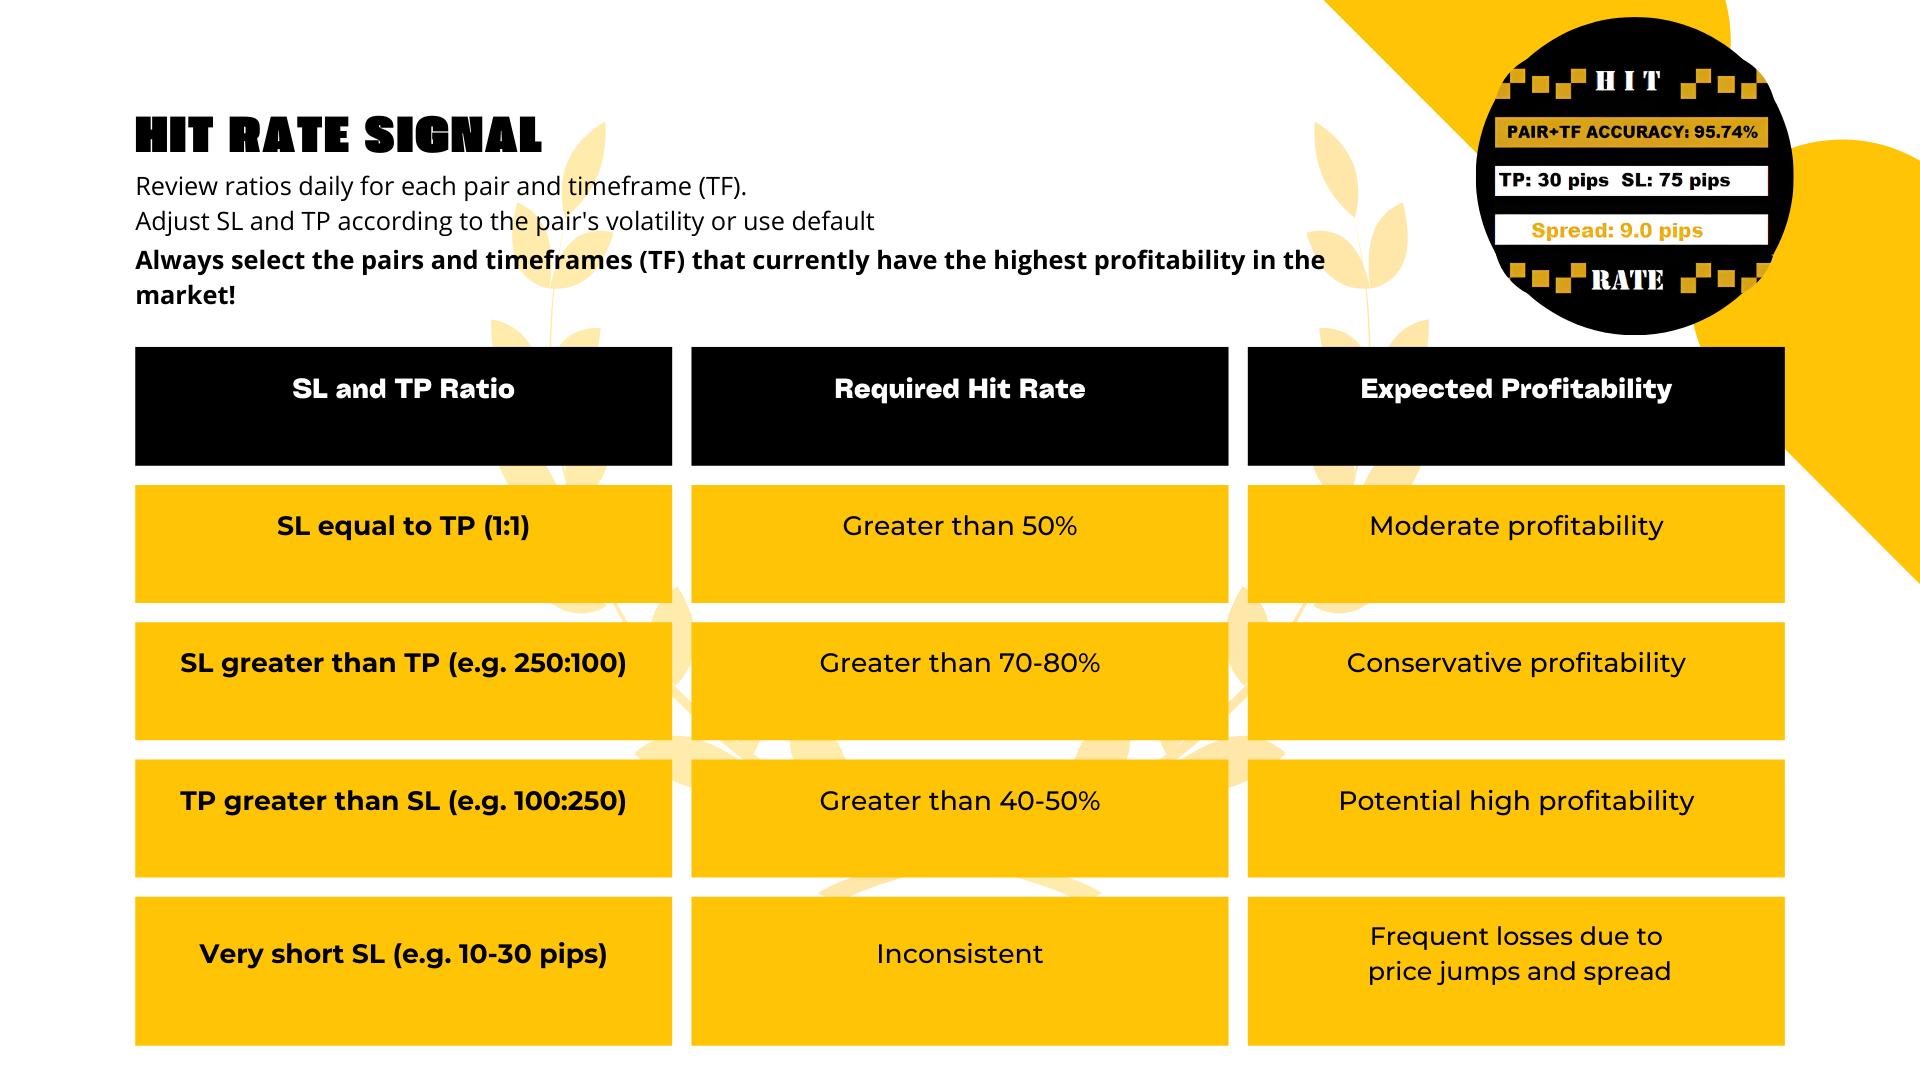
Dessa forma, você pode ajustar os parâmetros específicos de cada par para "otimizar" a estratégia nesse par e TF, e assim conhecer a taxa de acerto do sinal nesse contexto. Recomenda-se realizar esse processo uma vez por dia, sempre antes de operar, para identificar os pares/TFs com maior eficácia no momento atual. Os parâmetros padrão funcionam melhor em TFs como M30 ou H1, dependendo do par.

Passo a passo:

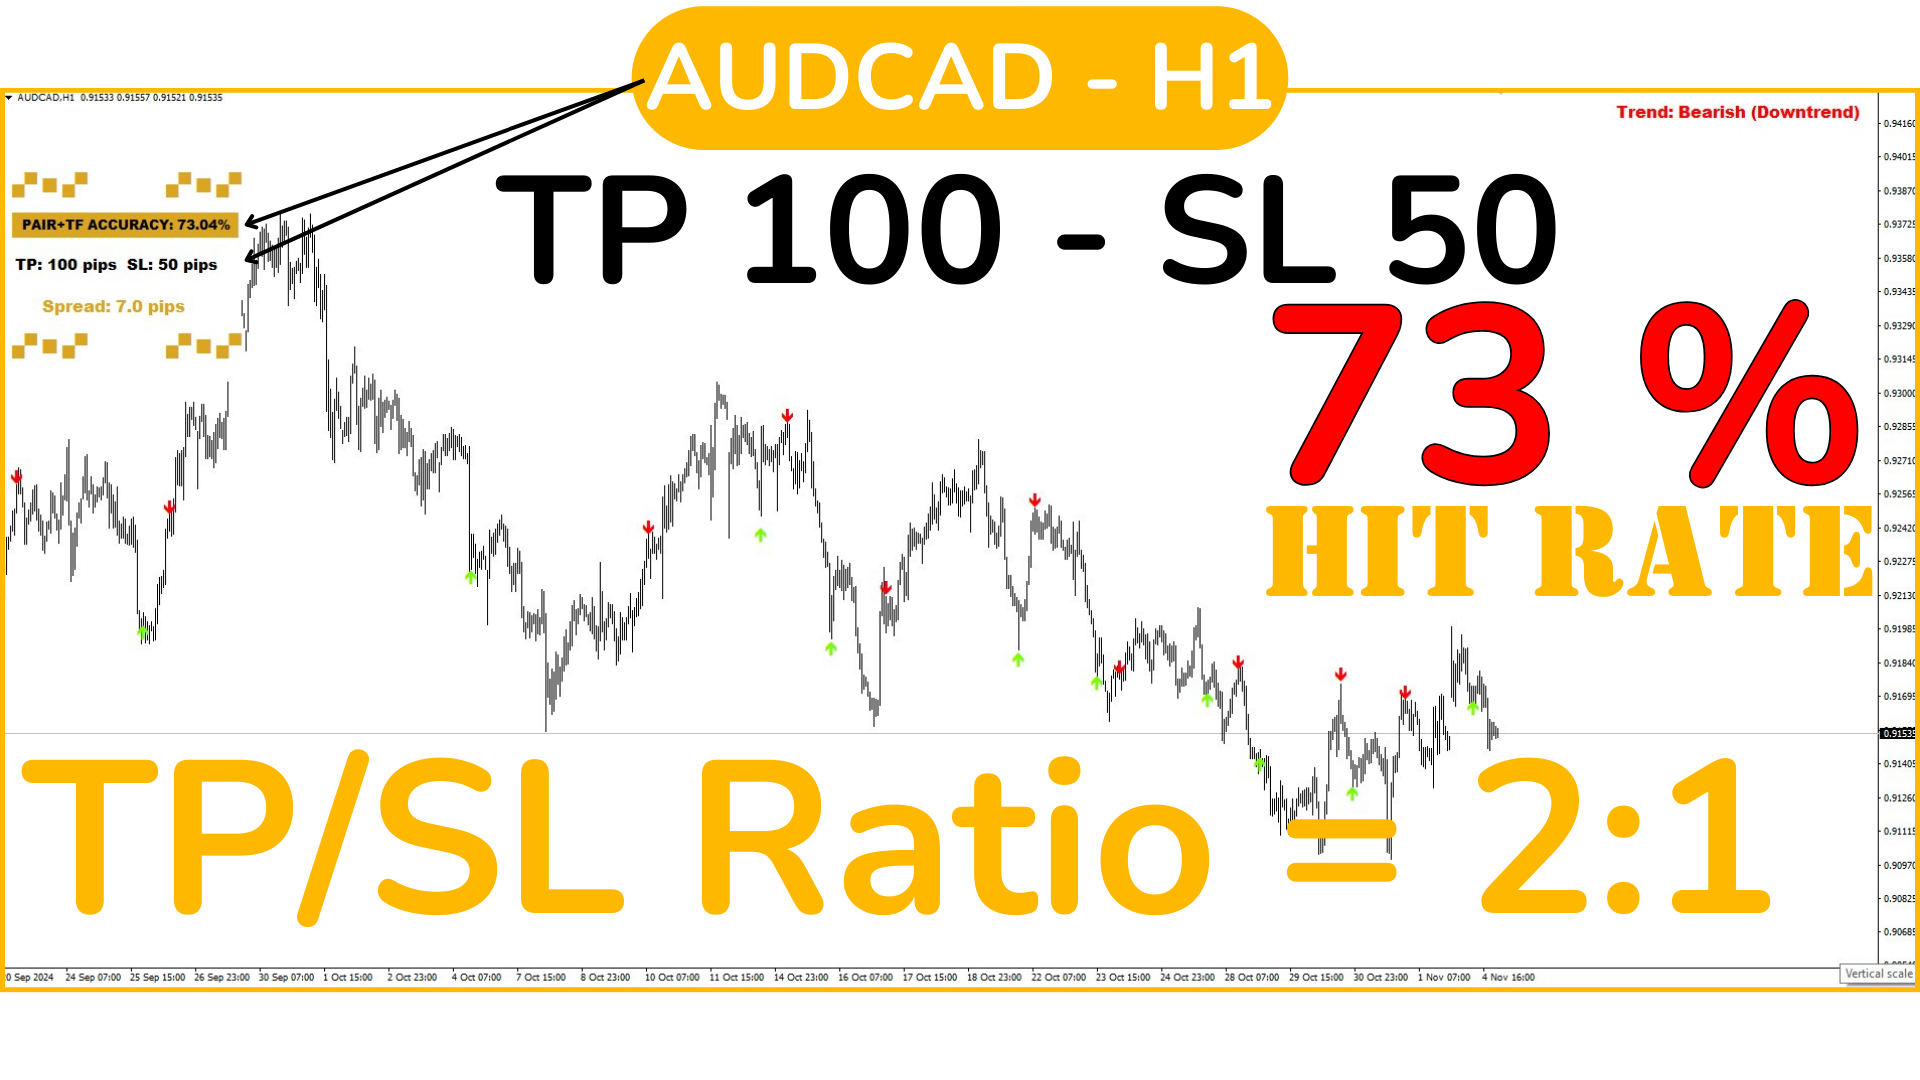
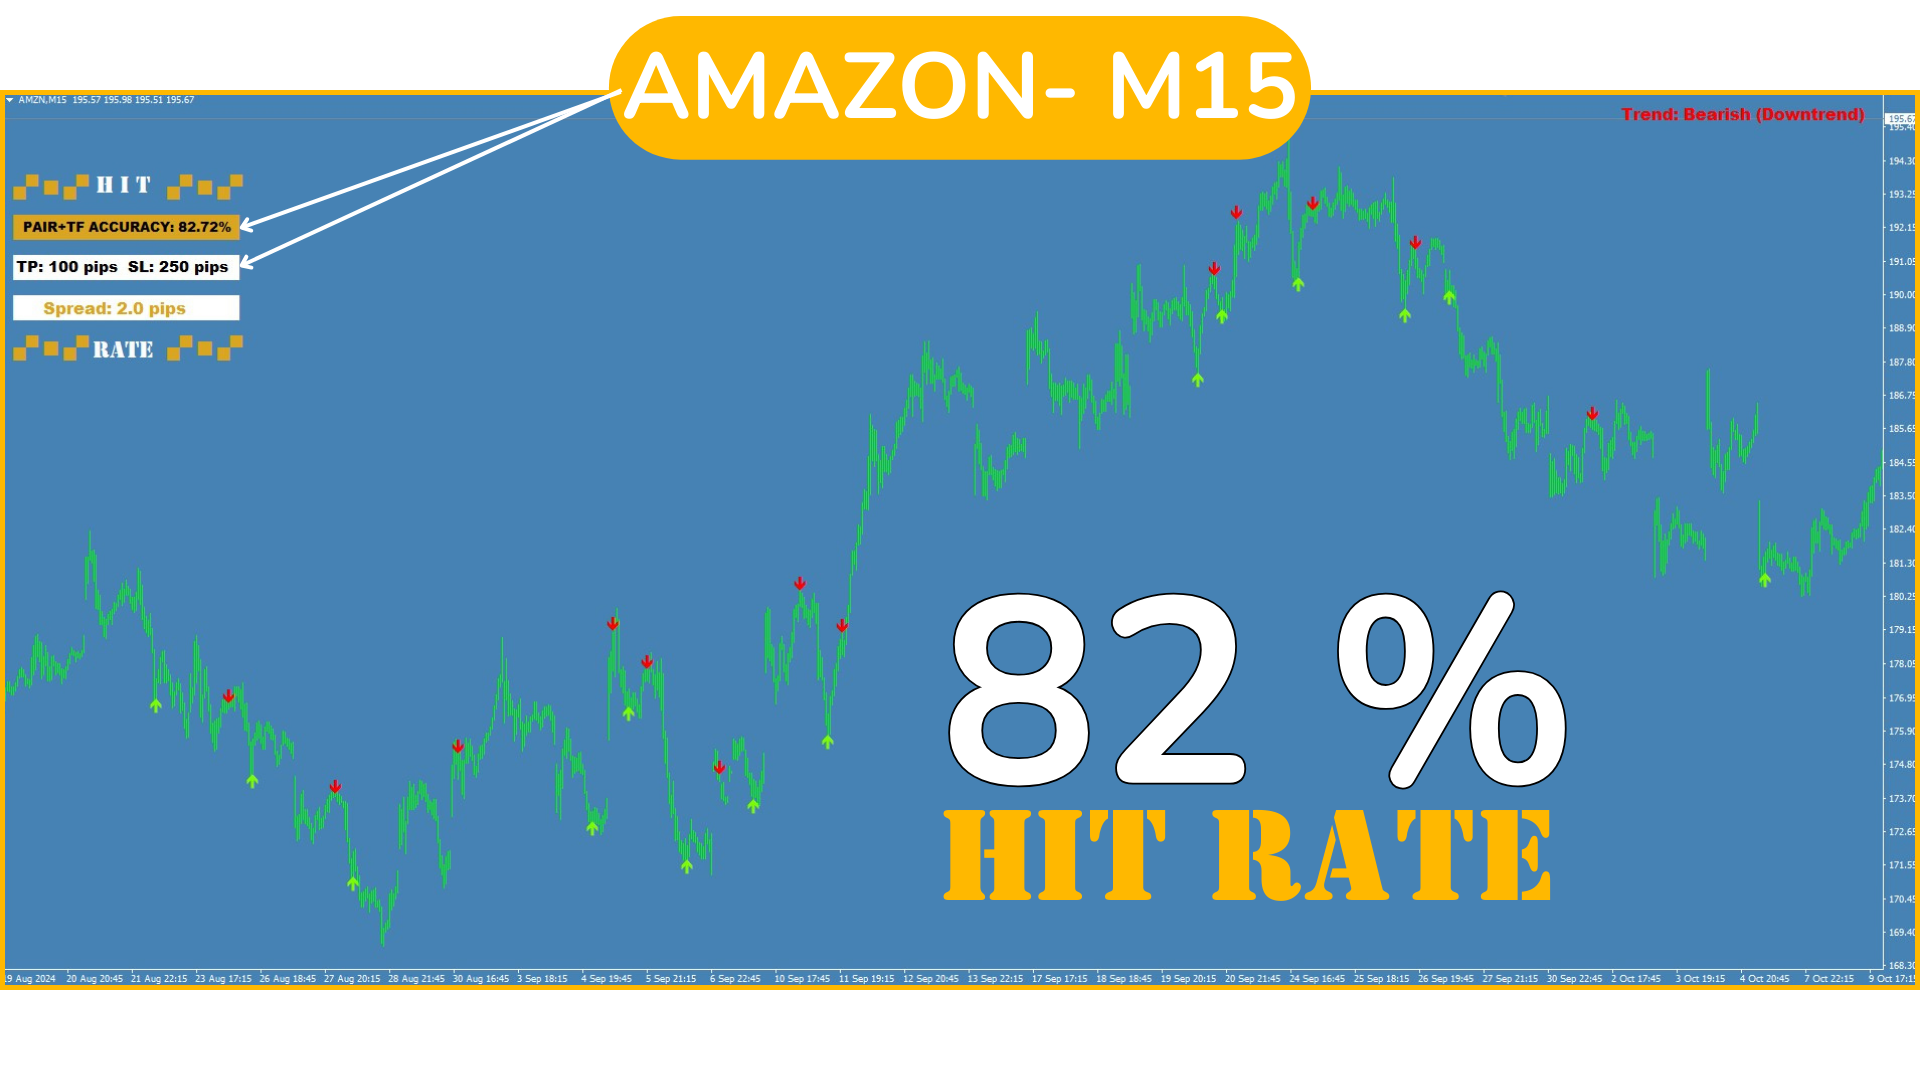
  1. Escolha um par e revise cada TF. Verifique em qual deles a taxa de acerto é mais alta, por exemplo, acima de 85-90% (se estiver usando a configuração padrão de TP e SL). Selecione esse TF. Para entender qual proporção é ideal para sua estratégia, caso não use o TP e SL padrão, leia abaixo "Proporções entre SL/TP e a Taxa de Acerto".

  2. Repita o procedimento com todos os pares disponíveis; quanto mais tiver abertos, maiores serão as oportunidades de trading.

  3. Agora, apenas aguarde os sinais e abra as operações assim que um sinal for emitido, respeitando o SL e TP pré-estabelecidos.

  4. Se você deseja escolher o TP e SL com os quais deseja operar, primeiro deve modificar os dados na aba "Inputs" e definir os valores para cada par, sempre em Pips. Depois, vá observando cada TF desse par, escolha o que funciona melhor e mantenha-se atento aos sinais.

Operando pelo telefone com liberdade:

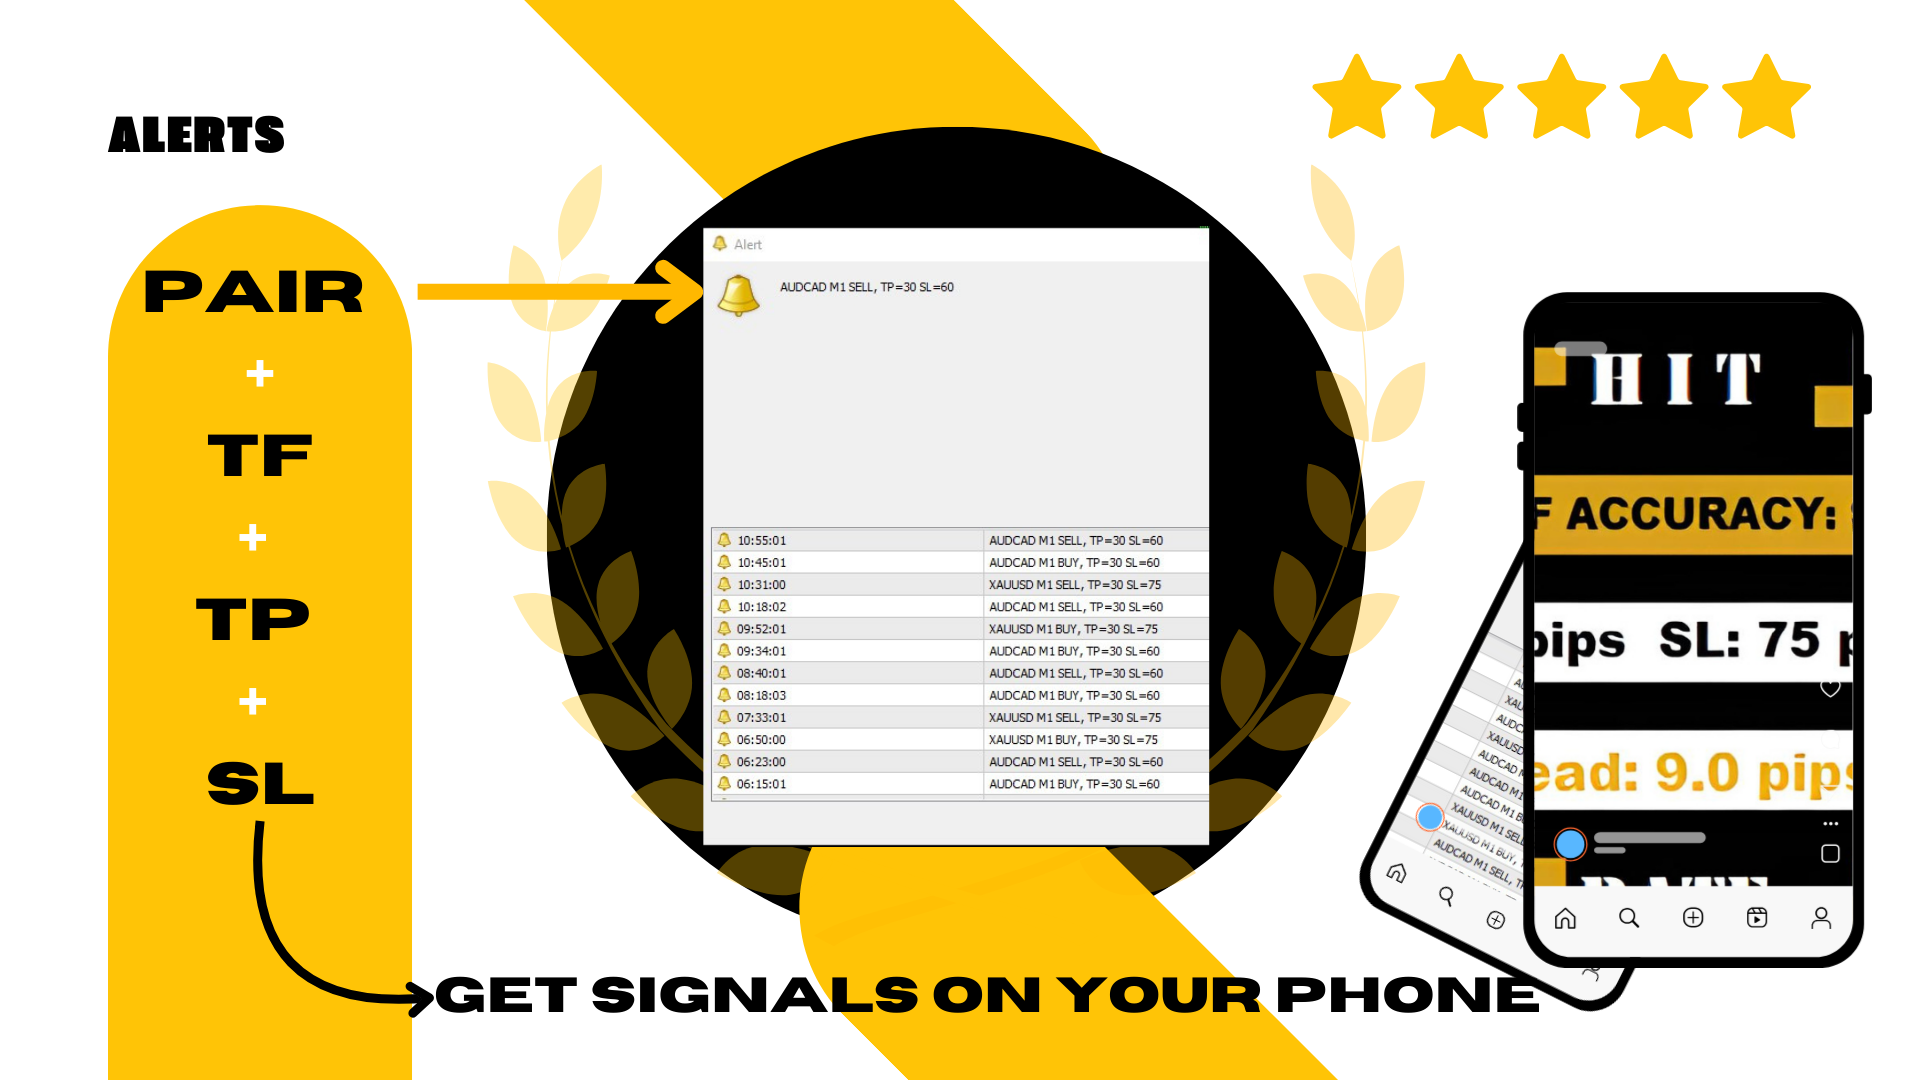
Esse processo de "Passo a Passo" deve ser configurado no computador, mas você poderá receber as notificações das operações em seu telefone. Como? Certifique-se de ter configurado seu telefone para receber mensagens push no terminal MT4 e permitir as notificações no terminal em seu telefone.

Quando um sinal for emitido, você receberá em seu telefone: PAR - TF - TIPO DE SINAL (COMPRA/VENDA) - e os valores de TP e SL previamente configurados para esse par.


Dessa forma, não será necessário estar constantemente na frente do computador, pois você poderá abrir operações pelo telefone, definir o SL e TP desse par, e desconsiderar o acompanhamento constante.

No entanto, para aqueles que preferem operar no computador, o sinal sonoro e visual com os mesmos dados (PAR - TF - TIPO DE SINAL e valores de TP e SL) aparecerá na tela sempre que um sinal for emitido em um par.


Entendendo as Proporções entre SL/TP e a Taxa de Acerto

O sucesso de uma estratégia de trading depende de dois fatores-chave: de um lado a proporção entre o Stop Loss (SL) e o Take Profit (TP), e do outro a taxa de acerto do sinal. Cada um desempenha um papel fundamental na lucratividade da estratégia, e entender como eles funcionam juntos é essencial para otimizar o sistema.

1. Proporção SL/TP:

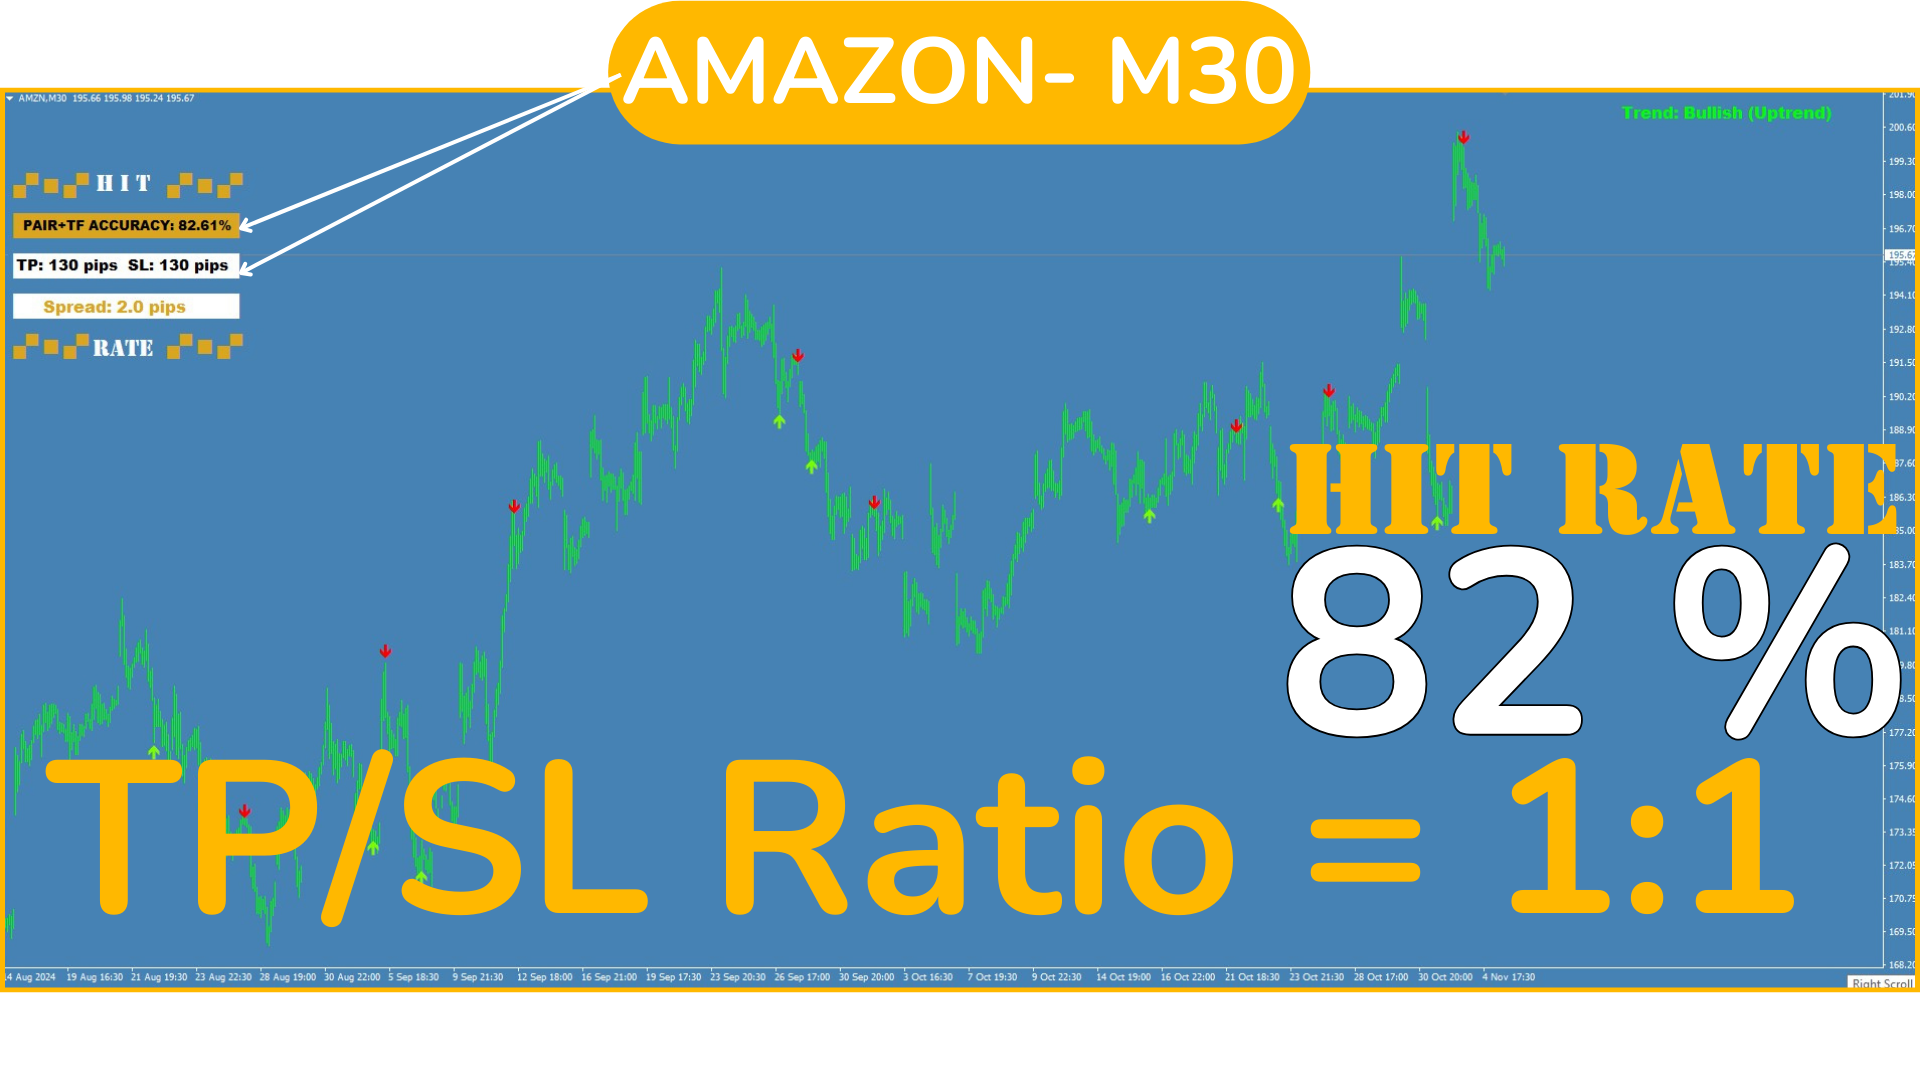
  • Proporção SL/TP de 1:1: O tamanho do TP é igual ao do SL (por exemplo, SL: 100 pips e TP: 100 pips). Nesse caso, a estratégia precisa de uma taxa de acerto superior a 50% para ser lucrativa, pois os ganhos e perdas serão semelhantes.
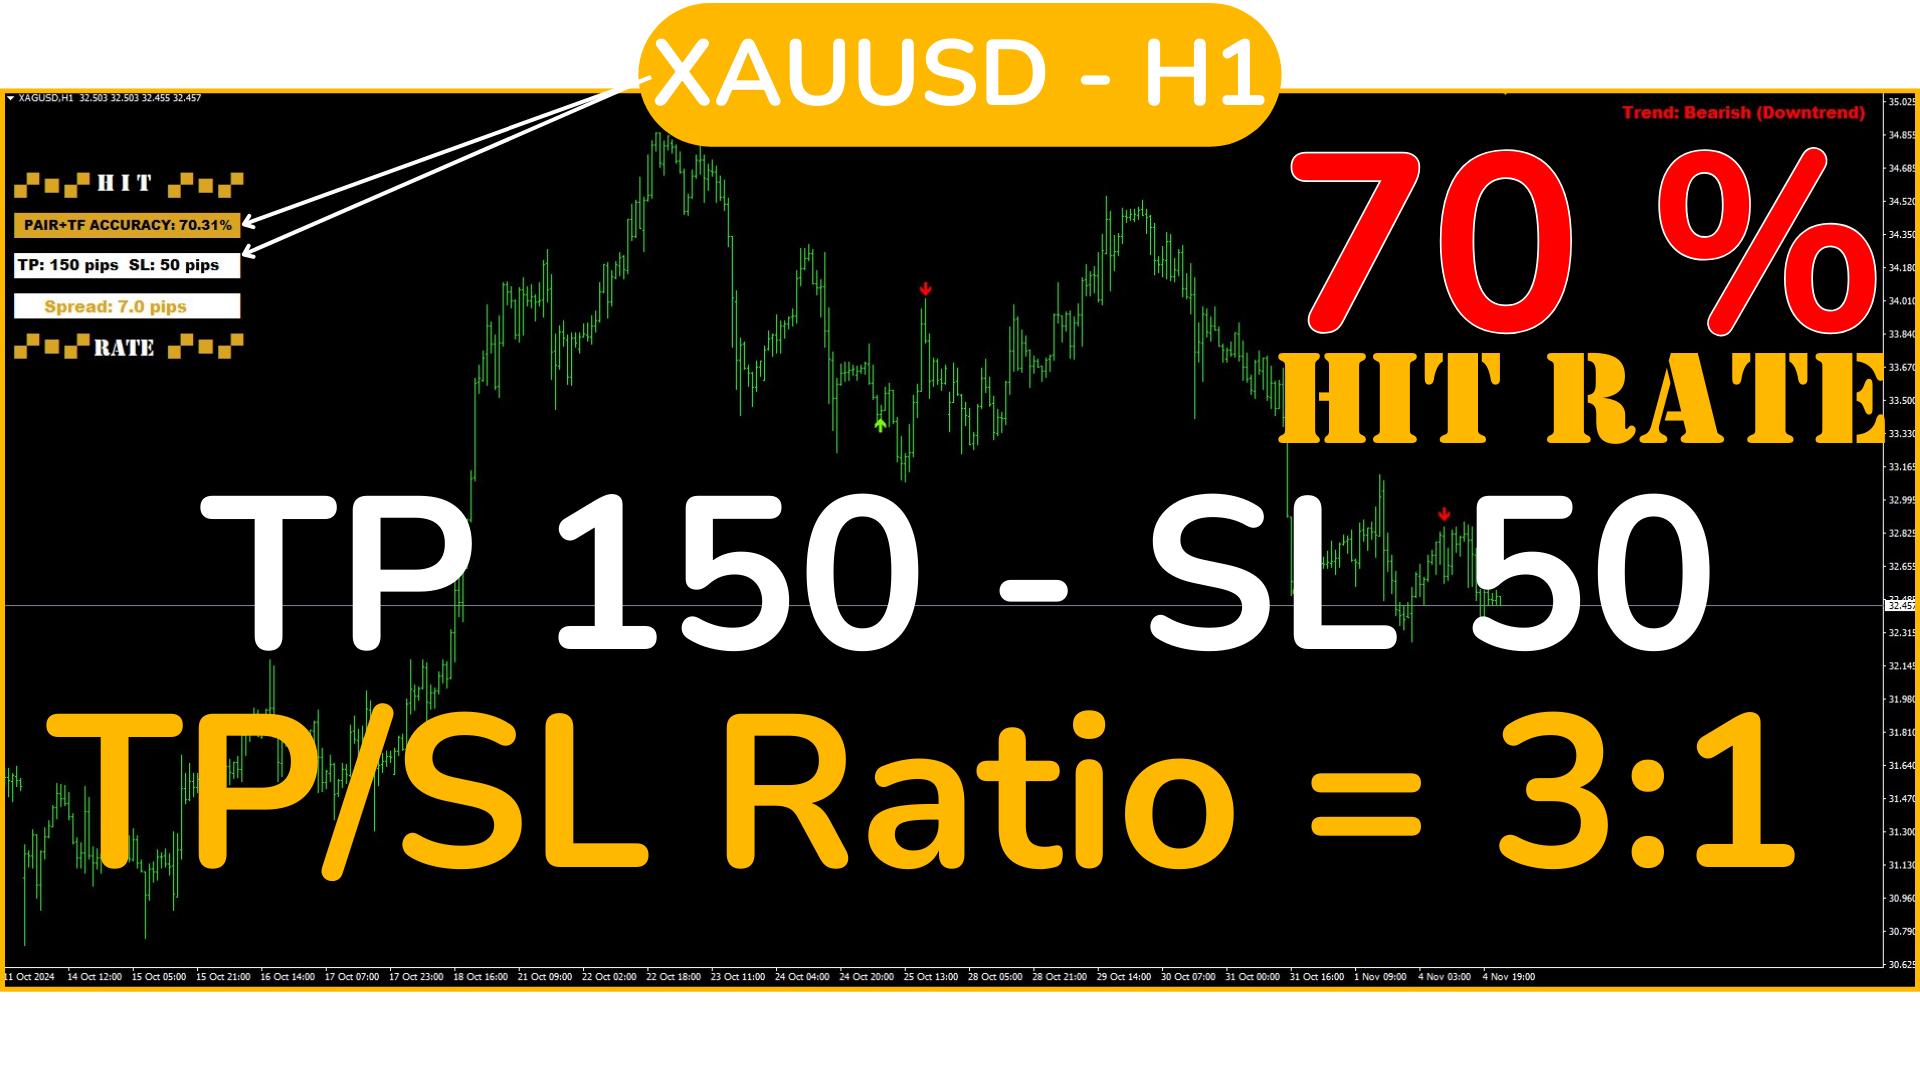
  • SL maior que o TP: (por exemplo, SL: 250 pips e TP: 100 pips), você precisa de uma taxa de acerto muito mais alta para compensar as perdas quando o SL é atingido. Nesse caso, uma taxa de acerto superior a 70% ou 80% é ideal.
  • TP maior que o SL: (por exemplo, TP: 250 pips e SL: 100 pips), a estratégia pode ser lucrativa mesmo com uma taxa de acerto mais baixa, pois cada ganho cobriria várias perdas. Aqui, uma taxa de acerto de 40-50% seria suficiente para gerar lucros.

Em todos os casos!! Tenha sempre em mente que, se um SL for muito "curto", por exemplo, 10-30 pips, ele será provavelmente acionado constantemente (considere o Spread), resultando em perdas constantes em operações que poderiam ser vencedoras. Seja cauteloso e sempre dê espaço suficiente para o preço se movimentar (um SL generoso).

2. Taxa de Acerto:

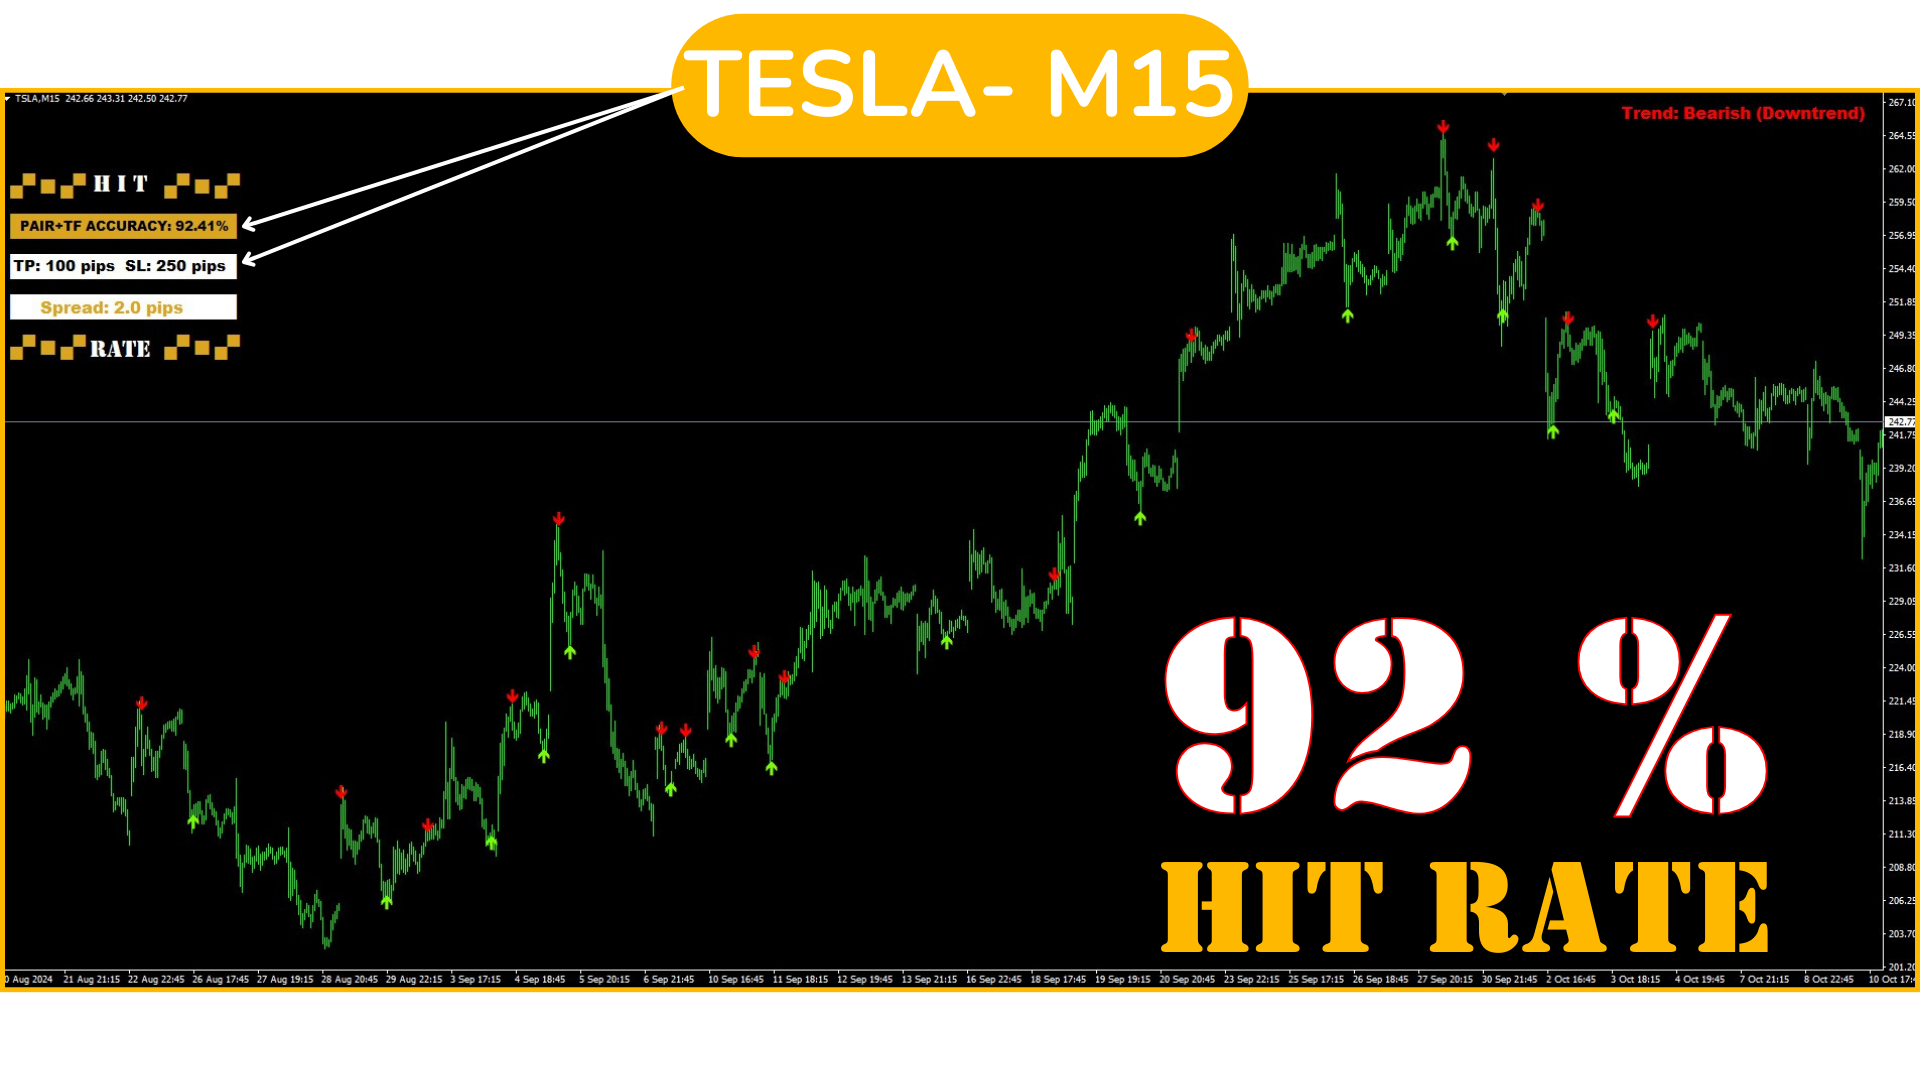
  • A taxa de acerto indica quantas vezes o sistema acerta suas previsões. Um sistema com uma alta taxa de acerto (por exemplo, 90%) é mais confiável e permite proporções SL/TP mais amplas (SL maior que TP).
  • No entanto, uma baixa taxa de acerto não significa necessariamente perdas, desde que o TP seja muito maior que o SL. Com um TP maior, mesmo que você acerte poucas vezes, os ganhos cobrirão as perdas.

    ESSA É A RAZÃO PELA QUAL CONHECER ANTECIPADAMENTE A TAXA DE ACERTO DO SINAL É FUNDAMENTAL, PARA QUE, COM UMA BOA GESTÃO DE CAPITAL (SL+TP), SE ALCANCE UM RESULTADO ÓTIMO.


3. Otimização de acordo com o Par e TF:

Cada par e temporalidade podem responder de maneira diferente à mesma proporção SL/TP, por isso é importante ajustar o SL e o TP de acordo com o desempenho do par e do TF. Por exemplo, em pares voláteis ou TFs maiores, pode ser conveniente usar um TP mais amplo.

Experimente diferentes configurações de SL e TP em cada par e TF, e observe a taxa de acerto em cada um. Isso ajudará a encontrar o equilíbrio ideal para maximizar lucros e minimizar perdas.


Exemplo de Avaliação de Rentabilidade:

Imagine uma estratégia com um SL de 250 pips e um TP de 100 pips. Para que essa configuração seja lucrativa, a taxa de acerto deve ser IDEALMENTE ACIMA DE 70%-80%, dependendo da volatilidade e comportamento do par específico, para que os ganhos cubram as perdas quando o SL é atingido.

No entanto, se a proporção for invertida para um SL de 100 pips e um TP de 250 pips, uma taxa de acerto de 40-50% poderia ser suficiente, pois cada operação vencedora compensaria várias perdas.


Resumo:

  • SL maior que TP: É necessária uma alta taxa de acerto (idealmente acima de 70%).
  • TP maior que SL: Pode funcionar com uma taxa de acerto mais baixa, cerca de 40-50%.
  • Otimização diária: Verifique diariamente se a proporção escolhida se mantém em cada par e TF para obter o melhor desempenho e, se notar uma queda no desempenho de um par, repita o "passo a passo" e reavalie a configuração ideal.

É importante entender que, como essa estratégia pode ser utilizada em todos os pares Forex, Ouro, Prata, Ações, Índices e até Cripto, se seu corretor permitir, bem como em qualquer TF, não é necessário ficar preso a pares que: 1-Têm Spread muito alto 2-Não têm a proporção que estamos buscando, escolha entre os melhores!


Por fim, lembre-se de que não existe uma configuração única ideal. Ao variar as configurações, você notará que diferentes configurações podem oferecer bons resultados dependendo do par e do TF. É por isso que ter um sinal claro que avisa quando fazer um trade com seu respectivo SL e TP (e previamente testados), nos dando uma
 análise da taxa de acerto, torna Hit Rate TopBottom Signal uma estratégia completa. Mesmo que você apenas leia os dados enviados nas notificações e opere de acordo, terá a tranquilidade de tomar decisões informadas e testadas.

Trading sem Estresse, simples e claro. Sem adivinhações ou dúvidas!


Produtos recomendados
Arbitrage Indicators is a professional and easy-to-use Forex trading indicator that uses the best trading principles of the latest AI arbitrage models. This indicator provides accurate buy and sell signals. Applies to currency pairs only. It has six different metrics options, MACD, KDJ, RSI, CCI, RVI, DEMARK. It can be freely switched by users, and intuitively shows the direction and reversal signal of the currency pair. When the two lines cross colors, the currency has a high probability of rev
Alpha Trend sign has been a very popular trading tool in our company for a long time. It can verify our trading system and clearly indicate trading signals, and the signals will not drift. Main functions: Based on the market display of active areas, indicators can be used to intuitively determine whether the current market trend belongs to a trend market or a volatile market. And enter the market according to the indicator arrows, with green arrows indicating buy and red arrows indicating se
This is the complete REX package. It consists of the lite, pro and ULTRA version.  Perfect for beginners and intermediates. REX complete is 100% non repaint. The strategy is based on a mix of different strategies, statistics, including pivot points, oscillators and patterns.  As the trading idea consists of a variety of some classic indicators like Momentum, Williams Percent Range, CCI, Force Index, WPR, DeMarker, CCI, RSI and Stochastic, it is clear that the fundamental indicators have being u
Chart Patterns Detect 15 patterns (Ascending Triangle, Descending Triangle, Rising Wedge, Falling Wedge, Bullish Flag, Bearish Flag, Bullish Rectangle, Bearish Rectangle Symmetrical triangle, Head and Shoulders, Inverted Head and Shoulders, Triple top, Triple Bottom, Double Top, Double Bottom) Use historical data to calculate the probability of each pattern to succeed (possibility to filter notification according to the chance of success) gives graphic indication about the invalidation level and
Supertrend Professional is an Expert Advisor for MetaTrader 4 based on the Supertrend indicator. It is designed for trend-following trading on German indices (GER30/GER40/DAX). FTMO Compliance The EA implements drawdown calculation according to prop firm rules (FTMO, The Funded Trader, etc.): - Daily Drawdown uses MAX(Balance, Equity) as calculation base, exactly as required by FTMO - Reference balance is automatically updated every day at midnight - Automatic closure of all positions when l
Szia! Egy indikátorral. Több idő gyertyájának kirajzoltatása egy charton. Különböző színek rendelhetők a long és short gyertyákhoz. Vonal vastagsága állítható. A gyertya kitöltése engedélyezhető. Hello! With an indicator. Drawing multiple time candles on a chart. Different colors can be ordered for long and short candles. Line thickness can be adjusted. Filling the candle can be allowed. Videó: https://www.youtube.com/watch?v=-9bequnAw-g&amp ;ab_channel=GyulaKlein
Preface: First of all, let me introduce myself. I am a programmer and have been working for over 20 years. 2023 has passed, and our studio has achieved a record of 500 times with 7 manual transmissions. Below, we will show you how to do it through a series of operations. The first step is to model. Modeling is to find a fixed trading pattern. I think everyone has heard of a 2/8 probability, and through this probability, we can further refine it, which means that 1 to 4 is the optimal state. We h
The main idea of this indicator is rates analysis and prediction by Fourier transform. Indicator decomposes exchange rates into main harmonics and calculates their product in future. You may use the indicator as a standalone product, but for better prediction accuracy there is another related indicator - FreqoMaster - which uses FreqoMeterForecast as a backend engine and combines several instances of FreqoMeterForecast for different frequency bands. Parameters: iPeriod - number of bars in the ma
Visual Vortex Indicator MT4
AL MOOSAWI ABDULLAH JAFFER BAQER
Unleash the Power of Market Dynamics with the Vortex Indicator! The Visual Vortex Indicator is your advanced tool for decoding market trends, reversals, and momentum shifts. Priced at $65, this indicator provides a comprehensive view of market behavior, but it’s designed for you to fine-tune and optimize it according to your unique trading strategy. What Makes It Unique? The Vortex Indicator is based on a strategy that identifies directional movements and trend strength by analyzing key price d
This indicator is another variant of the famous powerful indicator Fibonacci-SS https://www.mql5.com/en/market/product/10136 but has different behaviour in placing Pending Order and TP Line. Automatically places Fibonacci retracement lines from the last highest and lowest visible bars on the chart with: An auto Pending Order (Buy/Sell). Taking Profit 1, Taking Profit 2 is pivot point and Taking Profit 3 for extended reward opportunity. The best risk and reward ratio. Simple and powerful indicat
This advisor enters the market at the opening of   London Market . It has a automatic function that give buy (arrow up green) and sell (arrow down red) signal when the indicator met high probabilities requirements.Once the signal is generated it is the trader discretions to start the order button and do trade manually. Stop loss are base on ATR. Recommended Take profit is 20pips.  The trading system is suitable for both experienced traders and beginners.  Timeframe is  M5 . Minimum account bal
Stratos Pali
Michela Russo
4.43 (7)
Stratos Pali Indicator   is a revolutionary tool designed to enhance your trading strategy by accurately identifying market trends. This sophisticated indicator uses a unique algorithm to generate a complete histogram, which records when the trend is Long or Short. When a trend reversal occurs, an arrow appears, indicating the new direction of the trend. Important Information Revealed Leave a review and contact me via mql5 message to receive My Top 5 set files for Stratos Pali at no cost! Dow
The indicator provides a superior alternative to price action analysis. It enables the identification of normalized patterns, which are then transformed into a graphical representation to forecast future steps within a time series. In the top-left corner, you'll find information regarding the expected prediction accuracy, determined through a complex MSQE calculation. You have the flexibility to adjust the time window, making it easy to validate the indicator's performance. Additionally, you can
True SnD
Indra Lukmana
5 (1)
This Supply & Demand indicator uses a unique price action detection to calculate and measures the supply & demand area. The indicator will ensure the area are fresh and have a significant low risk zone. Our Supply Demand indicator delivers functionality previously unavailable on any trading platform. Trading idea You may set pending orders along the supply & demand area. You may enter a trade directly upon price hit the specific area (after a rejection confirmed). Input parameters Signal - Set
Simple to read and powerful, no fancy lines and drawings to clutter your chart or distract you. The trend probability oscillator estimates how likely a trend will continue in a certain period. The cummulator period controls how many bars in the past to use and is a proxy for the timescale the trend probability should hold. The use of a Max Line improves this further by indicating when a trend is likely to reverse. In most cases a trend must lose momentum before reversing. Hence, a trend probabil
Indicadores-chave de preços da zona de oferta e demanda fundo O sistema busca automaticamente áreas de oferta e demanda na linha K e desenha linhas de preços-chave em tempo real. Os comerciantes podem negociar com base nas linhas de negociação de preços. Principais Características O sistema busca automaticamente as áreas de oferta e demanda na linha K. O sistema também desenhará linhas de preços-chave em tempo real, e os traders poderão negociar com base nas linhas de negociação de preços. Port
Watch the Clock
David Leander Tschacher
Watch the Clock shows a clock at a desired position. The clock is useful if you want to check when a candle closes. You can also set an alert to be prepared before the news. ️ Watch the Clock works also in the strategy tester. ️ Watch the Clock requires a minimum of CPU power. ️ Watch the Clock can improve your manual style of trading. Inputs Alert -> At which time should the alert occur? Time Shift in Minutes -> Should the time be incremented by x minutes? Size -> The font size of the tim
MACD Divergence
Sergey Deev
2.5 (2)
The indicator detects divergence signals - the divergences between the price peaks and the MACD oscillator values. The signals are displayed as arrows in the additional window and are maintained by the messages in a pop-up window, e-mails and push-notifications. The conditions which formed the signal are displayed by lines on the chart and in the indicator window. Indicator Parameters MacdFast - fast MACD line period MacdSlow - slow MACD line period MacdSignal - MACD signal line period MacdPric
Dynamic Forex28 Navigator
Bernhard Schweigert
4.43 (7)
Dynamic Forex28 Navigator - A ferramenta de negociação Forex de última geração. ATUALMENTE 49% DE DESCONTO. Dynamic Forex28 Navigator é a evolução dos nossos indicadores populares de longa data, combinando o poder de três em um: Indicador Advanced Currency Strength28 (695 avaliações) + Advanced Currency IMPULSE com ALERTA (520 avaliações) + Sinais CS28 Combo (Bônus). Detalhes sobre o indicador https://www.mql5.com/en/blogs/post/758844 O que o Next-Generation Strength Indicator oferece?  Tudo
Indicador Crypto_Forex "Morning Star pattern" para MT4. - O indicador "Morning Star pattern" é um indicador muito poderoso para negociação de Price Action: sem repintura, sem atraso. - O indicador detecta padrões Morning Star otimistas no gráfico: sinal de seta azul no gráfico (veja as imagens). - Com alertas para PC, celular e e-mail. - Também seu irmão - o indicador bearish "Evening Star pattern" está disponível (siga o link abaixo). - O indicador "Morning Star pattern" é excelente para comb
ZhiBiMACD MT4
Qiuyang Zheng
4.5 (2)
Este é um indicador MACD exclusivo que é mais preciso e fácil de usar do que o MACD tradicional. É adequado para qualquer ciclo gráfico e é adequado para qualquer variedade de mercado. A coluna vermelha é o sinal da banda (Buy) e a coluna azul é o sinal da banda (Sell). As linhas amarela e verde são linhas de tendência e as duas linhas nunca se cruzam. Compre: Na coluna azul, olhe para a linha verde no meio do eixo 0. Venda: Na coluna vermelha, olhe para a linha amarela no meio do eixo 0. O
The indicator identifies two most important patterns of technical analysis - Pin Bar and Engulfing. MT5-version  https://www.mql5.com/en/market/product/53701 Settings: Mincandle size for PinBar - The minimum size of the Pin-Bar candlestick; Percentage of candle body on size - The percentage of the candle body in relation to its length; PinBar Alert - Alert when a Pin-Bar is detected; PinBar Mail - Sends an email when a Pin Bar is found; PinBar Notification - Sends a push notification when a Pin
ECM Elite Channel é um indicador baseado na volatilidade, desenvolvido com um algoritmo de tempo especifico, que consiste em encontrar possíveis correções no mercado. Este indicador mostra duas linhas exteriores, uma interior (linha de retração) e um sinal de seta, onde a teoria do canal consiste em ajudar a identificar condições de sobrecompra e sobrevenda no mercado. O preço do mercado cairá geralmente entre os limites do canal. Se os preços tocarem ou se moverem para fora do canal é uma op
PABT Pattern Indicator - it's classical system one of the signal patterns. Indicator logic - the Hi & Lo of the bar is fully within the range of the preceding bar, look to trade them as pullback in trend. In the way if indicator found PABT pattern it's drawing two lines and arrow what showing trend way.  - First line - it's entry point and drawing at: 1. On the high of signal bar or on middle of the signal bar (depending from indicator mode) for buy; 2. On the low of signal bar or on middle of t
RQL Trend Board – Description RQL Trend Board   is a simple but powerful multi-timeframe trend dashboard. It shows the current market bias across several timeframes at the same time, using an internal trend-classification method. Each timeframe is displayed as a colored box:   Green   – bullish bias → look for   long   setups   Yellow   – ranging / unclear →   no trade zone   Red   – bearish bias → look for   short   setups The indicator gives a clear   overall picture   of where the
FREE
Indicador Crypto_Forex Padrão PINBAR para MT4, sem repintura, sem atraso. - O indicador "Padrão PINBAR" é um indicador muito poderoso para negociação de Price Action. - O indicador detecta PinBars no gráfico: - PinBar de alta - Sinal de seta azul no gráfico (veja as imagens). - PinBar de baixa - Sinal de seta vermelha no gráfico (veja as imagens). - Com alertas para PC, celular e e-mail. - O indicador "Padrão PINBAR" é excelente para combinar com níveis de suporte/resistência. Clique aqui par
VR Cub
Vladimir Pastushak
VR Cub é um indicador para obter pontos de entrada de alta qualidade. O indicador foi desenvolvido para facilitar cálculos matemáticos e simplificar a busca por pontos de entrada em uma posição. A estratégia de negociação para a qual o indicador foi escrito tem provado a sua eficácia há muitos anos. A simplicidade da estratégia de negociação é a sua grande vantagem, o que permite que até mesmo os comerciantes novatos negociem com sucesso com ela. VR Cub calcula os pontos de abertura de posição e
Spirit mt4
Alena Snigireva
5 (1)
Spirit mt4 is an indicator that works without flashing, the signals are triggered after the arrow at the beginning of the next candle Includes several indicators for overbought and oversold levels. Works with any currency pair: EUR/USD, AUD/USD and others. After the purchase, send me a private message and I will send you the settings that I use for this indicator. Suitable for trading cryptocurrencies. I like to trade cryptocurrency more, so I use it more there. It can also be used for bi
Distinctive
Tatiana Savkevych
Distinctive is a forex trending arrow indicator for identifying potential entry points. I like it, first of all, because it has a simple mechanism of work, adaptation to all time periods and trading tactics. Created on the basis of a regression channel with filters. Plotting the Lawrence indicator signals on a price function chart using a mathematical approach. How it works - when the price breaks out in the overbought / oversold zone (channel levels), a buy or sell signal is generated. Everyt
MetaTrader 5 version available here : https://www.mql5.com/en/market/product/24882 FFx Basket Scanner is a global tool scanning all pairs and all timeframes over up to five indicators among the 16 available. You will clearly see which currencies to avoid trading and which ones to focus on. Once a currency goes into an extreme zone (e.g. 20/80%), you can trade the whole basket with great confidence. Another way to use it is to look at two currencies (weak vs strong) to find the best single pairs
Os compradores deste produto também adquirem
Indicador Miraculous – Ferramenta 100% Não Repintável para Forex e Opções Binárias Baseada no Quadrado de Nove de Gann Este vídeo apresenta o Indicador Miraculous , uma ferramenta de negociação altamente precisa e poderosa, desenvolvida especificamente para traders de Forex e Opções Binárias . O que torna este indicador único é a sua base no lendário Quadrado de Nove de Gann e na Lei da Vibração de Gann , tornando-o uma das ferramentas de previsão mais precisas disponíveis na negociação moderna.
Precautions for subscribing to indicator This indicator only supports the computer version of MT4 Does not support MT5, mobile phones, tablets The indicator only shows the day's entry arrow The previous history arrow will not be displayed (Live broadcast is for demonstration) The indicator is a trading aid Is not a EA automatic trading No copy trading function The indicator only indicates the entry position No exit (target profit)  The entry stop loss point is set at 30-50 PIPS Or the front hi
Pulse Scalping Line - an indicator for identifying potential pivot points. Based on this indicator, you can build an effective Martingale system. According to our statistics, the indicator gives a maximum of 4 erroneous pivot points in a series. On average, these are 2 pivot points. That is, the indicator shows a reversal, it is erroneous. This means that the second signal of the indicator will be highly accurate. Based on this information, you can build a trading system based on the Martingale
El indicador "MR BEAST ALERTAS DE LIQUIDEZ" es una herramienta avanzada diseñada para proporcionar señales y alertas sobre la liquidez del mercado basándose en una serie de indicadores técnicos y análisis de tendencias. Ideal para traders que buscan oportunidades de trading en función de la dinámica de precios y los niveles de volatilidad, este indicador ofrece una visualización clara y detallada en la ventana del gráfico de MetaTrader. Características Principales: Canal ATR Adaptativo: Calcula
Rtc ML Ai Predictor MT4
Muhammad Faisal Sagala
Rtc ML Ai | Predictor CORE MACHINE LEARNING ENGINE Adaptive ML Market Predictor – Multi-Bar Trend & Candle Forecast What This Indicator Does This indicator is a  real-time market prediction engine  designed to analyze price behavior and estimate  future market tendencies . Unlike conventional indicators, this system  does not rely on static parameters or historical curve-fitting , but adapts its internal state dynamically during live market operation. Instead of using static rules, the indic
PairMaster Buy Sell Arrow Indicator for MT4 Trade Reversals Like a Pro — Catch Every Swing Point with Precision The PairMaster Buy Sell Arrow Indicator is a powerful MetaTrader 4 tool built to identify high-probability swing trading opportunities . Designed for traders who value accuracy, clarity, and simplicity, PairMaster detects key market turning points and plots intuitive buy and sell arrows directly on your chart. Key Features Accurate Swing Point Detection – Automatically identifies ma
BinaryIndicator
Andrey Spiridonov
BinaryIndicator is a highly accurate indicator for trading binary options. It shows excellent results in scalping. This indicator is based in multifactor analysis of trend indicators, as well as confirmation oscillators, which in the end gives an increased accuracy of signals. Advantages of the indicator Increased accuracy of signals. Excellent results when trading binary options with a short expiration time from M30 to M1 . It works on any timeframes. Works with any trade symbols. Parameters
FFx Engulfing Setup Alerter gives trade suggestions with Entry, Target 1, Target 2 and StopLoss. Below are the different options available: Entry suggestion - pips to be added over the break for the entry 3 different options to calculate the SL - by pips, by ATR multiplier or at the pattern High/Low 3 different options to calculate the 2 TPs - by pips, by ATR multiplier or at Risk/Reward Offset the dashboard - any place on the chart Remove the suggestion once the price reached the SL line Lines
FFx InsideBar Setup Alerter gives trade suggestions with Entry, Target 1, Target 2 and StopLoss. Below are the different options available: Entry suggestion - pips to be added over the break for the entry Minimum candle size - to avoid too close buy/sell entry suggestions 3 different options to calculate the SL - by pips, by ATR multiplier or at the pattern High/Low 3 different options to calculate the 2 TPs - by pips, by ATR multiplier or at Risk/Reward Offset the dashboard - any place on the c
FFx OutsideBar Setup Alerter gives trade suggestions with Entry, Target 1, Target 2 and StopLoss. Below are the different options available: Entry suggestion - pips to be added over the break for the entry. 3 different options to calculate the SL - by pips, by ATR multiplier or at the pattern High/Low. 3 different options to calculate the 2 TPs - by pips, by ATR multiplier or at Risk/Reward. Offset the dashboard - any place on the chart. Remove the suggestion once the price reached the SL line.
FFx PinBar Setup Alerter gives trade suggestions with Entry, Target 1, Target 2 and StopLoss. Below are the different options available: Entry suggestion - pips to be added over the break for the entry Minimum candle size - to avoid too small candles 3 different options to calculate the SL - by pips, by ATR multiplier or at the pattern High/Low 3 different options to calculate the 2 TPs - by pips, by ATR multiplier or at Risk/Reward Offset the dashboard - any place on the chart Remove the sugges
Automatic, live & interactive picture of all trendlines. Assign push, email and sound alerts to the lines of your choice and be informed about price rollback, breakout, rollback after breakout, number of rollbacks, line expiration by double breakout. Correct, drag or delete the lines and interactively tune the line system. https://youtu.be/EJUo9pYiHFA . Chart examples https: //www.mql5.com/en/users/efficientforex Price Interaction Events All events are effective immediately and only after one
The purpose of this new version of the MT4 standard indicator provided in your platform is to display in a sub-window multiple timeframes of the same indicator with its divergences. See the example shown in the picture below. But the display isn't like a simple MTF indicator. This is the real display of the indicator on its timeframe. Here's the options available in the FFx divergences indicator: Select the timeframes to be displayed (M1 to Monthly) Define the width (number of bars) for each tim
The purpose of this new version of the MT4 standard indicator provided in your platform is to display in a sub-window multiple timeframes of the same indicator with its divergences. See the example shown in the picture below. But the display isn't like a simple MTF indicator. This is the real display of the indicator on its timeframe. Here's the options available in the FFx divergences indicator: Select the timeframes to be displayed (M1 to Monthly). Define the width (number of bars) for each ti
The FFx Dashboard MTF alerter will show you on a single chart all the timeframes (M1 to Monthly) with their own status for the indicator. 2 Alert Options: Single timeframe: each selected timeframe alert separately when a signal occurs Multi timeframes: all selected timeframes must agree for an alert to be triggered Both options have an input to select the timeframes to be used for the alert(s). How to Understand the Status: Green/Red square: histogram above/below 0 line Green square + Red bord
The FFx Dashboard MTF alerter will show you on a single chart all the timeframes (M1 to Monthly) with their own status for the indicator. 2 Alert Options: Single timeframe: each selected timeframe alert separately when a signal occurs Multi timeframes: all selected timeframes must agree for an alert to be triggered Both options have an input to select the timeframes to be used for the alert(s). How to understand the status: Green/Red square: RSI above/below 50 line Green square + Red border: R
The FFx Dashboard MTF alerter will show you on a single chart all the timeframes (M1 to Monthly) with their own status for the indicator. 2 Alert Options: Single timeframe: each selected timeframe alert separately when a signal occurs Multi timeframes: all selected timeframes must agree for an alert to be triggered Both options have an input to select the timeframes to be used for the alert(s). How to understand the status: Green/Red square: Stoch above/below 50 line Green square + Red border:
The FFx Dashboard MTF alerter will show you on a single chart all the timeframes (M1 to Monthly) with their own status for the indicator. 2 Alert Options: Single timeframe: each selected timeframe alert separately when a signal occurs Multi timeframes: all selected timeframes must agree for an alert to be triggered Both options have an input to select the timeframes to be used for the alert(s). How to understand the status: Green/Red square: Price above/below Cloud (Kumo) Green square + Red bo
The FFx Dashboard MTF alerter will show you on a single chart all the timeframes (M1 to Monthly) with their own status for the indicator. 2 Alert Options: Single timeframe: each selected timeframe alert separately when a signal occurs Multi timeframes: all selected timeframes must agree for an alert to be triggered Both options have an input to select the timeframes to be used for the alert(s). How to understand the status: Green/Red square: MA pointing Up/Down Green square + Red border: MA po
The FFx Dashboard MTF alerter will show you on a single chart all the timeframes (M1 to Monthly) with their own status for the indicator. 2 Alert Options: Single timeframe: each selected timeframe alert separately when a signal occurs. Multi timeframes: all selected timeframes must agree for an alert to be triggered. Both options have an input to select the timeframes to be used for the alert(s). How to understand the status: Green square: Price above PSAR Red square: Price below PSAR Options
The FFx Dashboard MTF alerter will show you on a single chart all the timeframes (M1 to Monthly) with their own status for the indicator. 2 Alert Options: Single timeframe: each selected timeframe alert separately when a signal occurs Multi timeframes: all selected timeframes must agree for an alert to be triggered Both options have an input to select the timeframes to be used for the alert(s). How to understand the status: Green/Red square: CCI above/below levels (ie. 100/-100) Grey square: C
The FFx Dashboard MTF alerter will show you on a single chart all the timeframes (M1 to Monthly) with their own status for the indicator. 2 Alert Options: Single timeframe: each selected timeframe alert separately when a signal occurs Multi timeframes: all selected timeframes must agree for an alert to be triggered Both options have an input to select the timeframes to be used for the alert(s). How to understand the status: Green/Red square: ADX above level Grey square: ADX below level Red bor
The FFx Dashboard MTF alerter will show you on a single chart all the timeframes (M1 to Monthly) with their own status. 2 Alert Options: Single timeframe: each selected timeframe alert separately when a signal occurs Multi timeframes: all selected timeframes must agree for an alert to be triggered Both options have an input to select the timeframes to be used for the alert(s). How to understand the status: Green/Red square: bullish/bearish candle Options available in the FFx Dashboard Alerter
The [GRAFF] III manual trading system is based on multiple MetaTrader (MT4) indicators. Together, the entire PACK of GRAFF III indicators makes an advanced trading tool. The system consists of over 20 different custom-built indicators which have been carefully selected and tested in the long term to produce strong and efficient trading signals. The particular indicators are based on different mathematical formulas, so the entire system is calibrated to remove false signals from its own indicator
FFx Universal Strength Meter PRO is more than a basic strength meter. Instead of limiting the calculation to price, it can be based on any of the 19 integrated strength modes + 9 timeframes. With the FFx USM, you are able to define any period for any combination of timeframes. For example, you can set the dashboard for the last 10 candles for M15-H1-H4… Full flexibility! Very easy to interpret... It gives a great idea about which currency is weak and which is strong, so you can find the best pai
A simplistic indicator informing a user on RSI divergence by sending messages to mobile device and email. The indicator draws 2 vertical lines, marking two RSI extrema that formed the divergence. You get the alert, open the charts and make a decision. The indicator does not show past divergences, thus when you attach it to a chart for the first time you see nothing. Graphics and alerts will appear as soon as divergences do. Drop it in Tester to see how it works. Parameters: RSIPeriod - number of
Pan PrizMA CD Phase is an analogue of the МetaТrader 5 indicator , and is an option based on the Pan PrizMA indicator. Details . Averaging by a quadric-quartic polynomial increases the smoothness of lines, adds momentum and rhythm. Extrapolation by the sinusoid function near a constant allows adjusting the delay or lead of signals. The value of the phase - wave status parameter (which is close in meaning to the trigonometric phase or the angle of the radius-vector rotation in the trigonometric p
Mais do autor
HFT Fast M1 Gold Scalper V8 EA
Martin Alejandro Bamonte
2.33 (3)
VERSÃO ULTRA OTIMIZADA – MT4 HFT FAST M1 GOLD SCALPER V8.2 , em sua versão para MT4, é o lançamento mais poderoso, estável e refinado até hoje. HFT é um scalper de alta frequência que opera exclusivamente em Ouro (XAUUSD) no TF: M1, executando um grande número de operações diariamente. Ele suporta alavancagem de até 1:500 e opera com tamanhos de lote muito razoáveis para uma verdadeira estratégia de scalping. Por isso, requer contas dedicadas para scalping (RAW ou ECN). ICMarkets é o corretor re
HFT Fast M1 Gold Scalper MT5 EA
Martin Alejandro Bamonte
2.11 (9)
HFT AI FAST SCALPER V10.1 A versão mais avançada do nosso EA até agora, totalmente reconstruída com tomada de decisão baseada em IA , votação multi-IA e lógica de negociação dinâmica . Agora não está mais limitado apenas ao XAUUSD (Ouro) no M1, mas também suporta BTCUSD e ETHUSD , com entradas de alta frequência, gestão de risco inteligente e total adaptabilidade. Este EA combina modelos de IA gratuitos conectados via OpenRouter com filtros avançados para negociação de precisão em qualquer co
Indicador NextCandlePredictor NextCandlePredictor, um indicador de sinal com alerta que não repinta, não muda de cor, não se move, não desaparece e não tem lag. Ele ajudará a identificar a direção da próxima ou próximas velas em qualquer período de tempo. Altamente recomendado para mercados de alta volatilidade, como Nova York, Londres ou até mesmo a sobreposição de ambos. Principais Características: Versatilidade em Timeframes: Fornece sinais rápidos e precisos em qualquer timeframe, de M1 a H1
Candle Probability Scalper
Martin Alejandro Bamonte
Guia de Uso do Candle Probability Scalper Este indicador torna o scalping fácil e 100% intuitivo. Candle Probability Scalper mostrará de forma instantânea os dados percentuais de força de compradores e vendedores em TEMPO REAL e na vela atual. Os percentuais são atualizados a cada tick, o que significa que você saberá, segundo a segundo, o que a maioria dos compradores e vendedores está fazendo, sem nenhum atraso. Isso ajudará imensamente a determinar ou confirmar a força de cada lado e, conseq
Aurum Apex Mt4 EA
Martin Alejandro Bamonte
5 (2)
Agora você pode baixar a versão demo do Aurum Apex na guia Comentários para avaliar seu desempenho ao vivo no seu próprio corretor! Aurum Apex EA é uma poderosa ferramenta de negociação automatizada 100%, projetada para a plataforma MT4. Ele realiza análises de mercado em tempo real, detectando várias oportunidades de negociação. Adequado para traders de todos os níveis, o Aurum Apex EA oferece três modos de risco, ajustáveis através do parâmetro de Risco: Risco = 0.1 (Baixo Risco): Ideal para
Scalping Signal NO Repaint NO Lag
Martin Alejandro Bamonte
3 (2)
"Scalping Signal No Repaint No Lag" é o único indicador no mercado que, ao ser arrastado para qualquer gráfico, carrega automaticamente todos os indicadores necessários sem a necessidade de carregar qualquer template ou outros indicadores. Ele configura automaticamente o gráfico para que fique exatamente como na imagem fornecida. Este indicador garante sinais sem repintura ou atraso, tornando-o ideal para estratégias de scalping em todos os pares de moedas e intervalos de tempo (TF). Funcionali
Clear Breakout
Martin Alejandro Bamonte
5 (2)
O indicador "Breakout Buy-Sell" foi desenvolvido para identificar e destacar potenciais oportunidades de compra e venda com base em rompimentos de preços durante diferentes sessões de mercado (Tóquio, Londres e Nova York). Este indicador ajuda os traders a visualizar claramente as zonas de compra e venda, bem como os níveis de take-profit (TP) e stop-loss (SL). Estratégia de Uso O indicador pode ser usado da seguinte maneira: Configuração Inicial : Selecione a sessão do mercado e ajuste o offset
GbpUsd Pip Hunter EA
Martin Alejandro Bamonte
Portugués GBPUSD Pip Hunter EA Características principais: Otimizado para GBPUSD no M15: Projetado e testado especificamente para o par GBPUSD em um gráfico de 15 minutos. Tamanho mínimo de conta recomendado: Requer um saldo mínimo de $1000 para garantir baixas perdas. Compatibilidade de spread: Melhor utilizado com contas de spread baixo ou ECN para maximizar a lucratividade. Gestão de riscos: Inclui uma opção para desativar a função de Lote Exponencial ajustando-a para 1.0, conforme suas neces
O indicador MTFMA (Médias Móveis Multitemporais) utiliza várias médias móveis (MAs) em diferentes prazos para fornecer sinais de compra e venda (que não repintam) em uma janela separada do gráfico principal. É versátil e fácil de interpretar, adequado tanto para scalping em prazos menores quanto para negociação de longo prazo em prazos maiores. Por que é Multiframe? O termo multiframe refere-se à capacidade do indicador de utilizar e combinar dados de múltiplos prazos. O MTFMA calcula e exibe si
O indicador "MultiSymbol & TF Chart Integrated" é projetado para fornecer uma visão abrangente do mercado rapidamente, permitindo que você monitore até 60 pares de moedas em seus intervalos de tempo preferidos em um único gráfico (modo múltiplo) ou veja o par que você está negociando em todos os TFs (modo simples). Principais Vantagens: Monitoramento Completo: Permite monitoramento em tempo real de todos os pares desejados em um único gráfico de relance. Economia de Tempo: Evita a necessidade de
Pairs and TF Changer
Martin Alejandro Bamonte
Está cansado de alternar entre vários gráficos para monitorar diferentes pares de moedas e prazos? O indicador Pairs and TF Changer está aqui para revolucionar sua experiência de negociação! Depois de carregar todos os indicadores para sua estratégia, adicione o Pairs and TF Changer ao gráfico. Se necessário, você pode ajustar sua posição, cores ou o número de colunas exibidas! Principais Características: Integração perfeita: Integre este indicador à sua estratégia de negociação sem esforço. Com
GO Trend MultiTimeFrame
Martin Alejandro Bamonte
Indicador GoTrend Multi-Timeframe O indicador "GoTrend Multi-Timeframe" é uma ferramenta essencial para traders que buscam uma maneira rápida e eficiente de avaliar as tendências gerais e específicas de um par de moedas em diferentes intervalos de tempo. Este indicador permite que os traders obtenham uma visão clara e abrangente da direção do mercado num piscar de olhos, otimizando a tomada de decisões e aprimorando a eficácia de suas estratégias de negociação. Principais Características: Anális
Gold Vertex EA
Martin Alejandro Bamonte
Gold Vertex EA is a reliable and stable option for those looking to automate their trading in the gold market. With a robust system based on one of the most effective indicators and a solid trend-following strategy, Gold Vertex EA is a powerful tool for traders who want precise, worry-free trading. Requirements Platform : MetaTrader 4 Supported Instruments : Specifically developed and configured for Gold (XAUUSD) Recommended Account Type : ECN or low spread Minimum Deposit Recommended : $100 Tim
Inferno Signals EA
Martin Alejandro Bamonte
Inferno Signals EA foi projetado para aproveitar os movimentos mais significativos do mercado, operando no sólido timeframe M30. É ideal para aqueles que desejam começar com um investimento inicial pequeno, começando com apenas $100 por par, com uma gestão automática de capital que inclui ajustes dinâmicos de lotes e níveis de segurança como Stop-Loss (SL). Com baixo rebaixamento (drawdown) e uma estratégia focada em capturar as melhores oportunidades, Inferno Signals EA visa maximizar os retorn
MarketPrice Indicator
Martin Alejandro Bamonte
The MarketPrice Indicator is designed to provide a quick, one-glance visualization of the trend direction for a currency pair across all time frames (Time Frames), streamlining decision-making. MarketPrice Indicator is based on daily levels and trading signals derived from moving average crossovers and market strength according to various technical indicators. It comes fully configured, though you can, of course, modify any parameters as desired. Indicator Logic The indicator uses a combination
Last 50 Pips
Martin Alejandro Bamonte
O indicador Last 50 Pips foi projetado para identificar rapidamente oportunidades de compra e venda com base no comportamento recente dos preços. Ele mede a variação de preço nas últimas velas para destacar em amarelo os momentos em que o preço pode estar mudando de direção. Sinal de compra: Deve abrir uma posição de COMPRA quando o indicador muda de VERMELHO para AMARELO , sugerindo uma mudança de uma tendência de baixa para uma de alta. Por favor, veja as imagens para entender como é simples.
FlashPoints Breakout
Martin Alejandro Bamonte
Todos os dias, no início do mercado, o Flashpoints Breakout revisará os níveis de pivô, suporte e resistência usando os dados do dia anterior (alta, baixa e fechamento) para calcular dois níveis de rompimento (de alta e de baixa). Dessa forma, você terá os novos níveis de entrada prontos logo pela manhã, junto com os valores de Take Profit (TP) e Stop Loss (SL), permitindo que você faça pedidos pendentes de Buy Stop ou Sell Stop sem cálculos adicionais. Com o Flashpoints Breakout , você pode faz
Buy Sell Magic Signal
Martin Alejandro Bamonte
BUYSELLMAGIC is a non-repainting signal-type trading indicator designed to precisely detect entry points in the market.  Features Reliable and permanent signals : BUYSELLMAGIC signals are final once the candle closes, ensuring they will not be modified or removed from the chart. This gives you the confidence of working with an indicator that keeps its signals stable and trustworthy. Comprehensive alerts : In addition to signals on the chart, you’ll receive notifications via email, pop-up alerts
Automatic Fibonacci Pivots
Martin Alejandro Bamonte
Automatic Fibonacci Pivots automatically calculates pivot levels and support/resistance based on Fibonacci, clearly showing key reference points that indicate potential reversal or trend continuation zones, as well as buy and sell areas . Designed for traders seeking clarity on charts without having to recalculate and manually place Fibonacci levels each time. Once set up on your computer, it will send an alert to your phone when a potential buy/sell signal is issued, allowing you to trade direc
M1 Easy Scalper
Martin Alejandro Bamonte
4 (3)
M1 EASY SCALPER is a scalping indicator specifically designed for the 1-minute (M1) timeframe, compatible with any currency pair or instrument available on your MT4 terminal. Of course, it can also be used on any other timeframe, but it works exceptionally well on M1 (which is challenging!) for scalping. Note: if you're going to scalp, make sure you have an account suitable for it. Do not use Cent or Standard accounts as they have too much spread! (use ECN, RAW, or Zero Spread accounts) Robustn
Trade Insights Display
Martin Alejandro Bamonte
Trade Insights Display is the ideal companion for traders who want to operate with clarity and precision. This indicator provides real-time access to critical account data, such as: Balance Equity Margin Spread Swap Remaining time for the current candle . These data points are essential, regardless of the strategy or other indicators you use. Having this indicator always visible allows you to quickly assess your account status, the swap for each pair (helping you avoid high-cost trades), and the
EuroGeddon EA
Martin Alejandro Bamonte
EUROGEDDON EA – Performance Inigualável com Risco Controlado EUROGEDDON EA é um robô de trading 100% automático com INTELIGÊNCIA ADAPTATIVA , criado para promover o crescimento constante de contas pequenas com controle total do seu capital. Com um lote de 0.01 para cada 200 $ na conta, ele opera com risco muito baixo e alcança um Drawdown extremamente reduzido , oferecendo uma performance que você precisa testar pessoalmente. Baixe a versão demo e veja com seus próprios olhos. Não confie
ZeroLag TrendCandle Signal
Martin Alejandro Bamonte
ZeroLag TrendCandle — Sistema de Colorização de Velas e Alertas em Tempo Real (Sem Repainting) ZeroLag TrendCandle é uma ferramenta de detecção de tendências em tempo real que aplica uma colorização de velas sem repaint baseada em uma análise avançada do indicador Williams Percent Range (WPR). Ele destaca mudanças de tendência, variações de momentum e possíveis reversões por meio de um sistema de cores dinâmico — permitindo ao trader entender instantaneamente a direção atual do mercado com um
Candle Fusion Pro
Martin Alejandro Bamonte
Candle Fusion Pro — Reconhecimento de Padrões + Filtro de Tendência + Filtro de Momentum (Sem Repaint) Detecte formações de velas poderosas e confirme sua força com análise de tendência e momentum em tempo real. Candle Fusion Pro é a ferramenta visual definitiva para traders que confiam na precisão da ação do preço , estrutura de tendência e confirmações múltiplas . Principais Recursos Entradas Baseadas em Padrões : Detecta mais de 10 padrões japoneses avançados , incluindo: Estrelas cadentes
ClearView Trend Finder
Martin Alejandro Bamonte
ClearView Trend Finder — Consegue ver como está claro? Você já teve a sensação de que o gráfico está cheio de ruído? Muitos indicadores, sinais contraditórios e linhas que só complicam a análise? ClearView Trend Finder elimina completamente essa bagunça visual e permite que você se concentre no que realmente importa: a tendência clara . Este sistema transforma o gráfico em uma visualização limpa e precisa, que nunca redesenha ou se modifica. Cada vela é filtrada para mostrar apenas a direção d
ARIA Connector EA
Martin Alejandro Bamonte
2.17 (30)
Aria Connector EA – V4 (Máquina de Aprendizagem + Modelo de Aprendizagem XGBoost +112 IAs Pagos e Gratuitos + Sistema de Votação + Prompts Externos e Editáveis) Enquanto a maioria dos EAs no mercado afirma usar "IA" ou "redes neurais" mas na realidade executam apenas scripts básicos, o Aria Connector EA V4 redefine o que significa trading verdadeiramente alimentado por IA. Isto não é teoria, não é exagero de marketing, é uma conexão direta e verificável entre sua plataforma MetaTrader 5 e 112
Ai FGS EA
Martin Alejandro Bamonte
1 (1)
This EA is a private edition developed for traders who are part of our advanced testing and support program. It offers early access to selected configurations and system updates that will later be integrated into the main public release. Only users who have previously communicated with our team and received confirmation should proceed with the purchase. The EA operates using our latest optimization logic and is intended for professional traders who understand the importance of running control
Filtro:
Sem comentários
Responder ao comentário