Hit Rate Top Bottom Signal

Hit Rate Top Bottom Signal

Hit Rate Top Bottom Signal

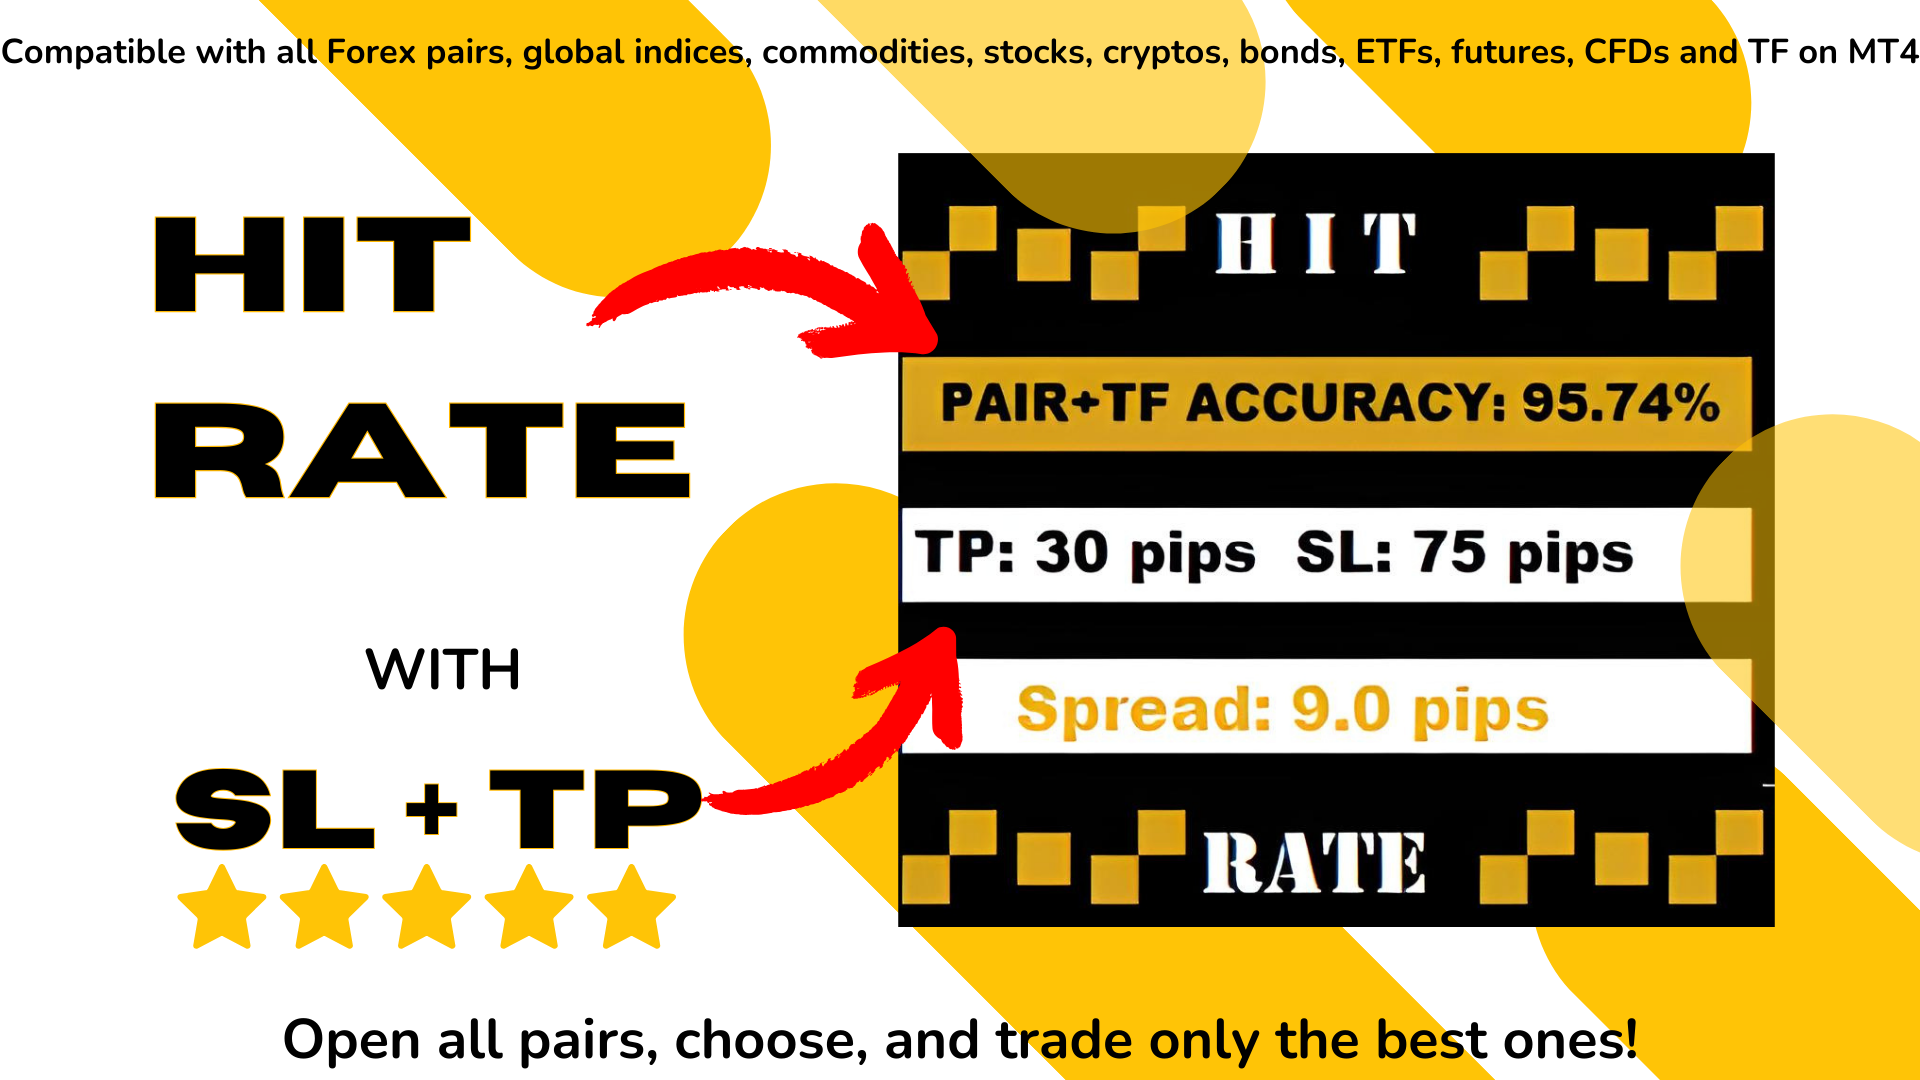
Hit Rate Top Bottom Signal offre une approche totalement innovante. Il est idéal pour ceux qui souhaitent évaluer à l’avance comment le signal fonctionne avec un TP-SL spécifique et dans quels PAIRES/TF il est le plus performant.

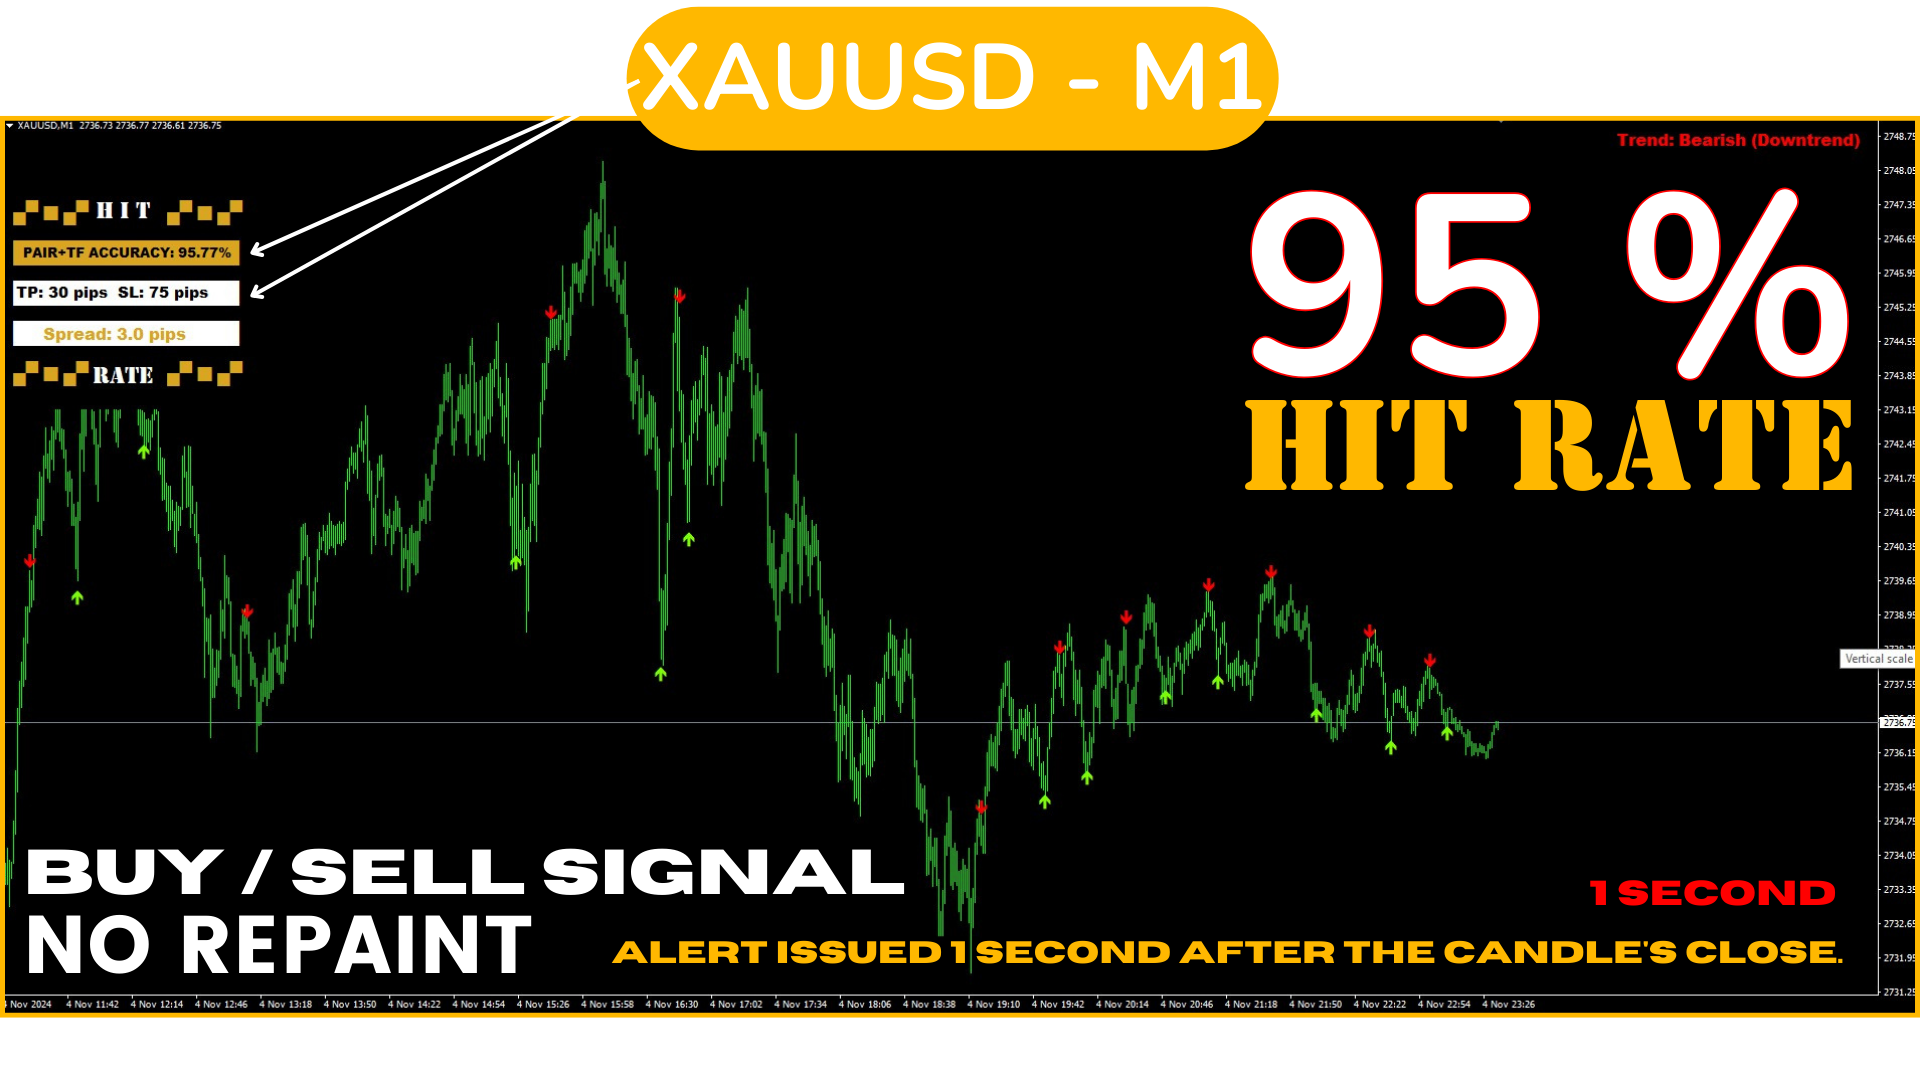
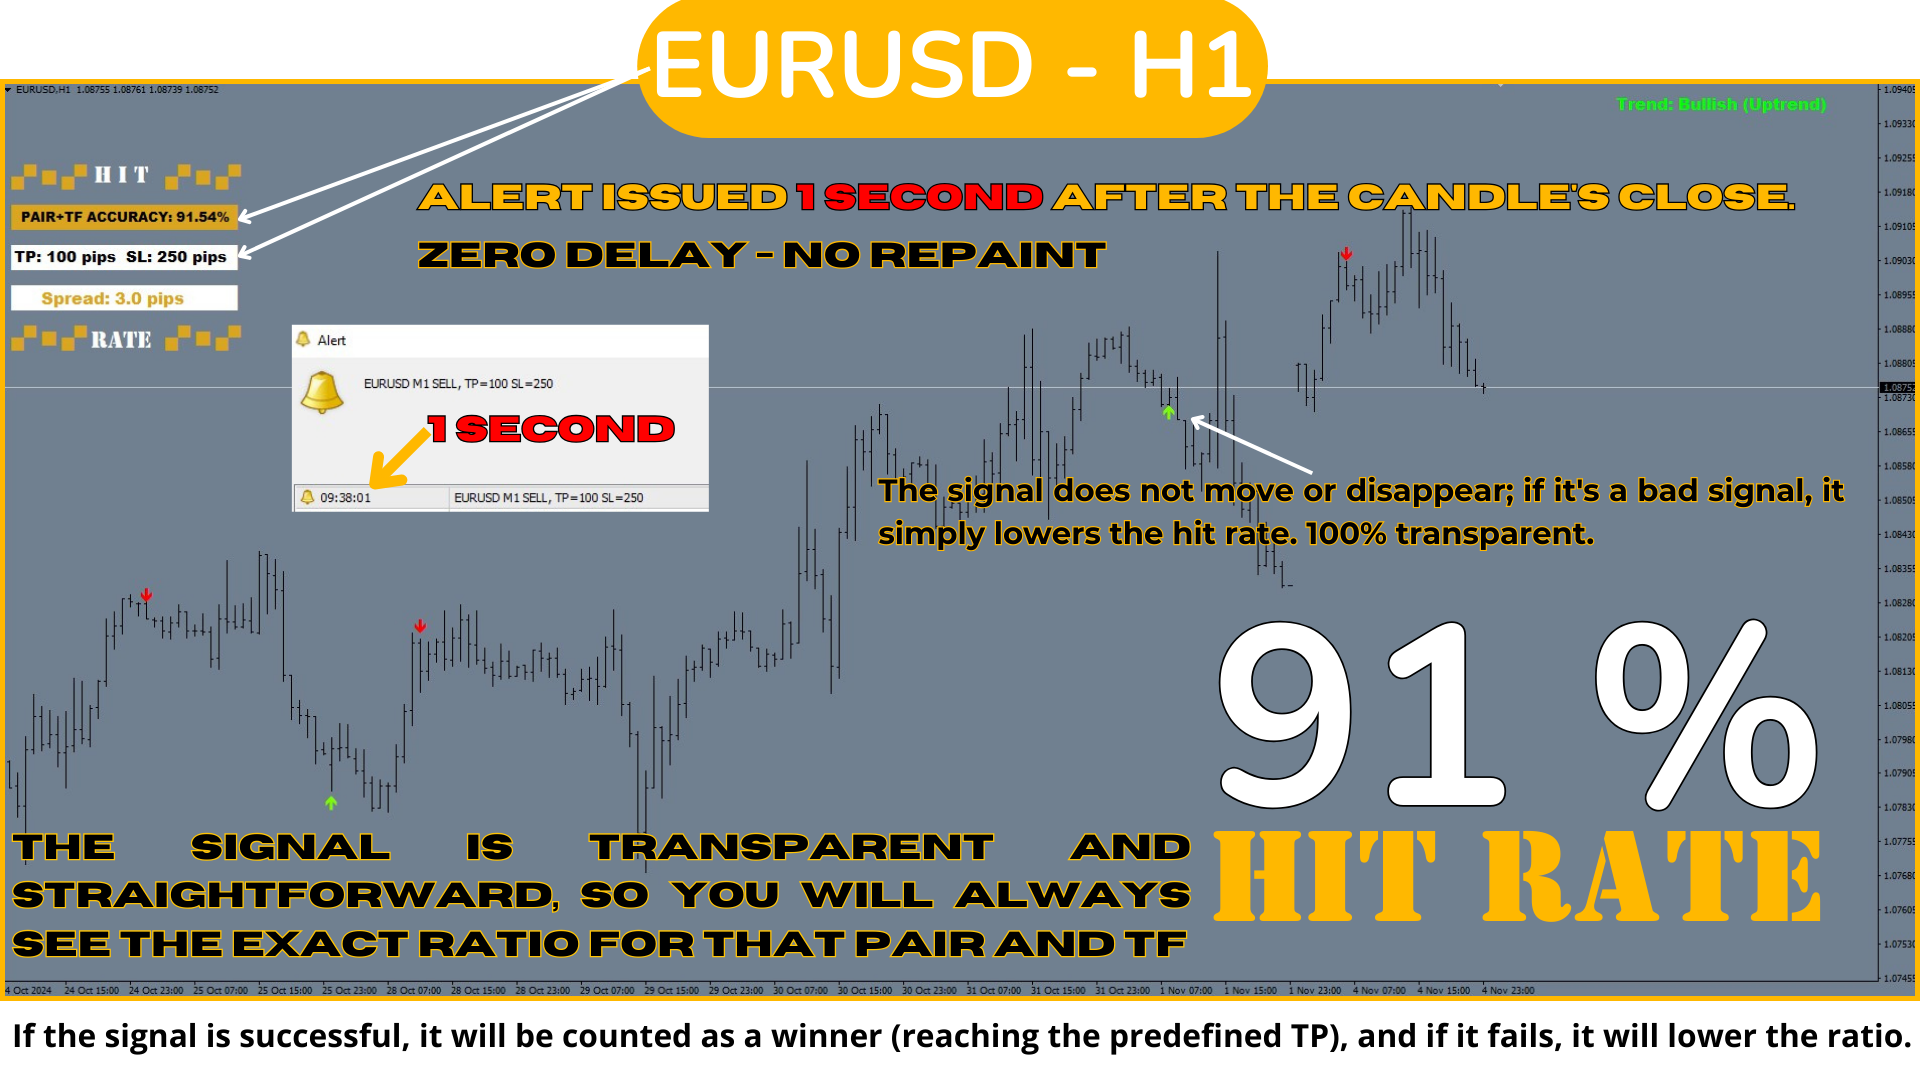
La stratégie Hit Rate Top Bottom Signal est un outil essentiel pour tout trader et type de trading car elle émet non seulement des signaux précis sans redessiner, indiquant clairement quand trader et dans quelle direction, mais elle maintient également un enregistrement détaillé du pourcentage de réussite pour chaque paire et TF, avec un Take Profit (TP) et un Stop Loss (SL) prédéfinis. Cela permet de connaître à l'avance le taux d’efficacité du signal, ce qui est crucial pour une bonne gestion des risques et pour opérer avec la plus grande précision.

Cette stratégie se distingue par sa capacité à détecter des points de retournement dans les impulsions, plutôt que des mouvements complets, ce qui rend les signaux plus fréquents que ceux du Top-Bottom traditionnel en se concentrant sur
les moments clés de chaque oscillation importante du marché.


Cette capacité à montrer, en pourcentage, l’efficacité historique du signal en combinaison avec un ratio SL/TP défini fait de cette stratégie la meilleure option pour opérer en toute sécurité, permettant au trader de prendre des décisions basées sur des données. En faisant confiance à un signal qui est non seulement clair et direct, mais qui possède également un historique prouvé, nous avons ici l'une des meilleures stratégies disponibles.


Comment trader avec ce système ?

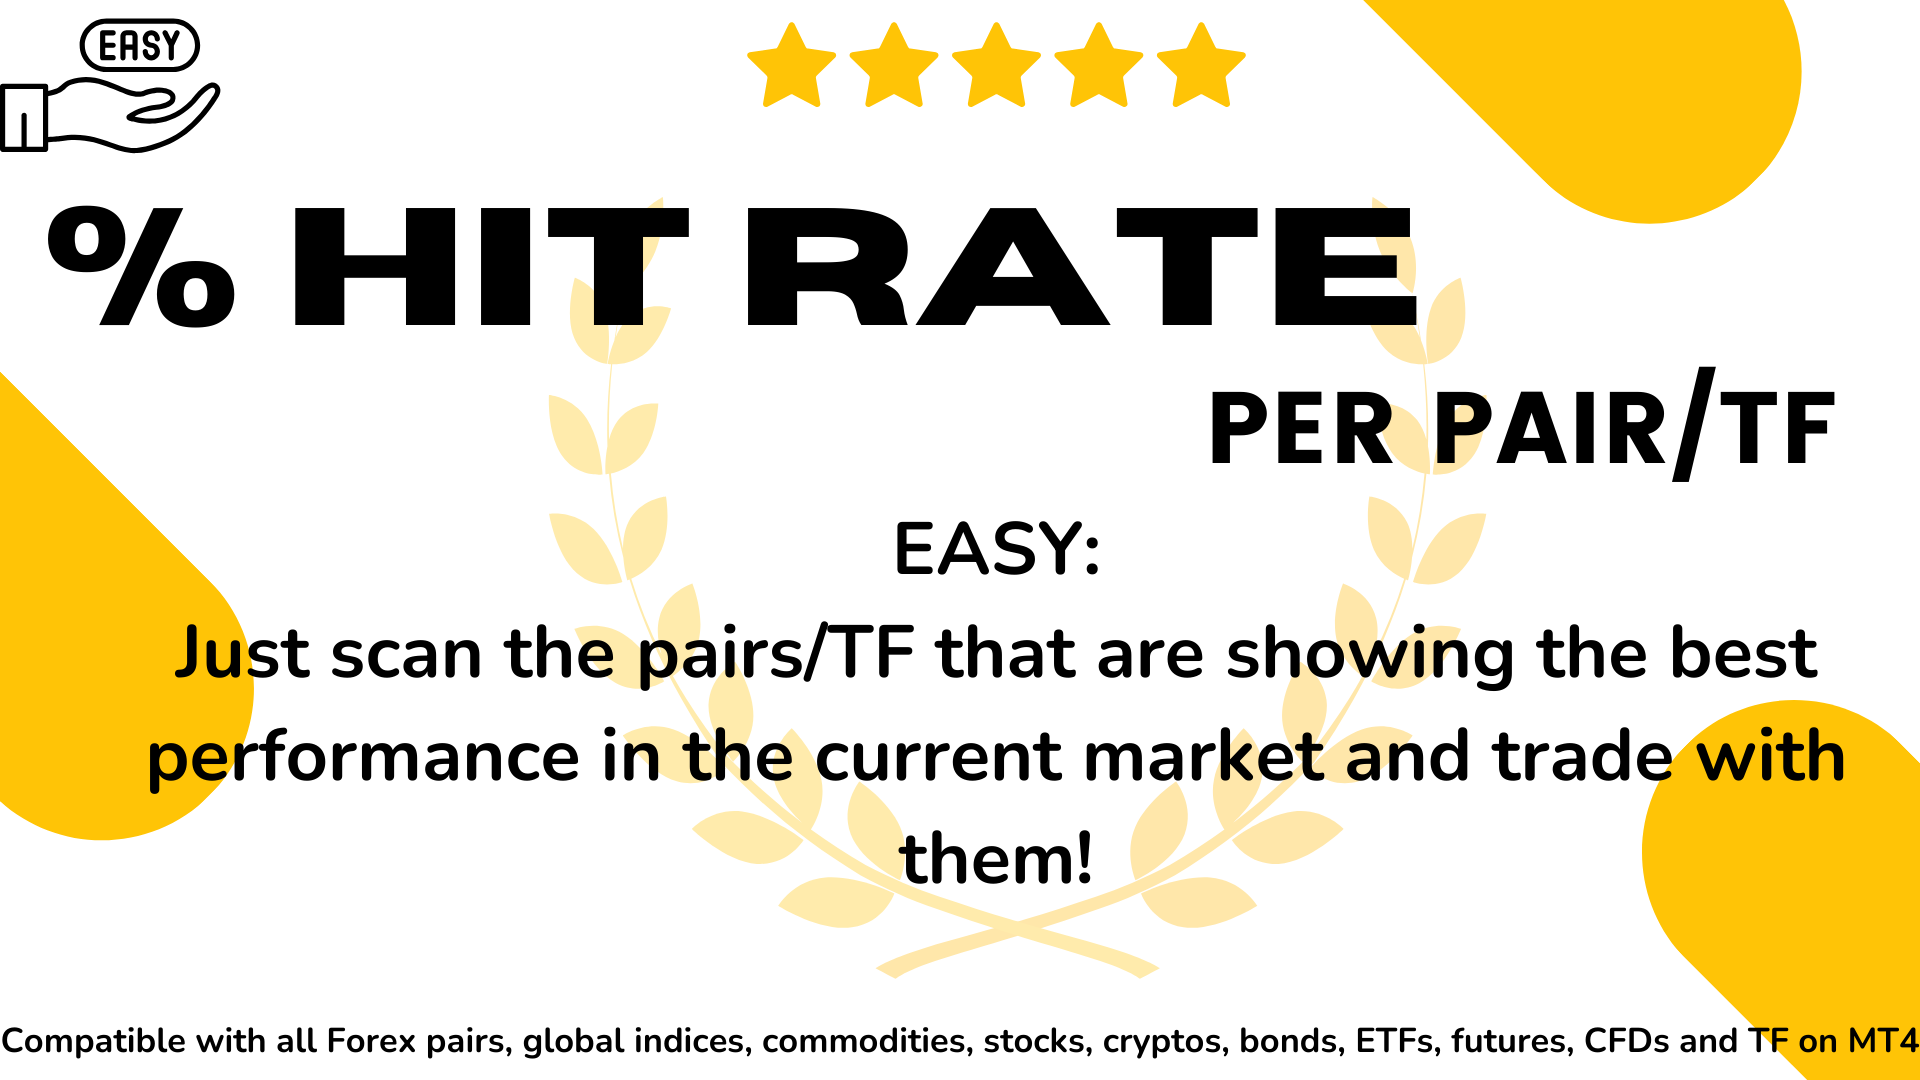
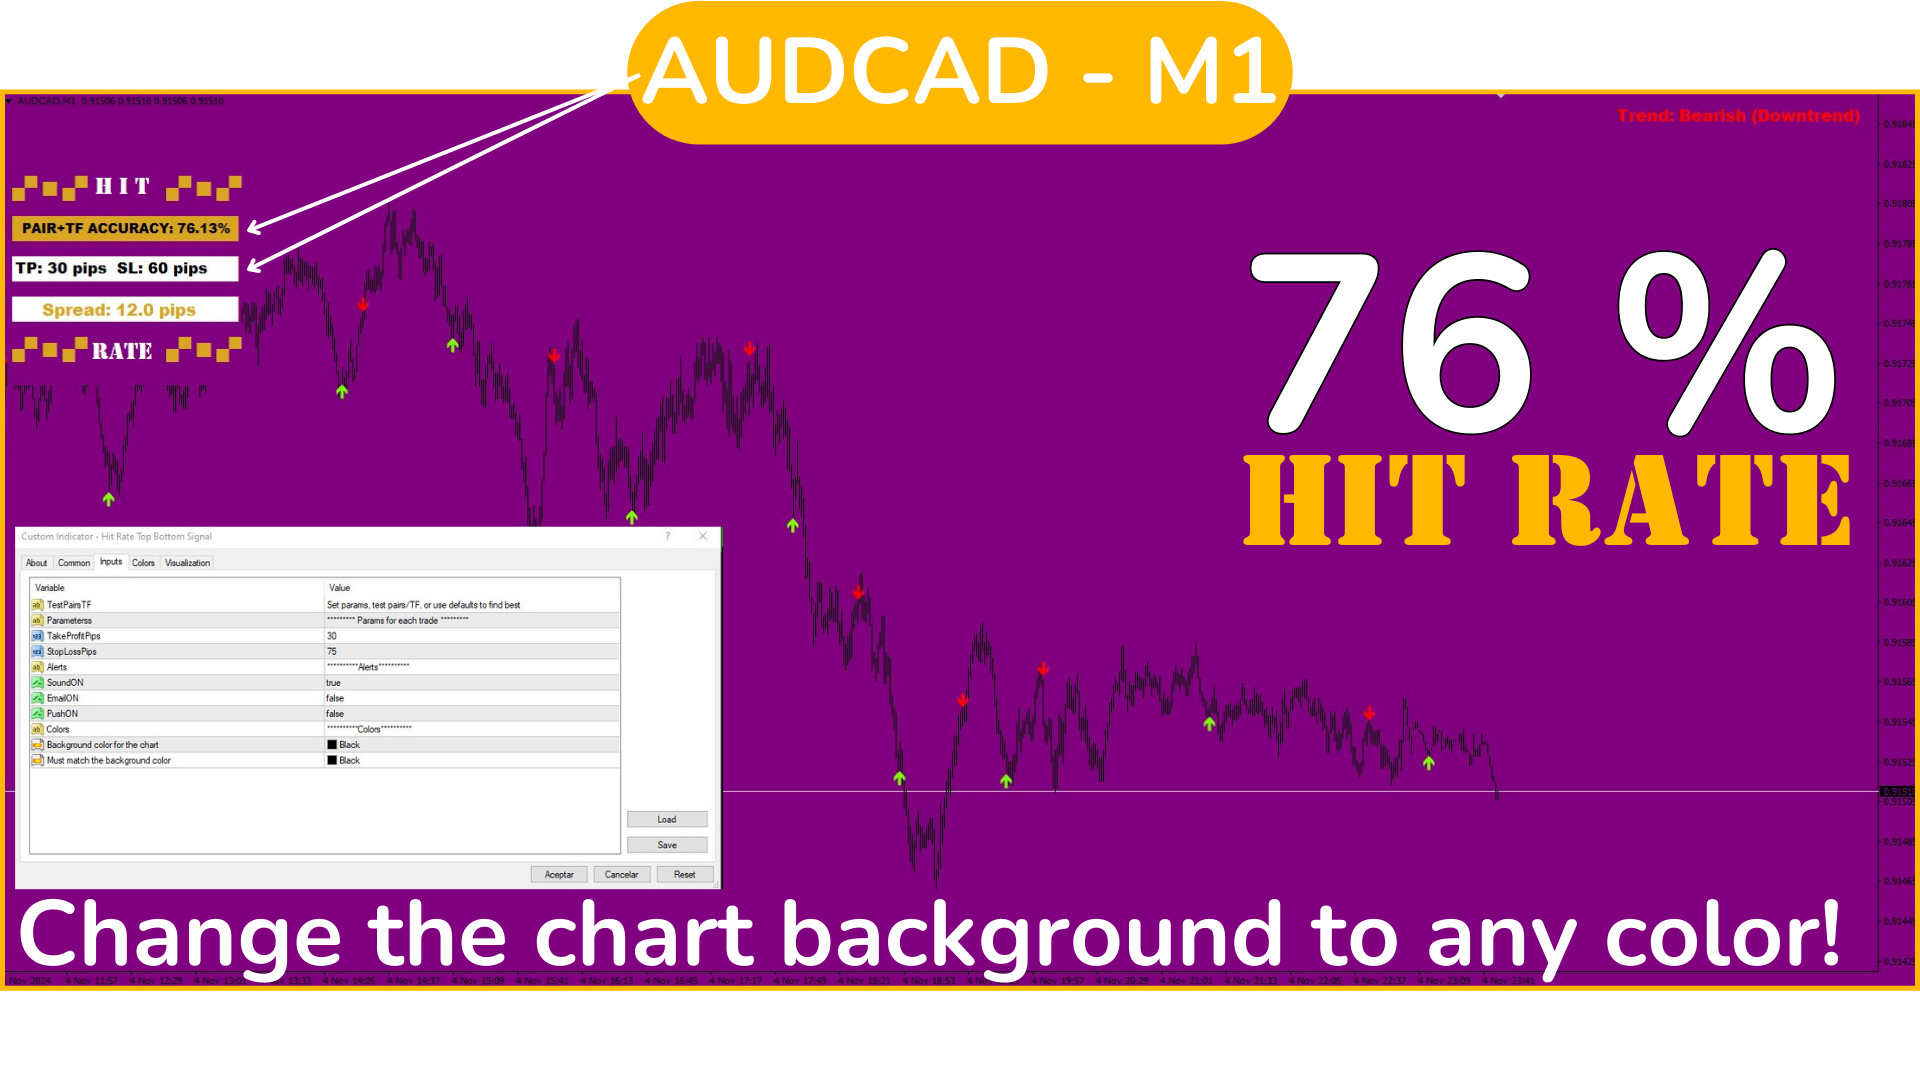
Ouvrez plusieurs paires et chargez l'indicateur sur chacune d'elles. Ensuite, analysez chaque paire pour identifier dans quelles paires et dans quels TF (période) le signal fonctionne le mieux, et concentrez-vous sur celles-ci. (VOIR IMAGES)

Le signal, par défaut, a un TP de 100 pips et un SL de 250 pips, mais vous pouvez définir les valeurs avec lesquelles vous souhaitez trader ou conserver les valeurs par défaut.

Sachez qu'un SL de 250 pips sur H1 n'est pas le même que sur M1, mais ne vous inquiétez pas : en mettant à jour manuellement les paramètres de SL et de TP, le pourcentage de réussite du signal sera recalculé pour ces nouveaux paramètres, vous permettant de connaître à l'avance les résultats attendus avec ces paramètres.

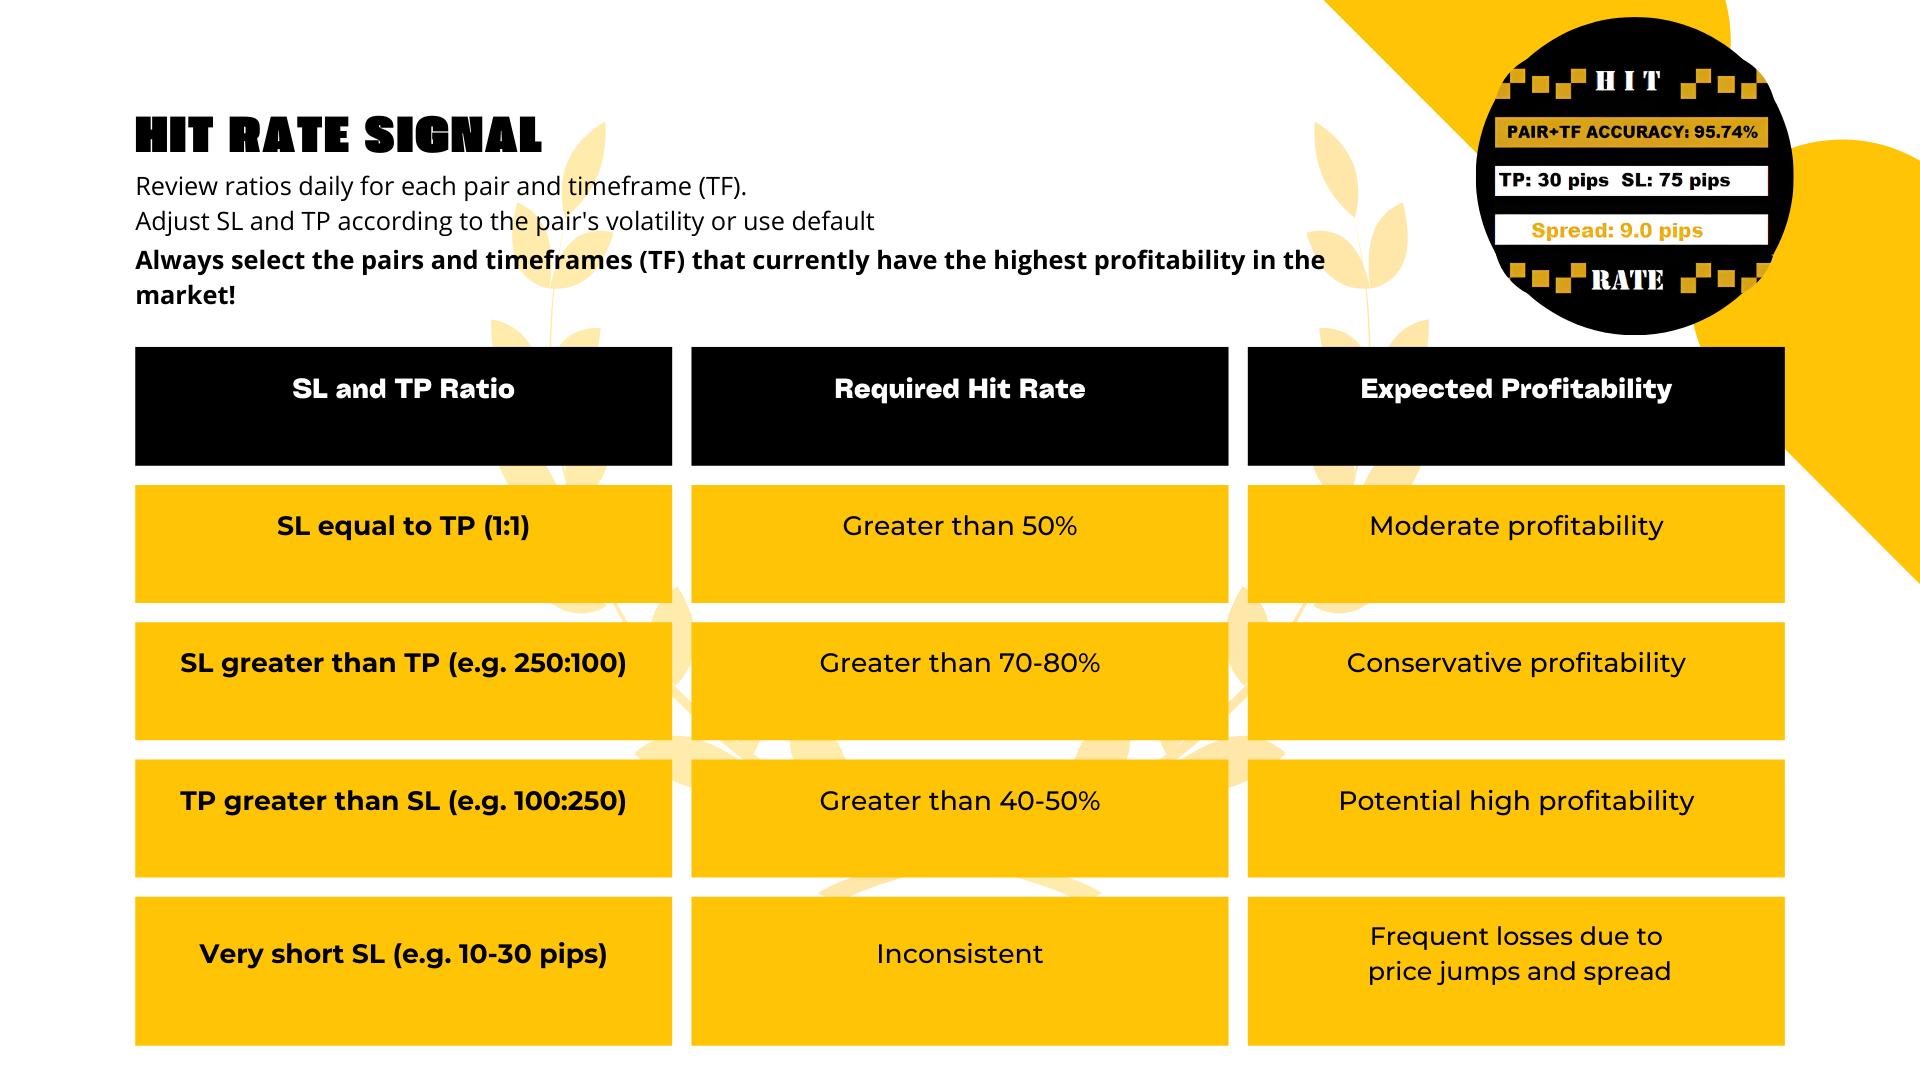
De cette façon, vous pouvez ajuster les paramètres spécifiques de chaque paire pour "optimiser" la stratégie pour cette paire et ce TF, et ainsi connaître le pourcentage de réussite du signal dans ce contexte. Il est recommandé de réaliser ce processus une fois par jour, toujours avant de trader, pour identifier les paires/TF avec la meilleure efficacité au moment actuel. Les paramètres par défaut fonctionnent mieux dans des TF tels que M30 ou H1, selon la paire.

Étape par étape :

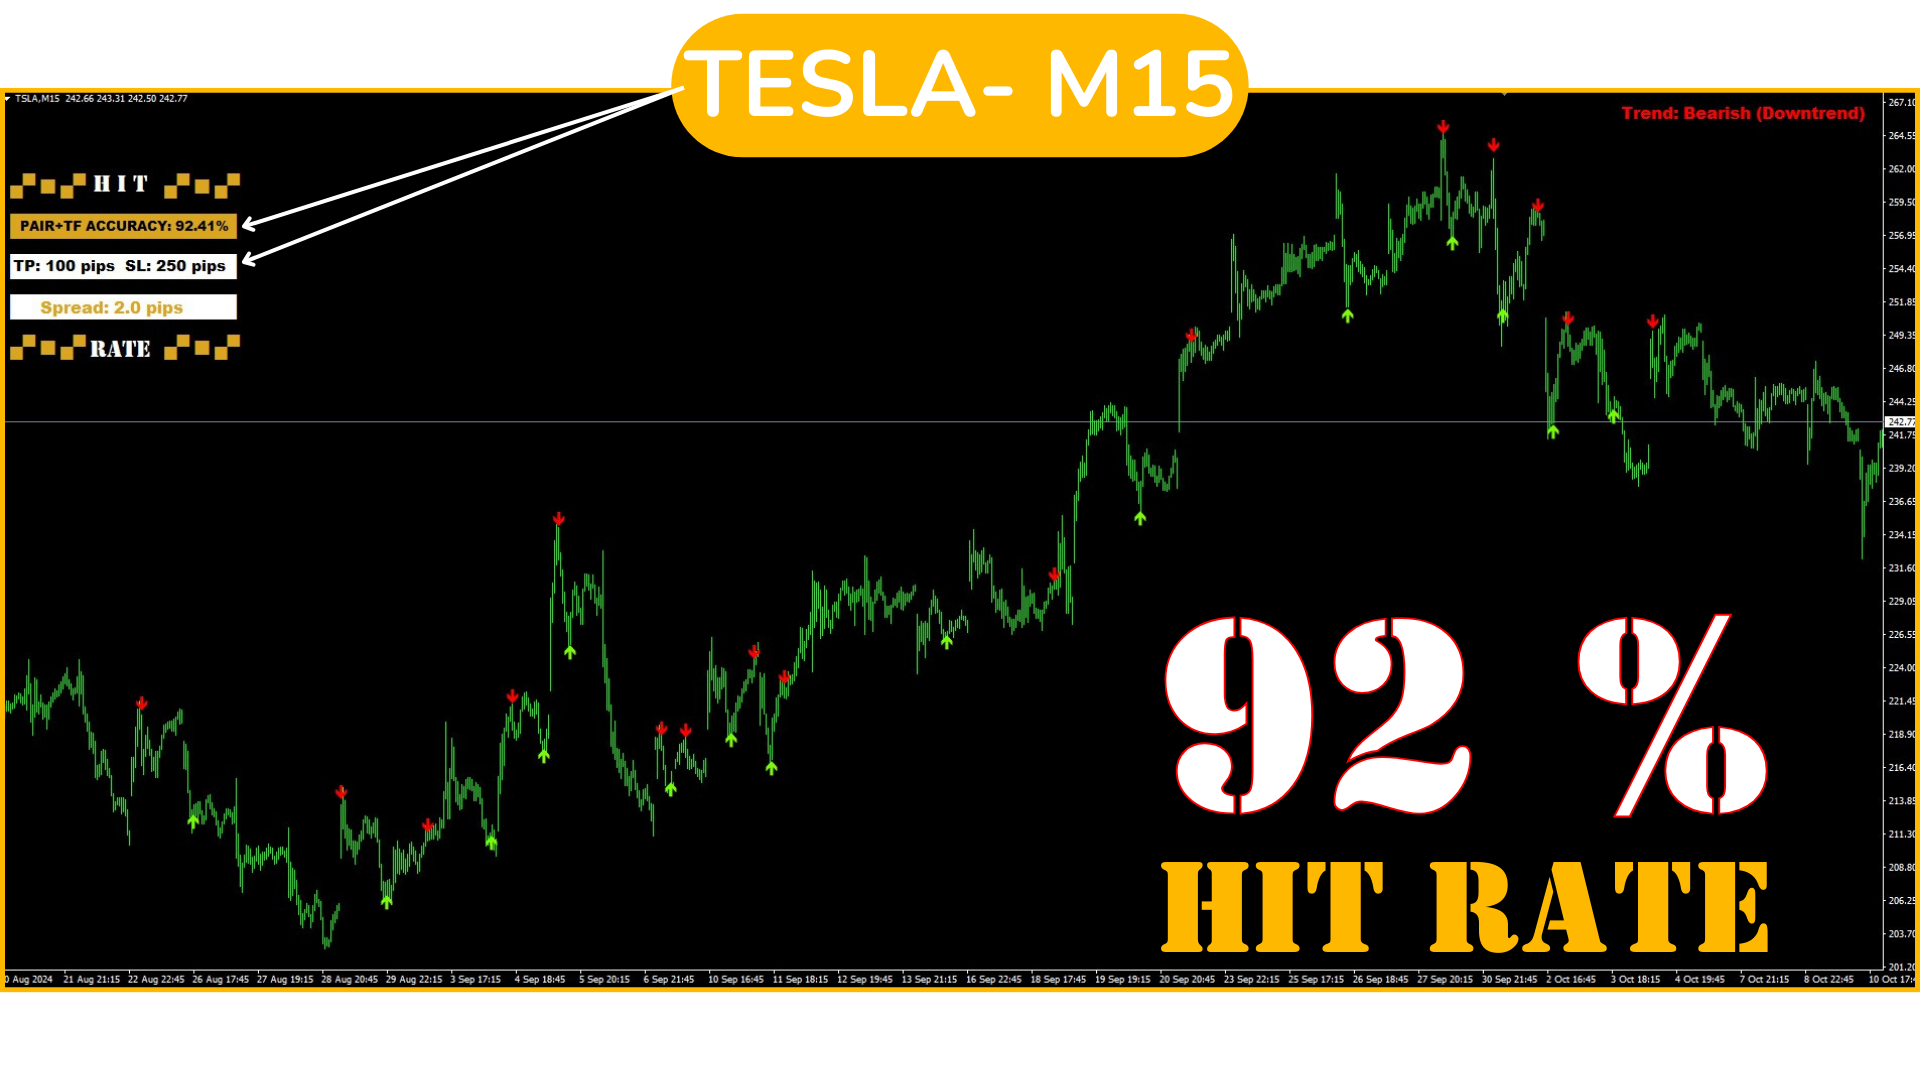
  1. Choisissez une paire et examinez chaque TF. Vérifiez lequel a le pourcentage de réussite le plus élevé, par exemple supérieur à 85-90 % (si vous utilisez les paramètres par défaut de TP et SL). Sélectionnez ce TF. Pour comprendre quel ratio est optimal pour votre stratégie si vous n'utilisez pas les paramètres par défaut de TP et SL, veuillez lire ci-dessous "Ratios entre SL/TP et le pourcentage de réussite".

  2. Répétez la procédure avec toutes les paires disponibles ; plus vous avez de paires ouvertes, plus vous aurez d'opportunités de trading.

  3. Maintenant, il vous suffit d’attendre les signaux et d’ouvrir les opérations dès qu’un signal est émis, en respectant les SL et TP prédéfinis.

  4. Si vous souhaitez choisir les valeurs de TP et SL avec lesquelles vous souhaitez trader, vous devez d'abord modifier les données dans l'onglet "Inputs" et indiquer les valeurs pour chaque paire, toujours en pips. Ensuite, observez chaque TF de cette paire, choisissez celui qui fonctionne le mieux et restez attentif aux signaux.

Trader librement depuis le téléphone :

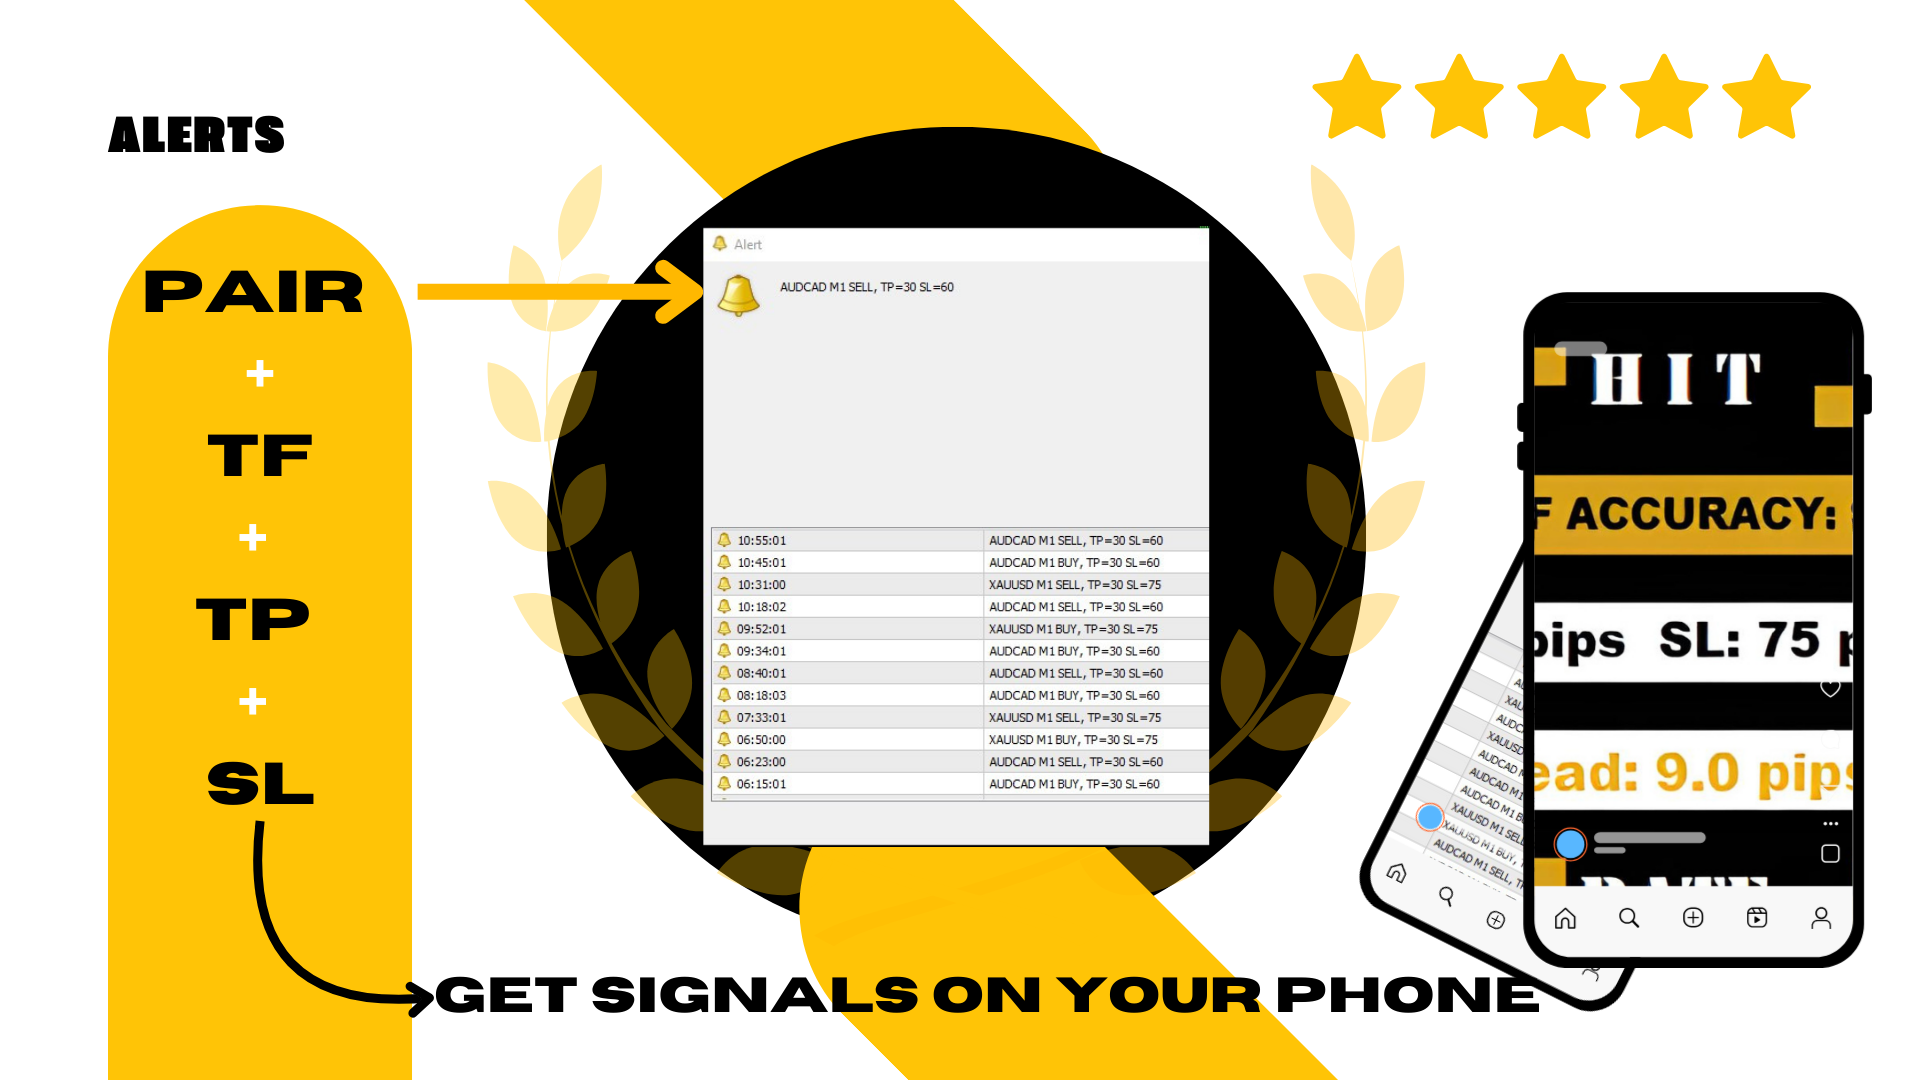
Ce processus "Étape par étape" doit être configuré depuis l'ordinateur, mais vous pourrez ensuite recevoir les notifications de trading sur votre téléphone. Comment ? Assurez-vous que votre téléphone est configuré pour recevoir des messages push sur votre terminal MT4 et autorisez les notifications du terminal depuis votre téléphone.

Lorsqu'un signal est émis, vous recevrez sur votre téléphone : PAIRE - TF - TYPE DE SIGNAL (ACHAT/VENTE) - et les valeurs de TP et SL préalablement configurées pour cette paire.


De cette manière, vous n'avez pas besoin de rester constamment devant l'ordinateur car vous pourrez ouvrir les opérations depuis votre téléphone, placer le SL et le TP de cette paire, et vous libérer du suivi constant.

Pour ceux qui préfèrent trader depuis leur ordinateur, le signal sonore et visuel avec les mêmes données (PAIRE - TF - TYPE DE SIGNAL et valeurs de TP et SL) apparaîtra à l’écran chaque fois qu’un signal est émis pour une paire.


Comprendre les ratios entre SL/TP et le pourcentage de réussite

Le succès d'une stratégie de trading dépend de deux facteurs clés : d'une part, le ratio entre le Stop Loss (SL) et le Take Profit (TP), et d'autre part, le pourcentage de réussite des signaux. Chacun joue un rôle fondamental dans la rentabilité de la stratégie, et comprendre comment ils fonctionnent ensemble est essentiel pour optimiser le système.

1. Ratio SL/TP :

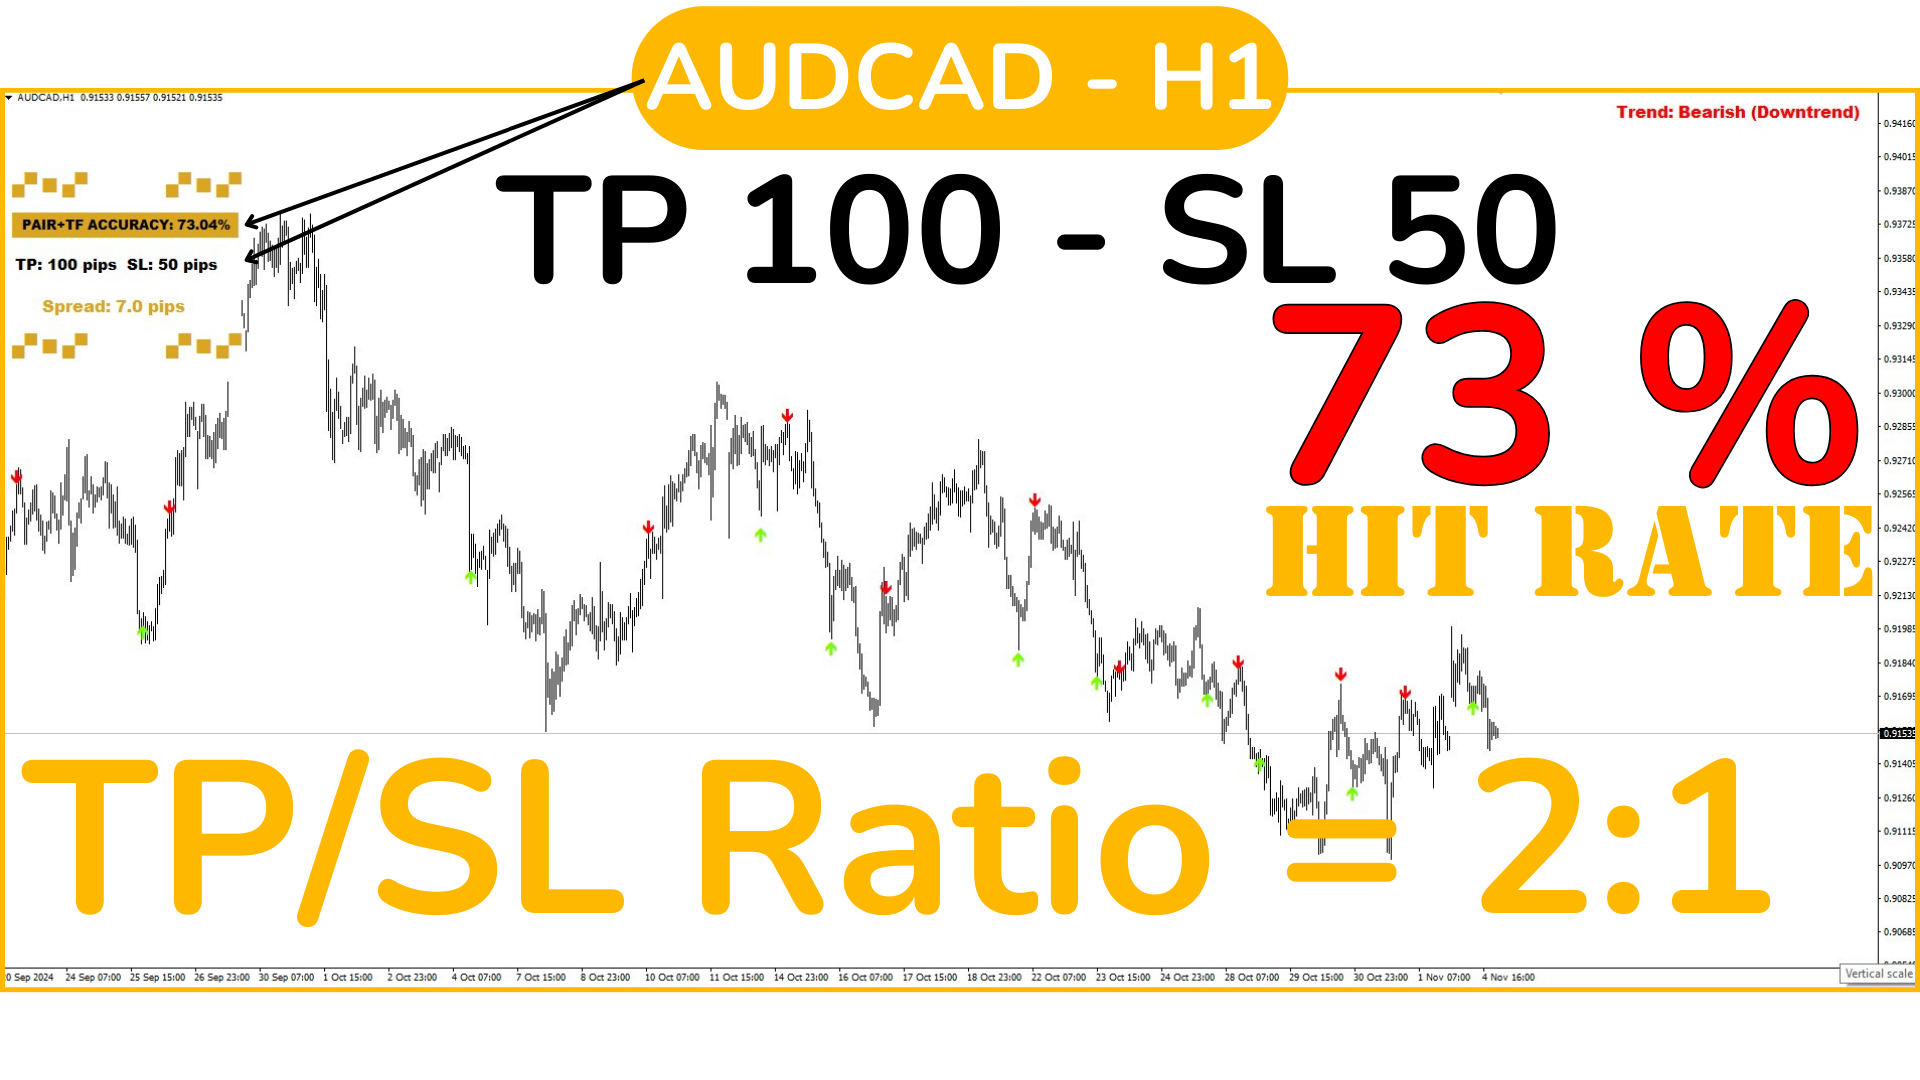
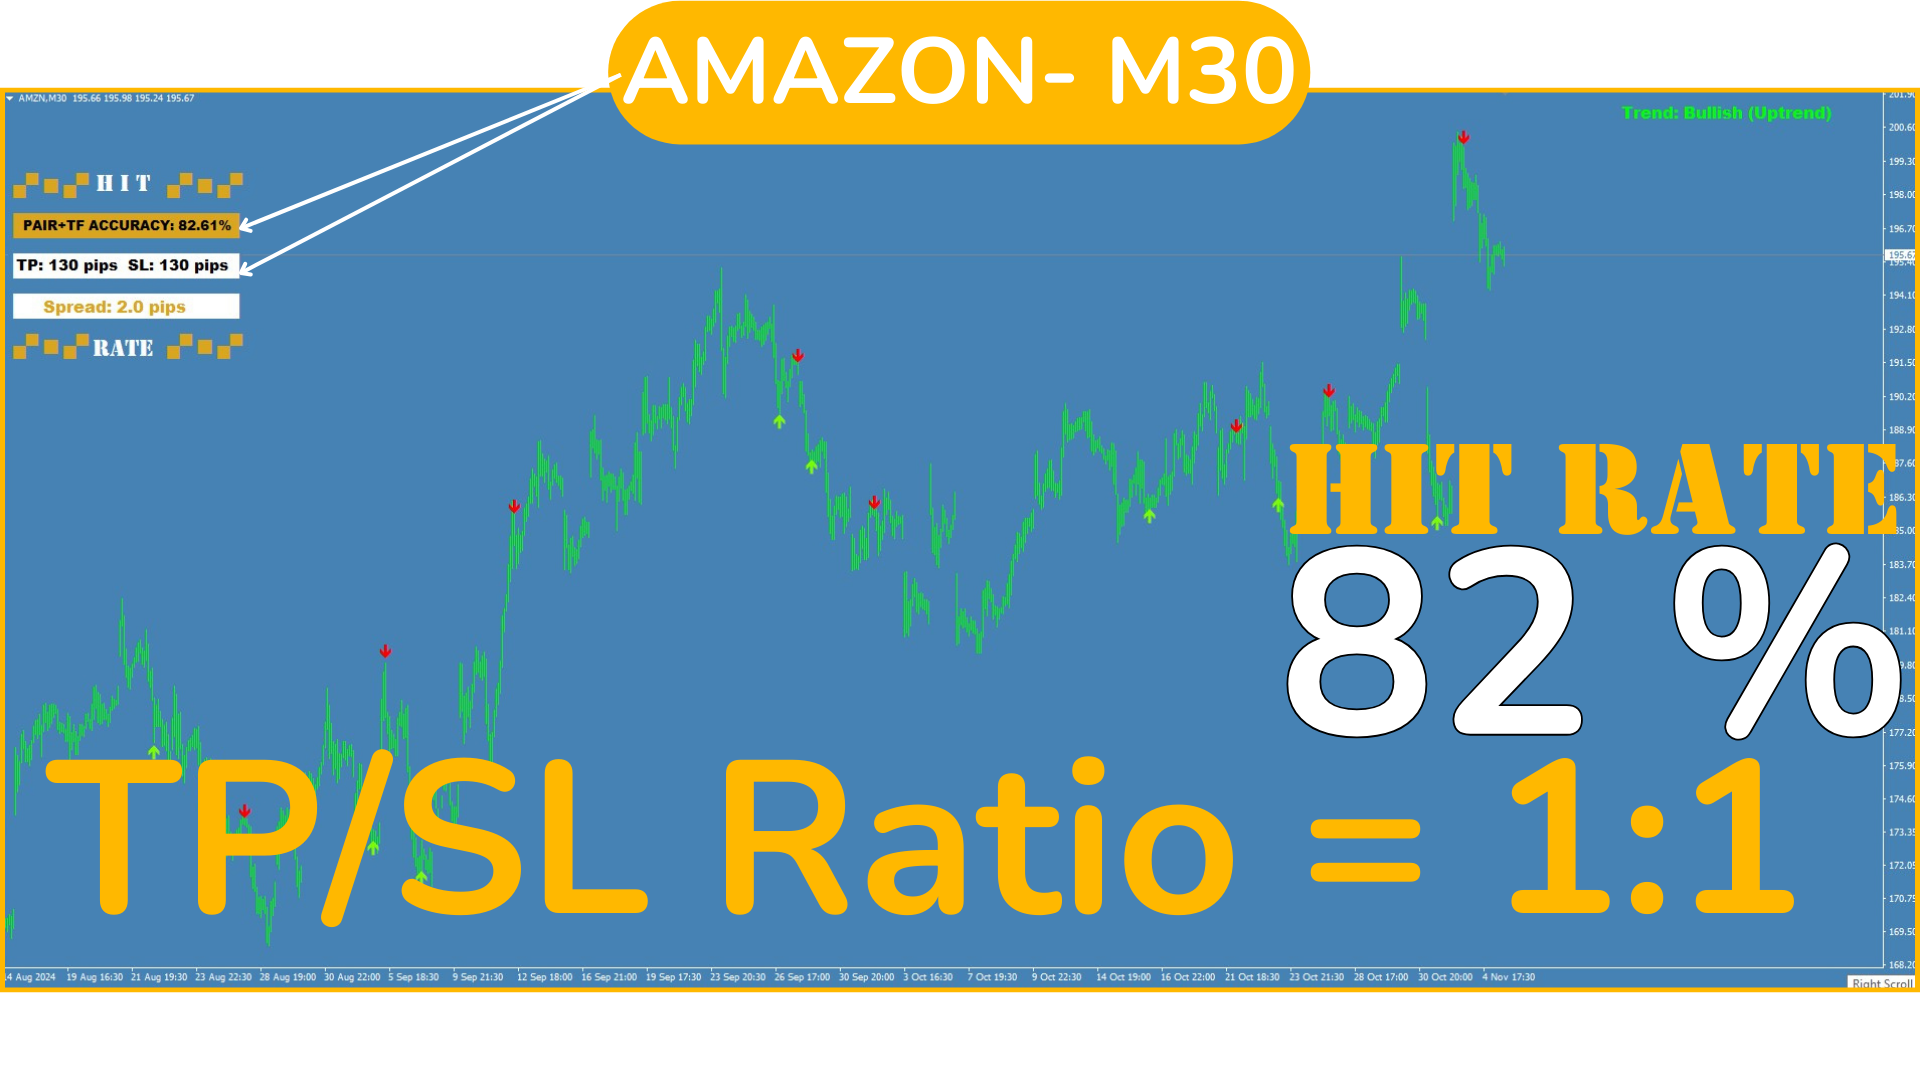
  • Ratio SL/TP de 1:1 : La taille du TP est égale à celle du SL (par exemple, SL : 100 pips et TP : 100 pips). Dans ce cas, la stratégie nécessite un pourcentage de réussite supérieur à 50 % pour être rentable, car les gains et les pertes seront similaires.
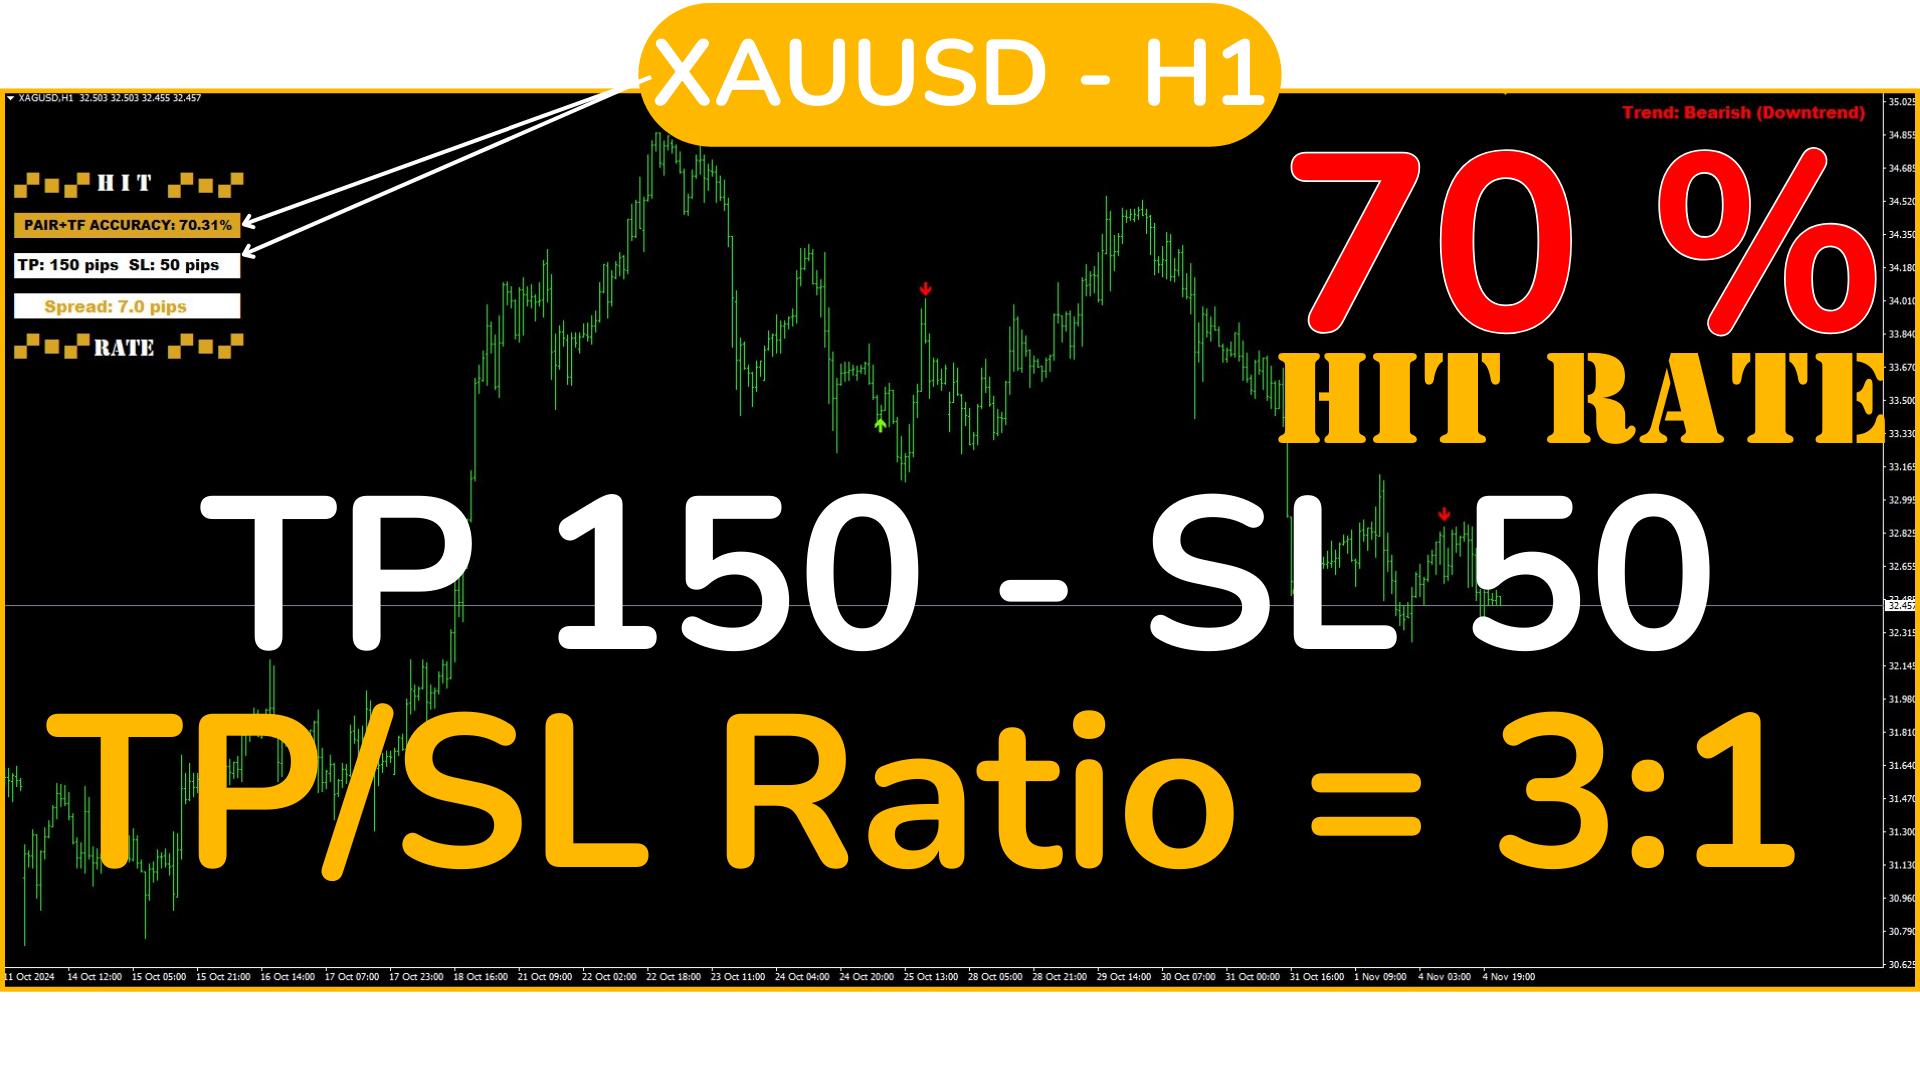
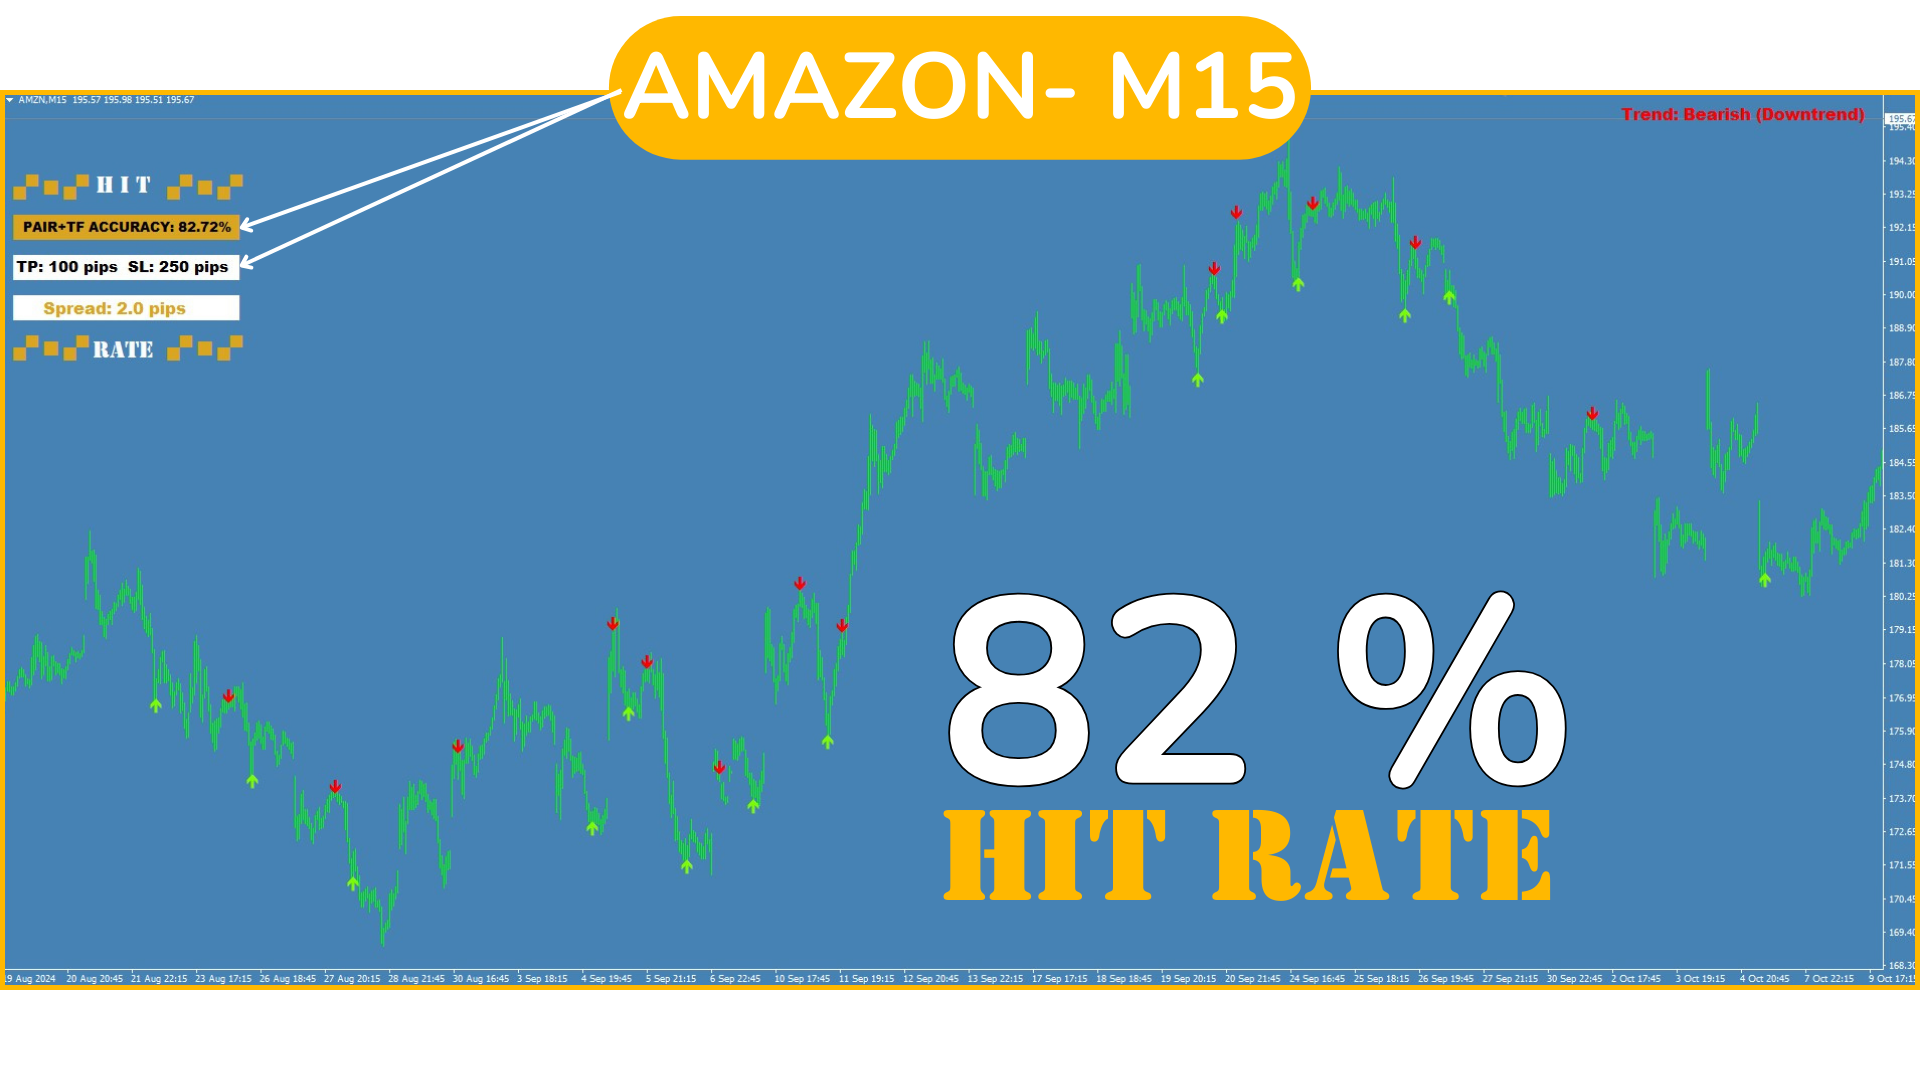
  • SL supérieur au TP : (par exemple, SL : 250 pips et TP : 100 pips), vous avez besoin d'un pourcentage de réussite bien plus élevé pour compenser les pertes lorsque le SL est atteint. Dans ce cas, un pourcentage de réussite supérieur à 70 % ou 80 % est idéal.
  • TP supérieur au SL : (par exemple, TP : 250 pips et SL : 100 pips), la stratégie peut être rentable même avec un pourcentage de réussite plus bas, car chaque gain compensera plusieurs pertes. Ici, un pourcentage de réussite de 40 à 50 % suffirait pour générer des profits.

Dans tous les cas ! Gardez toujours à l'esprit que si un SL est très "court", par exemple 10 à 30 pips, il sera probablement touché fréquemment (pensez au Spread), entraînant des pertes continues sur des opérations qui auraient été gagnantes. Soyez prudent et laissez toujours de l’espace pour que le prix se déplace (un SL généreux).

2. Pourcentage de réussite :

  • Le pourcentage de réussite indique le nombre de fois où le système atteint ses prévisions. Un système avec un pourcentage de réussite élevé (par exemple, 90 %) est plus fiable et permet des ratios SL/TP plus larges (SL supérieur au TP).
  • Un faible pourcentage de réussite ne signifie cependant pas nécessairement des pertes, tant que le TP est bien supérieur au SL. Avec un TP plus grand, même si vous réussissez peu de fois, les gains couvriront les pertes.

    C’EST LA RAISON POUR LAQUELLE CONNAÎTRE À L'AVANCE LE POURCENTAGE DE RÉUSSITE DU SIGNAL EST FONDAMENTAL POUR ATTEINDRE UN RÉSULTAT OPTIMAL AVEC UNE BONNE GESTION DU CAPITAL (SL+TP).


Optimisation selon la paire et le TF :

Chaque paire et période peuvent réagir différemment au même ratio SL/TP, il est donc important d’ajuster le SL et le TP en fonction de la performance de la paire et du TF. Par exemple, pour les paires volatiles ou les TF plus élevés, il peut être judicieux d’utiliser un TP plus large.

Essayez différentes configurations de SL et TP sur chaque paire et TF, et observez le pourcentage de réussite de chacune. Cela vous aidera à trouver l’équilibre optimal pour maximiser les gains et minimiser les pertes.


Exemple d'évaluation de rentabilité :

Imaginons une stratégie avec un SL de 250 pips et un TP de 100 pips. Pour que cette configuration soit rentable, le pourcentage de réussite doit être IDÉALEMENT SUPÉRIEUR À 70%-80%, selon la volatilité et le comportement de la paire spécifique, afin que les gains couvrent les pertes lorsque le SL est atteint.

Cependant, si le ratio est inversé avec un SL de 100 pips et un TP de 250 pips, un pourcentage de réussite de 40 à 50 % pourrait suffire, car chaque opération gagnante compenserait plusieurs pertes.


Résumé :

  • SL supérieur au TP : Un pourcentage de réussite élevé est nécessaire (idéalement supérieur à 70 %).
  • TP supérieur au SL : Peut fonctionner avec un pourcentage de réussite plus bas, autour de 40 à 50 %.
  • Optimisation quotidienne : Vérifiez quotidiennement que le ratio choisi est maintenu pour chaque paire et TF afin d’obtenir la meilleure performance. Si vous remarquez qu'une paire baisse en rendement, répétez le processus "Étape par étape" et redéfinissez la configuration optimale.

Il est important de comprendre que cette stratégie peut être utilisée pour toutes les paires Forex, or, argent, actions, indices et même les cryptos si votre courtier le permet, ainsi que pour tout TF. Il n'est donc pas nécessaire de se limiter à des paires avec : 1- des spreads trop élevés 2- des ratios qui ne correspondent pas à ce que nous recherchons, choisissez parmi les meilleures !


Enfin, rappelez-vous qu'il n'existe pas de configuration idéale unique. En variant les réglages, vous constaterez que différentes configurations peuvent offrir de bons résultats selon la paire et le TF. C'est pourquoi il est important d'avoir un signal clair qui nous avertit quand trader avec les SL et TP correspondants (et testés préalablement), en fournissant
 une analyse en pourcentage du taux de réussite qui fait de Hit Rate TopBottom Signal une stratégie complète. En lisant simplement les données envoyées dans les notifications et en opérant en conséquence, vous aurez la tranquillité de prendre des décisions informées et testées.

Trading sans stress, simple et clair. Sans devinettes ni doutes !


Produits recommandés
Arbitrage Indicators is a professional and easy-to-use Forex trading indicator that uses the best trading principles of the latest AI arbitrage models. This indicator provides accurate buy and sell signals. Applies to currency pairs only. It has six different metrics options, MACD, KDJ, RSI, CCI, RVI, DEMARK. It can be freely switched by users, and intuitively shows the direction and reversal signal of the currency pair. When the two lines cross colors, the currency has a high probability of rev
Alpha Trend sign est notre outil de Trading très populaire depuis longtemps, il valide notre système de Trading et invite clairement les signaux de Trading sans dérive. Fonctions principales: • En fonction de la zone active du marché, selon les indicateurs, il est intuitif de déterminer si le cours actuel appartient à la tendance ou à la tendance. Et coupez le marché selon les flèches d'indication de l'indicateur, les flèches vertes suggèrent d'acheter et les flèches rouges suggèrent de vend
This is the complete REX package. It consists of the lite, pro and ULTRA version.  Perfect for beginners and intermediates. REX complete is 100% non repaint. The strategy is based on a mix of different strategies, statistics, including pivot points, oscillators and patterns.  As the trading idea consists of a variety of some classic indicators like Momentum, Williams Percent Range, CCI, Force Index, WPR, DeMarker, CCI, RSI and Stochastic, it is clear that the fundamental indicators have being u
Chart Patterns Detect 15 patterns (Ascending Triangle, Descending Triangle, Rising Wedge, Falling Wedge, Bullish Flag, Bearish Flag, Bullish Rectangle, Bearish Rectangle Symmetrical triangle, Head and Shoulders, Inverted Head and Shoulders, Triple top, Triple Bottom, Double Top, Double Bottom) Use historical data to calculate the probability of each pattern to succeed (possibility to filter notification according to the chance of success) gives graphic indication about the invalidation level and
Supertrend Professional is an Expert Advisor for MetaTrader 4 based on the Supertrend indicator. It is designed for trend-following trading on German indices (GER30/GER40/DAX). FTMO Compliance The EA implements drawdown calculation according to prop firm rules (FTMO, The Funded Trader, etc.): - Daily Drawdown uses MAX(Balance, Equity) as calculation base, exactly as required by FTMO - Reference balance is automatically updated every day at midnight - Automatic closure of all positions when l
Szia! Egy indikátorral. Több idő gyertyájának kirajzoltatása egy charton. Különböző színek rendelhetők a long és short gyertyákhoz. Vonal vastagsága állítható. A gyertya kitöltése engedélyezhető. Hello! With an indicator. Drawing multiple time candles on a chart. Different colors can be ordered for long and short candles. Line thickness can be adjusted. Filling the candle can be allowed. Videó: https://www.youtube.com/watch?v=-9bequnAw-g&amp ;ab_channel=GyulaKlein
Indicateur Crypto_Forex « Indice FORCE et 2 moyennes mobiles » pour MT4. Aucun changement de style. - Cet indicateur est idéal pour le trading dynamique en direction de la tendance. - L'indicateur « Indice FORCE et 2 moyennes mobiles » vous permet de visualiser les moyennes mobiles rapides et lentes de l'indice Force. - L'indice Force est l'un des meilleurs indicateurs combinant les données de prix et de volume en une seule valeur. - L'indice Force est un oscillateur puissant qui mesure la puis
Preface: First of all, let me introduce myself. I am a programmer and have been working for over 20 years. 2023 has passed, and our studio has achieved a record of 500 times with 7 manual transmissions. Below, we will show you how to do it through a series of operations. The first step is to model. Modeling is to find a fixed trading pattern. I think everyone has heard of a 2/8 probability, and through this probability, we can further refine it, which means that 1 to 4 is the optimal state. We h
The main idea of this indicator is rates analysis and prediction by Fourier transform. Indicator decomposes exchange rates into main harmonics and calculates their product in future. You may use the indicator as a standalone product, but for better prediction accuracy there is another related indicator - FreqoMaster - which uses FreqoMeterForecast as a backend engine and combines several instances of FreqoMeterForecast for different frequency bands. Parameters: iPeriod - number of bars in the ma
Visual Vortex Indicator MT4
AL MOOSAWI ABDULLAH JAFFER BAQER
Unleash the Power of Market Dynamics with the Vortex Indicator! The Visual Vortex Indicator is your advanced tool for decoding market trends, reversals, and momentum shifts. Priced at $65, this indicator provides a comprehensive view of market behavior, but it’s designed for you to fine-tune and optimize it according to your unique trading strategy. What Makes It Unique? The Vortex Indicator is based on a strategy that identifies directional movements and trend strength by analyzing key price d
This indicator is another variant of the famous powerful indicator Fibonacci-SS https://www.mql5.com/en/market/product/10136 but has different behaviour in placing Pending Order and TP Line. Automatically places Fibonacci retracement lines from the last highest and lowest visible bars on the chart with: An auto Pending Order (Buy/Sell). Taking Profit 1, Taking Profit 2 is pivot point and Taking Profit 3 for extended reward opportunity. The best risk and reward ratio. Simple and powerful indicat
This advisor enters the market at the opening of   London Market . It has a automatic function that give buy (arrow up green) and sell (arrow down red) signal when the indicator met high probabilities requirements.Once the signal is generated it is the trader discretions to start the order button and do trade manually. Stop loss are base on ATR. Recommended Take profit is 20pips.  The trading system is suitable for both experienced traders and beginners.  Timeframe is  M5 . Minimum account bal
Stratos Pali
Michela Russo
4.43 (7)
Stratos Pali Indicator   is a revolutionary tool designed to enhance your trading strategy by accurately identifying market trends. This sophisticated indicator uses a unique algorithm to generate a complete histogram, which records when the trend is Long or Short. When a trend reversal occurs, an arrow appears, indicating the new direction of the trend. Important Information Revealed Leave a review and contact me via mql5 message to receive My Top 5 set files for Stratos Pali at no cost! Dow
The indicator provides a superior alternative to price action analysis. It enables the identification of normalized patterns, which are then transformed into a graphical representation to forecast future steps within a time series. In the top-left corner, you'll find information regarding the expected prediction accuracy, determined through a complex MSQE calculation. You have the flexibility to adjust the time window, making it easy to validate the indicator's performance. Additionally, you can
True SnD
Indra Lukmana
5 (1)
This Supply & Demand indicator uses a unique price action detection to calculate and measures the supply & demand area. The indicator will ensure the area are fresh and have a significant low risk zone. Our Supply Demand indicator delivers functionality previously unavailable on any trading platform. Trading idea You may set pending orders along the supply & demand area. You may enter a trade directly upon price hit the specific area (after a rejection confirmed). Input parameters Signal - Set
Simple to read and powerful, no fancy lines and drawings to clutter your chart or distract you. The trend probability oscillator estimates how likely a trend will continue in a certain period. The cummulator period controls how many bars in the past to use and is a proxy for the timescale the trend probability should hold. The use of a Max Line improves this further by indicating when a trend is likely to reverse. In most cases a trend must lose momentum before reversing. Hence, a trend probabil
Indicateurs clés des prix de la zone d'offre et de demande arrière-plan Le système recherche automatiquement les zones d'offre et de demande dans la ligne K et trace des lignes de prix clés en temps réel. Les traders peuvent négocier en fonction des lignes de négociation de prix. Caractéristiques principales Le système recherche automatiquement les zones d'offre et de demande dans la ligne K. Le système tracera également des lignes de prix clés en temps réel, et les traders pourront négocier en
Watch the Clock
David Leander Tschacher
Watch the Clock shows a clock at a desired position. The clock is useful if you want to check when a candle closes. You can also set an alert to be prepared before the news. ️ Watch the Clock works also in the strategy tester. ️ Watch the Clock requires a minimum of CPU power. ️ Watch the Clock can improve your manual style of trading. Inputs Alert -> At which time should the alert occur? Time Shift in Minutes -> Should the time be incremented by x minutes? Size -> The font size of the tim
MACD Divergence
Sergey Deev
2.5 (2)
The indicator detects divergence signals - the divergences between the price peaks and the MACD oscillator values. The signals are displayed as arrows in the additional window and are maintained by the messages in a pop-up window, e-mails and push-notifications. The conditions which formed the signal are displayed by lines on the chart and in the indicator window. Indicator Parameters MacdFast - fast MACD line period MacdSlow - slow MACD line period MacdSignal - MACD signal line period MacdPric
Dynamic Forex28 Navigator
Bernhard Schweigert
4.43 (7)
Dynamic Forex28 Navigator - L'outil de trading Forex de nouvelle génération. ACTUELLEMENT 49 % DE RÉDUCTION. Dynamic Forex28 Navigator est l'évolution de nos indicateurs populaires de longue date, combinant la puissance de trois en un : Advanced Currency Strength28 Indicator (695 avis) + Advanced Currency IMPULSE avec ALERT (520 avis) + CS28 Combo Signals (Bonus). Détails sur l'indicateur https://www.mql5.com/en/blogs/post/758844 Qu'offre l'indicateur de force de nouvelle génération ? Tout
Indicateur Crypto_Forex « Morning Star » pour MT4. - L'indicateur « Morning Star » est un indicateur très performant pour le trading Price Action : sans refonte, sans délai. - L'indicateur détecte les figures haussières Morning Star sur le graphique : signal de flèche bleue (voir images). - Alertes PC, mobile et e-mail. - Son homologue baissier « Evening Star » est également disponible (suivez le lien ci-dessous). - L'indicateur « Morning Star » est idéal pour combiner les niveaux de support e
ZhiBiMACD MT4
Qiuyang Zheng
4.5 (2)
This is a unique MACD indicator that is more accurate and easy to use than traditional MACD. It is suitable for any chart cycle and is suitable for any market variety. The red column is the (Buy) band signal, and the blue column is the (Sell) band signal. The yellow and green lines are trend lines, and the two lines never cross. Buy: In the blue column, look at the green line up through the middle 0 axis. Sell: In the red column, look at the yellow line down the middle 0 axis. The MACD's de
The indicator identifies two most important patterns of technical analysis - Pin Bar and Engulfing. MT5-version  https://www.mql5.com/en/market/product/53701 Settings: Mincandle size for PinBar - The minimum size of the Pin-Bar candlestick; Percentage of candle body on size - The percentage of the candle body in relation to its length; PinBar Alert - Alert when a Pin-Bar is detected; PinBar Mail - Sends an email when a Pin Bar is found; PinBar Notification - Sends a push notification when a Pin
ECM Elite Channel is a volatility-based indicator, developed with a specific time algorithm, which consists of finding possible corrections in the market. This indicator shows two outer lines, an inner line (retracement line) and an arrow sign, where the channel theory is to help identify overbought and oversold conditions in the market. The market price will generally fall between the boundaries of the channel. If prices touch or move outside the channel, it's a trading opportunity. The ind
Nomen Magic Candle
Noomen Ben Khadimallah Khadimallah
Nomen Magic Candle – Fini le chaos sur vos graphiques ! Indicateur MT4 Sans Repaint L'attente est enfin terminée. Il est temps de révolutionner votre écran. Bienvenue sur le « Magic Chart » . Profitez de lignes tracées avec une clarté absolue pour une stratégie de trading de haute précision. Propulsé par une analyse de marché algorithmique moderne, cet outil décrypte précisément les zones de liquidité cachées, vous offrant ainsi l'avantage invisible et décisif sur la masse. Vous sentez-vous é
PABT Pattern Indicator - it's classical system one of the signal patterns. Indicator logic - the Hi & Lo of the bar is fully within the range of the preceding bar, look to trade them as pullback in trend. In the way if indicator found PABT pattern it's drawing two lines and arrow what showing trend way.  - First line - it's entry point and drawing at: 1. On the high of signal bar or on middle of the signal bar (depending from indicator mode) for buy; 2. On the low of signal bar or on middle of t
RQL Trend Board – Description RQL Trend Board   is a simple but powerful multi-timeframe trend dashboard. It shows the current market bias across several timeframes at the same time, using an internal trend-classification method. Each timeframe is displayed as a colored box:   Green   – bullish bias → look for   long   setups   Yellow   – ranging / unclear →   no trade zone   Red   – bearish bias → look for   short   setups The indicator gives a clear   overall picture   of where the
FREE
VR Cub
Vladimir Pastushak
VR Cub est un indicateur permettant d'obtenir des points d'entrée de haute qualité. L'indicateur a été développé pour faciliter les calculs mathématiques et simplifier la recherche de points d'entrée dans un poste. La stratégie de trading pour laquelle l'indicateur a été rédigé prouve son efficacité depuis de nombreuses années. La simplicité de la stratégie de trading est son grand avantage, qui permet même aux traders débutants de négocier avec succès avec elle. VR Cub calcule les points d'ouve
Spirit mt4
Alena Snigireva
5 (1)
Spirit mt4 is an indicator that works without flashing, the signals are triggered after the arrow at the beginning of the next candle Includes several indicators for overbought and oversold levels. Works with any currency pair: EUR/USD, AUD/USD and others. After the purchase, send me a private message and I will send you the settings that I use for this indicator. Suitable for trading cryptocurrencies. I like to trade cryptocurrency more, so I use it more there. It can also be used for bi
Distinctive
Tatiana Savkevych
Distinctive is a forex trending arrow indicator for identifying potential entry points. I like it, first of all, because it has a simple mechanism of work, adaptation to all time periods and trading tactics. Created on the basis of a regression channel with filters. Plotting the Lawrence indicator signals on a price function chart using a mathematical approach. How it works - when the price breaks out in the overbought / oversold zone (channel levels), a buy or sell signal is generated. Everyt
Les acheteurs de ce produit ont également acheté
Indicateur Miraculous – Outil Forex et Binaire 100% Non-Repaint Basé sur le Carré de Neuf de Gann Cette vidéo présente l' Indicateur Miraculous , un outil de trading très précis et puissant, spécifiquement développé pour les traders du Forex et des Options Binaires . Ce qui rend cet indicateur unique est sa fondation sur le légendaire Carré de Neuf de Gann et la Loi de Vibration de Gann , en faisant l'un des outils de prévision les plus précis disponibles dans le trading moderne. L'Indicateur Mi
Precautions for subscribing to indicator This indicator only supports the computer version of MT4 Does not support MT5, mobile phones, tablets The indicator only shows the day's entry arrow The previous history arrow will not be displayed (Live broadcast is for demonstration) The indicator is a trading aid Is not a EA automatic trading No copy trading function The indicator only indicates the entry position No exit (target profit)  The entry stop loss point is set at 30-50 PIPS Or the front hi
El indicador "MR BEAST ALERTAS DE LIQUIDEZ" es una herramienta avanzada diseñada para proporcionar señales y alertas sobre la liquidez del mercado basándose en una serie de indicadores técnicos y análisis de tendencias. Ideal para traders que buscan oportunidades de trading en función de la dinámica de precios y los niveles de volatilidad, este indicador ofrece una visualización clara y detallada en la ventana del gráfico de MetaTrader. Características Principales: Canal ATR Adaptativo: Calcula
Fxland Price Reversal Zones (MT4) FXLAND Smart Reversal Indicator is a professional technical analysis tool designed to help traders identify potential price reversal zones and key market turning points with clarity and precision. The best reversal indicator and price return by choosing only one ceiling or floor in each time frame A masterpiece of combining mathematics and Gann, fractal matrix, Fibonacci, movement angle and time. Completely intelligent Key Features Detects potential pr
PairMaster Buy Sell Arrow Indicator for MT4 Trade Reversals Like a Pro — Catch Every Swing Point with Precision The PairMaster Buy Sell Arrow Indicator is a powerful MetaTrader 4 tool built to identify high-probability swing trading opportunities . Designed for traders who value accuracy, clarity, and simplicity, PairMaster detects key market turning points and plots intuitive buy and sell arrows directly on your chart. Key Features Accurate Swing Point Detection – Automatically identifies ma
VTrende Pro mt4
Andrii Diachenko
3 (2)
VTrende Pro MT4 - MTF indicator for trend trading with a display panel for MT5 *** Videos can be translated into any language using subtitles (video language - Russian) Although the signals of the VTrende Pro indicator can be used as signals of a full-fledged trading system, it is recommended to use them in conjunction with the Bill Williams TS. VTrende Pro  MT4 is an extended version of the VTrende indicator. Difference between Pro version and VTrende: - Time zones - Signal V - signal 1-2 wave
Rtc ML Ai Predictor MT4
Muhammad Faisal Sagala
Rtc ML Ai | Predictor CORE MACHINE LEARNING ENGINE Adaptive ML Market Predictor – Multi-Bar Trend & Candle Forecast What This Indicator Does This indicator is a  real-time market prediction engine  designed to analyze price behavior and estimate  future market tendencies . Unlike conventional indicators, this system  does not rely on static parameters or historical curve-fitting , but adapts its internal state dynamically during live market operation. Instead of using static rules, the indic
FFx Engulfing Setup Alerter gives trade suggestions with Entry, Target 1, Target 2 and StopLoss. Below are the different options available: Entry suggestion - pips to be added over the break for the entry 3 different options to calculate the SL - by pips, by ATR multiplier or at the pattern High/Low 3 different options to calculate the 2 TPs - by pips, by ATR multiplier or at Risk/Reward Offset the dashboard - any place on the chart Remove the suggestion once the price reached the SL line Lines
FFx InsideBar Setup Alerter gives trade suggestions with Entry, Target 1, Target 2 and StopLoss. Below are the different options available: Entry suggestion - pips to be added over the break for the entry Minimum candle size - to avoid too close buy/sell entry suggestions 3 different options to calculate the SL - by pips, by ATR multiplier or at the pattern High/Low 3 different options to calculate the 2 TPs - by pips, by ATR multiplier or at Risk/Reward Offset the dashboard - any place on the c
FFx OutsideBar Setup Alerter gives trade suggestions with Entry, Target 1, Target 2 and StopLoss. Below are the different options available: Entry suggestion - pips to be added over the break for the entry. 3 different options to calculate the SL - by pips, by ATR multiplier or at the pattern High/Low. 3 different options to calculate the 2 TPs - by pips, by ATR multiplier or at Risk/Reward. Offset the dashboard - any place on the chart. Remove the suggestion once the price reached the SL line.
FFx PinBar Setup Alerter gives trade suggestions with Entry, Target 1, Target 2 and StopLoss. Below are the different options available: Entry suggestion - pips to be added over the break for the entry Minimum candle size - to avoid too small candles 3 different options to calculate the SL - by pips, by ATR multiplier or at the pattern High/Low 3 different options to calculate the 2 TPs - by pips, by ATR multiplier or at Risk/Reward Offset the dashboard - any place on the chart Remove the sugges
Automatic, live & interactive picture of all trendlines. Assign push, email and sound alerts to the lines of your choice and be informed about price rollback, breakout, rollback after breakout, number of rollbacks, line expiration by double breakout. Correct, drag or delete the lines and interactively tune the line system. https://youtu.be/EJUo9pYiHFA . Chart examples https: //www.mql5.com/en/users/efficientforex Price Interaction Events All events are effective immediately and only after one
The purpose of this new version of the MT4 standard indicator provided in your platform is to display in a sub-window multiple timeframes of the same indicator with its divergences. See the example shown in the picture below. But the display isn't like a simple MTF indicator. This is the real display of the indicator on its timeframe. Here's the options available in the FFx divergences indicator: Select the timeframes to be displayed (M1 to Monthly) Define the width (number of bars) for each tim
The purpose of this new version of the MT4 standard indicator provided in your platform is to display in a sub-window multiple timeframes of the same indicator with its divergences. See the example shown in the picture below. But the display isn't like a simple MTF indicator. This is the real display of the indicator on its timeframe. Here's the options available in the FFx divergences indicator: Select the timeframes to be displayed (M1 to Monthly). Define the width (number of bars) for each ti
The FFx Dashboard MTF alerter will show you on a single chart all the timeframes (M1 to Monthly) with their own status for the indicator. 2 Alert Options: Single timeframe: each selected timeframe alert separately when a signal occurs Multi timeframes: all selected timeframes must agree for an alert to be triggered Both options have an input to select the timeframes to be used for the alert(s). How to Understand the Status: Green/Red square: histogram above/below 0 line Green square + Red bord
The FFx Dashboard MTF alerter will show you on a single chart all the timeframes (M1 to Monthly) with their own status for the indicator. 2 Alert Options: Single timeframe: each selected timeframe alert separately when a signal occurs Multi timeframes: all selected timeframes must agree for an alert to be triggered Both options have an input to select the timeframes to be used for the alert(s). How to understand the status: Green/Red square: RSI above/below 50 line Green square + Red border: R
The FFx Dashboard MTF alerter will show you on a single chart all the timeframes (M1 to Monthly) with their own status for the indicator. 2 Alert Options: Single timeframe: each selected timeframe alert separately when a signal occurs Multi timeframes: all selected timeframes must agree for an alert to be triggered Both options have an input to select the timeframes to be used for the alert(s). How to understand the status: Green/Red square: Stoch above/below 50 line Green square + Red border:
The FFx Dashboard MTF alerter will show you on a single chart all the timeframes (M1 to Monthly) with their own status for the indicator. 2 Alert Options: Single timeframe: each selected timeframe alert separately when a signal occurs Multi timeframes: all selected timeframes must agree for an alert to be triggered Both options have an input to select the timeframes to be used for the alert(s). How to understand the status: Green/Red square: Price above/below Cloud (Kumo) Green square + Red bo
The FFx Dashboard MTF alerter will show you on a single chart all the timeframes (M1 to Monthly) with their own status for the indicator. 2 Alert Options: Single timeframe: each selected timeframe alert separately when a signal occurs Multi timeframes: all selected timeframes must agree for an alert to be triggered Both options have an input to select the timeframes to be used for the alert(s). How to understand the status: Green/Red square: MA pointing Up/Down Green square + Red border: MA po
The FFx Dashboard MTF alerter will show you on a single chart all the timeframes (M1 to Monthly) with their own status for the indicator. 2 Alert Options: Single timeframe: each selected timeframe alert separately when a signal occurs. Multi timeframes: all selected timeframes must agree for an alert to be triggered. Both options have an input to select the timeframes to be used for the alert(s). How to understand the status: Green square: Price above PSAR Red square: Price below PSAR Options
The FFx Dashboard MTF alerter will show you on a single chart all the timeframes (M1 to Monthly) with their own status for the indicator. 2 Alert Options: Single timeframe: each selected timeframe alert separately when a signal occurs Multi timeframes: all selected timeframes must agree for an alert to be triggered Both options have an input to select the timeframes to be used for the alert(s). How to understand the status: Green/Red square: CCI above/below levels (ie. 100/-100) Grey square: C
The FFx Dashboard MTF alerter will show you on a single chart all the timeframes (M1 to Monthly) with their own status for the indicator. 2 Alert Options: Single timeframe: each selected timeframe alert separately when a signal occurs Multi timeframes: all selected timeframes must agree for an alert to be triggered Both options have an input to select the timeframes to be used for the alert(s). How to understand the status: Green/Red square: ADX above level Grey square: ADX below level Red bor
The FFx Dashboard MTF alerter will show you on a single chart all the timeframes (M1 to Monthly) with their own status. 2 Alert Options: Single timeframe: each selected timeframe alert separately when a signal occurs Multi timeframes: all selected timeframes must agree for an alert to be triggered Both options have an input to select the timeframes to be used for the alert(s). How to understand the status: Green/Red square: bullish/bearish candle Options available in the FFx Dashboard Alerter
The [GRAFF] III manual trading system is based on multiple MetaTrader (MT4) indicators. Together, the entire PACK of GRAFF III indicators makes an advanced trading tool. The system consists of over 20 different custom-built indicators which have been carefully selected and tested in the long term to produce strong and efficient trading signals. The particular indicators are based on different mathematical formulas, so the entire system is calibrated to remove false signals from its own indicator
FFx Universal Strength Meter PRO is more than a basic strength meter. Instead of limiting the calculation to price, it can be based on any of the 19 integrated strength modes + 9 timeframes. With the FFx USM, you are able to define any period for any combination of timeframes. For example, you can set the dashboard for the last 10 candles for M15-H1-H4… Full flexibility! Very easy to interpret... It gives a great idea about which currency is weak and which is strong, so you can find the best pai
A simplistic indicator informing a user on RSI divergence by sending messages to mobile device and email. The indicator draws 2 vertical lines, marking two RSI extrema that formed the divergence. You get the alert, open the charts and make a decision. The indicator does not show past divergences, thus when you attach it to a chart for the first time you see nothing. Graphics and alerts will appear as soon as divergences do. Drop it in Tester to see how it works. Parameters: RSIPeriod - number of
Pan PrizMA CD Phase is an analogue of the МetaТrader 5 indicator , and is an option based on the Pan PrizMA indicator. Details . Averaging by a quadric-quartic polynomial increases the smoothness of lines, adds momentum and rhythm. Extrapolation by the sinusoid function near a constant allows adjusting the delay or lead of signals. The value of the phase - wave status parameter (which is close in meaning to the trigonometric phase or the angle of the radius-vector rotation in the trigonometric p
Plus de l'auteur
HFT Fast M1 Gold Scalper V8 EA
Martin Alejandro Bamonte
2.33 (3)
VERSION ULTRA-OPTIMISÉE – MT4 HFT FAST M1 GOLD SCALPER V8.2 , dans sa version MT4, est la version la plus puissante, stable et aboutie à ce jour. HFT est un scalpeur haute fréquence qui négocie exclusivement l'or (XAUUSD) sur l’unité de temps M1, exécutant un grand nombre de trades chaque jour. Il prend en charge un effet de levier allant jusqu'à 1:500 et fonctionne avec des tailles de lot très raisonnables , adaptées à une véritable stratégie de scalping. Pour cette raison, il nécessite des com
HFT Fast M1 Gold Scalper MT5 EA
Martin Alejandro Bamonte
2.11 (9)
HFT AI FAST SCALPER V10.1 La version la plus avancée de notre EA à ce jour, entièrement reconstruite avec prise de décision basée sur l’IA , vote multi-IA et logique de trading dynamique . Désormais, il n’est plus limité uniquement à XAUUSD (Or) en M1, mais prend également en charge BTCUSD et ETHUSD , avec des entrées haute fréquence, une gestion intelligente du risque et une adaptabilité totale. Cet EA combine des IA gratuites connectées via OpenRouter avec des filtres avancés pour un tradin
Indicateur NextCandlePredictor NextCandlePredictor, un indicateur de signal avec alerte qui ne repeint pas, ne change pas de couleur, ne bouge pas, ne disparaît pas et n'a pas de retard. Il vous aidera à identifier la direction des prochaines bougies dans n'importe quelle période. Hautement recommandé pour les marchés à forte volatilité comme New York, Londres ou même le chevauchement des deux. Caractéristiques Principales: Polyvalence dans les Périodes de Temps: Fournit des signaux rapides et p
Candle Probability Scalper
Martin Alejandro Bamonte
Guide d'utilisation du Candle Probability Scalper Ce indicateur rend le scalping facile et 100% intuitif. Candle Probability Scalper vous montrera en un coup d'œil les pourcentages de force des acheteurs et des vendeurs en TEMPS RÉEL sur la bougie actuelle. Les pourcentages sont mis à jour à chaque tick, ce qui signifie que vous saurez, seconde après seconde, ce que fait la majorité des acheteurs et des vendeurs, sans aucun délai. Cela vous aidera énormément à déterminer ou à confirmer la force
Aurum Apex Mt4 EA
Martin Alejandro Bamonte
5 (2)
Vous pouvez maintenant télécharger la version démo d'Aurum Apex depuis l'onglet Commentaires pour évaluer ses performances en direct sur votre propre broker ! Aurum Apex EA est un puissant outil de trading automatique à 100 % conçu pour la plateforme MT4. Il analyse le marché en temps réel et détecte diverses opportunités de trading. Adapté à tous les niveaux de traders, Aurum Apex EA propose trois modes de risque ajustables via le paramètre de Risque : Risque = 0.1 (Risque Faible) : Idéal pour
Scalping Signal NO Repaint NO Lag
Martin Alejandro Bamonte
3 (2)
"Scalping Signal No Repaint No Lag" est le seul indicateur sur le marché qui, lorsqu'il est glissé sur n'importe quel graphique, charge automatiquement tous les indicateurs nécessaires sans avoir besoin de charger un modèle ou d'autres indicateurs. Il configure automatiquement le graphique pour qu'il ressemble exactement à l'image fournie. Cet indicateur garantit des signaux sans redessiner ni retard, ce qui le rend idéal pour les stratégies de scalping sur toutes les paires de devises et toute
Clear Breakout
Martin Alejandro Bamonte
5 (2)
L'indicateur "Breakout Buy-Sell" est conçu pour identifier et mettre en évidence des opportunités d'achat et de vente potentielles basées sur les ruptures de prix pendant différentes sessions de marché (Tokyo, Londres et New York). Cet indicateur aide les traders à visualiser clairement les zones d'achat et de vente, ainsi que les niveaux de take-profit (TP) et de stop-loss (SL). Stratégie d'utilisation L'indicateur peut être utilisé comme suit : Configuration initiale : Sélectionnez la session
GbpUsd Pip Hunter EA
Martin Alejandro Bamonte
GBPUSD Pip Hunter EA Caractéristiques principales : Optimisé pour GBPUSD sur le timeframe M15 : Spécifiquement conçu et testé pour la paire GBPUSD sur un graphique de 15 minutes. Taille de compte minimum recommandée : Nécessite un solde de compte minimum de $1000 pour assurer de faibles tirages. Compatibilité des spreads : Mieux utilisé avec des comptes à faible spread ou ECN pour maximiser la rentabilité. Gestion des risques : Inclut une option pour désactiver la fonction de lot exponentiel en
L'indicateur MTFMA (Moyennes Mobiles Multi-Temps) utilise plusieurs moyennes mobiles (MA) dans différentes unités de temps pour fournir des signaux d'achat et de vente (qui ne repeignent pas) dans une fenêtre séparée du graphique principal. Il est polyvalent et facile à interpréter, adapté à la fois au scalping sur des unités de temps plus petites et au trading à plus long terme sur des unités de temps plus grandes. Pourquoi est-il Multiframe ? Le terme multiframe fait référence à la capacité de
L'indicateur "MultiSymbol & TF Chart Integrated" est conçu pour fournir rapidement une vue complète du marché, vous permettant de surveiller jusqu'à 60 paires de devises dans les délais de votre choix sur un seul graphique (mode multiple) ou de voir la paire que vous négociez sur tous les TF (mode simple). Avantages Principaux: Surveillance Complète: Permet la surveillance en temps réel de toutes les paires souhaitées sur un seul graphique en un coup d'œil. Gain de Temps: Évite la nécessité de b
Pairs and TF Changer
Martin Alejandro Bamonte
Êtes-vous fatigué de passer d'un graphique à l'autre pour surveiller différentes paires de devises et périodes ? L'indicateur Pairs and TF Changer est là pour révolutionner votre expérience de trading ! Une fois que vous avez chargé tous les indicateurs pour votre stratégie, ajoutez Pairs and TF Changer au graphique. Si nécessaire, vous pouvez ensuite ajuster sa position, ses couleurs ou le nombre de colonnes qu'il affiche ! Caractéristiques clés : Intégration transparente : Intégrez cet indicat
GO Trend MultiTimeFrame
Martin Alejandro Bamonte
Indicateur GoTrend Multi-Timeframe L'indicateur "GoTrend Multi-Timeframe" est un outil essentiel pour les traders à la recherche d'un moyen rapide et efficace d'évaluer les tendances générales et spécifiques d'une paire de devises sur différentes périodes. Cet indicateur permet aux traders d'obtenir une vue claire et complète de la direction du marché en un coup d'œil, optimisant ainsi la prise de décision et améliorant l'efficacité de leurs stratégies de trading. Caractéristiques Principales: A
Gold Vertex EA
Martin Alejandro Bamonte
Gold Vertex EA est une option fiable et stable pour ceux qui cherchent à automatiser leur trading sur le marché de l'or. Avec un système robuste basé sur l'un des indicateurs les plus efficaces et une stratégie de suivi de tendance solide, Gold Vertex EA est un outil puissant pour les traders souhaitant opérer avec précision et sans stress. Exigences Plateforme : MetaTrader 4 Actifs pris en charge : Développé et configuré spécifiquement pour l'Or (XAUUSD) Compte recommandé : ECN ou à faible spre
Inferno Signals EA
Martin Alejandro Bamonte
Inferno Signals EA est conçu pour tirer parti des mouvements les plus significatifs du marché, en opérant sur la solide unité de temps M30. Il est idéal pour ceux qui cherchent à commencer avec un petit capital initial, à partir de seulement 100 $ par paire, avec une gestion automatique du capital incluant des ajustements dynamiques des lots et des niveaux de sécurité tels que le Stop-Loss (SL). Avec une faible drawdown et une stratégie axée sur la capture des meilleures opportunités, Inferno Si
MarketPrice Indicator
Martin Alejandro Bamonte
L’indicateur MarketPrice est conçu pour fournir une visualisation rapide permettant de voir d’un seul coup d'œil la direction de la tendance d'une paire de devises sur tous les intervalles de temps (Time Frames), facilitant la prise de décision. MarketPrice Indicator se base sur des niveaux quotidiens et des signaux de trading fondés sur des croisements de moyennes mobiles et la force du marché selon divers indicateurs techniques. Il est entièrement configuré, mais vous pouvez bien sûr modifier
Last 50 Pips
Martin Alejandro Bamonte
L'indicateur Last 50 Pips est conçu pour identifier rapidement des opportunités d'achat et de vente basées sur le comportement récent des prix. Il mesure la variation des prix sur les dernières bougies pour mettre en évidence en jaune les moments où le prix peut changer de direction. Signal d'achat : Vous devez ouvrir une position d' ACHAT lorsque l'indicateur passe du ROUGE au JAUNE , ce qui suggère un passage d'une tendance baissière à une tendance haussière. Veuillez consulter les images pou
FlashPoints Breakout
Martin Alejandro Bamonte
Chaque jour au début du marché, Flashpoints Breakout examine les niveaux de pivot, de support et de résistance en utilisant les données de la veille (plus haut, plus bas et clôture) pour calculer deux niveaux de breakout (haussier et baissier). De cette manière, vous disposez dès le matin des nouveaux niveaux d'entrée, ainsi que des valeurs de Take Profit (TP) et de Stop Loss (SL), ce qui vous permet de placer des ordres d'achat stop ou de vente stop sans calculs supplémentaires. Avec Flashpoint
Buy Sell Magic Signal
Martin Alejandro Bamonte
BUYSELLMAGIC is a non-repainting signal-type trading indicator designed to precisely detect entry points in the market.  Features Reliable and permanent signals : BUYSELLMAGIC signals are final once the candle closes, ensuring they will not be modified or removed from the chart. This gives you the confidence of working with an indicator that keeps its signals stable and trustworthy. Comprehensive alerts : In addition to signals on the chart, you’ll receive notifications via email, pop-up alerts
Automatic Fibonacci Pivots
Martin Alejandro Bamonte
Automatic Fibonacci Pivots automatically calculates pivot levels and support/resistance based on Fibonacci, clearly showing key reference points that indicate potential reversal or trend continuation zones, as well as buy and sell areas . Designed for traders seeking clarity on charts without having to recalculate and manually place Fibonacci levels each time. Once set up on your computer, it will send an alert to your phone when a potential buy/sell signal is issued, allowing you to trade direc
M1 Easy Scalper
Martin Alejandro Bamonte
4 (3)
M1 EASY SCALPER est un indicateur de scalping conçu spécifiquement pour l'unité de temps de 1 minute (M1), compatible avec toutes les paires de devises ou instruments disponibles sur votre terminal MT4. Bien sûr, il peut également être utilisé sur n'importe quelle autre unité de temps, mais il fonctionne particulièrement bien en M1 (ce qui est complexe !) pour le scalping. Note : si vous faites du scalping, assurez-vous d’avoir un compte adapté à cet effet. Évitez les comptes Cent ou Standard ca
Trade Insights Display
Martin Alejandro Bamonte
Trade Insights Display is the ideal companion for traders who want to operate with clarity and precision. This indicator provides real-time access to critical account data, such as: Balance Equity Margin Spread Swap Remaining time for the current candle . These data points are essential, regardless of the strategy or other indicators you use. Having this indicator always visible allows you to quickly assess your account status, the swap for each pair (helping you avoid high-cost trades), and the
EuroGeddon EA
Martin Alejandro Bamonte
EUROGEDDON EA – Performance Inégalée avec Risque Contrôlé EUROGEDDON EA est un robot de trading 100% automatique basé sur une INTELLIGENCE ADAPTATIVE , conçu pour faire croître les petits comptes en toute stabilité, tout en gardant un contrôle total sur votre capital. Avec une taille de lot de 0,01 pour chaque 200 $ sur le compte, il fonctionne avec un risque très faible et maintient un drawdown minimal , avec une performance exceptionnelle que vous devez découvrir par vous-même. Téléchar
ZeroLag TrendCandle Signal
Martin Alejandro Bamonte
ZeroLag TrendCandle — Système de coloration des bougies et d'alertes en temps réel (Sans Repainting) ZeroLag TrendCandle est un outil de détection de tendance en temps réel qui applique une coloration des bougies sans repaint basée sur une analyse avancée de l’indicateur Williams Percent Range (WPR). Il détecte les changements de tendance, les variations de momentum et les retournements potentiels via un système de couleurs dynamique — permettant aux traders de comprendre immédiatement la dire
Candle Fusion Pro
Martin Alejandro Bamonte
Candle Fusion Pro — Reconnaissance de figures + Filtre de tendance + Filtre de momentum (Sans repaint) Détectez des figures puissantes de chandeliers japonais et confirmez leur fiabilité avec une analyse de tendance et de momentum en temps réel. Candle Fusion Pro est l’outil visuel ultime pour les traders qui s’appuient sur la précision du price action , la structure des tendances et les confirmations multi-niveaux . Fonctionnalités principales Entrée basée sur les figures : Détecte plus de 10
ClearView Trend Finder
Martin Alejandro Bamonte
ClearView Trend Finder — Tu vois comme c'est clair ? As-tu déjà eu l’impression que ton graphique est trop chargé ? Trop d’indicateurs, de signaux contradictoires et de lignes qui ne font que compliquer l’analyse ? ClearView Trend Finder élimine totalement ce désordre visuel et te permet de te concentrer sur ce qui compte vraiment : la tendance claire . Ce système transforme ton graphique en une vue épurée et précise, sans jamais repeindre ni se modifier. Chaque bougie est filtrée pour n’affic
ARIA Connector EA
Martin Alejandro Bamonte
2.53 (30)
ARIA CONNECTOR relie MetaTrader 5 aux modeles d'intelligence artificielle les plus avances au monde, transformant l'analyse IA de pointe en decisions de trading reelles, de maniere entierement automatisee. QUOI DE NEUF DANS LA V5 ? 12 fournisseurs d'IA, plus de 75 modeles (dont 4 fournisseurs accessibles depuis la Chine) Modeles d'IA gratuits disponibles (OpenRouter, Zhipu GLM-4-Flash) Vote Multi-IA : interrogez jusqu'a 16 IA simultanement, ne tradez que lorsqu'elles sont d'accord 4 modes de t
Ai FGS EA
Martin Alejandro Bamonte
1 (1)
This EA is a private edition developed for traders who are part of our advanced testing and support program. It offers early access to selected configurations and system updates that will later be integrated into the main public release. Only users who have previously communicated with our team and received confirmation should proceed with the purchase. The EA operates using our latest optimization logic and is intended for professional traders who understand the importance of running control
Filtrer:
Aucun avis
Répondre à l'avis