Hit Rate Top Bottom Signal

Hit Rate Top Bottom Signal

Hit Rate Top Bottom Signal

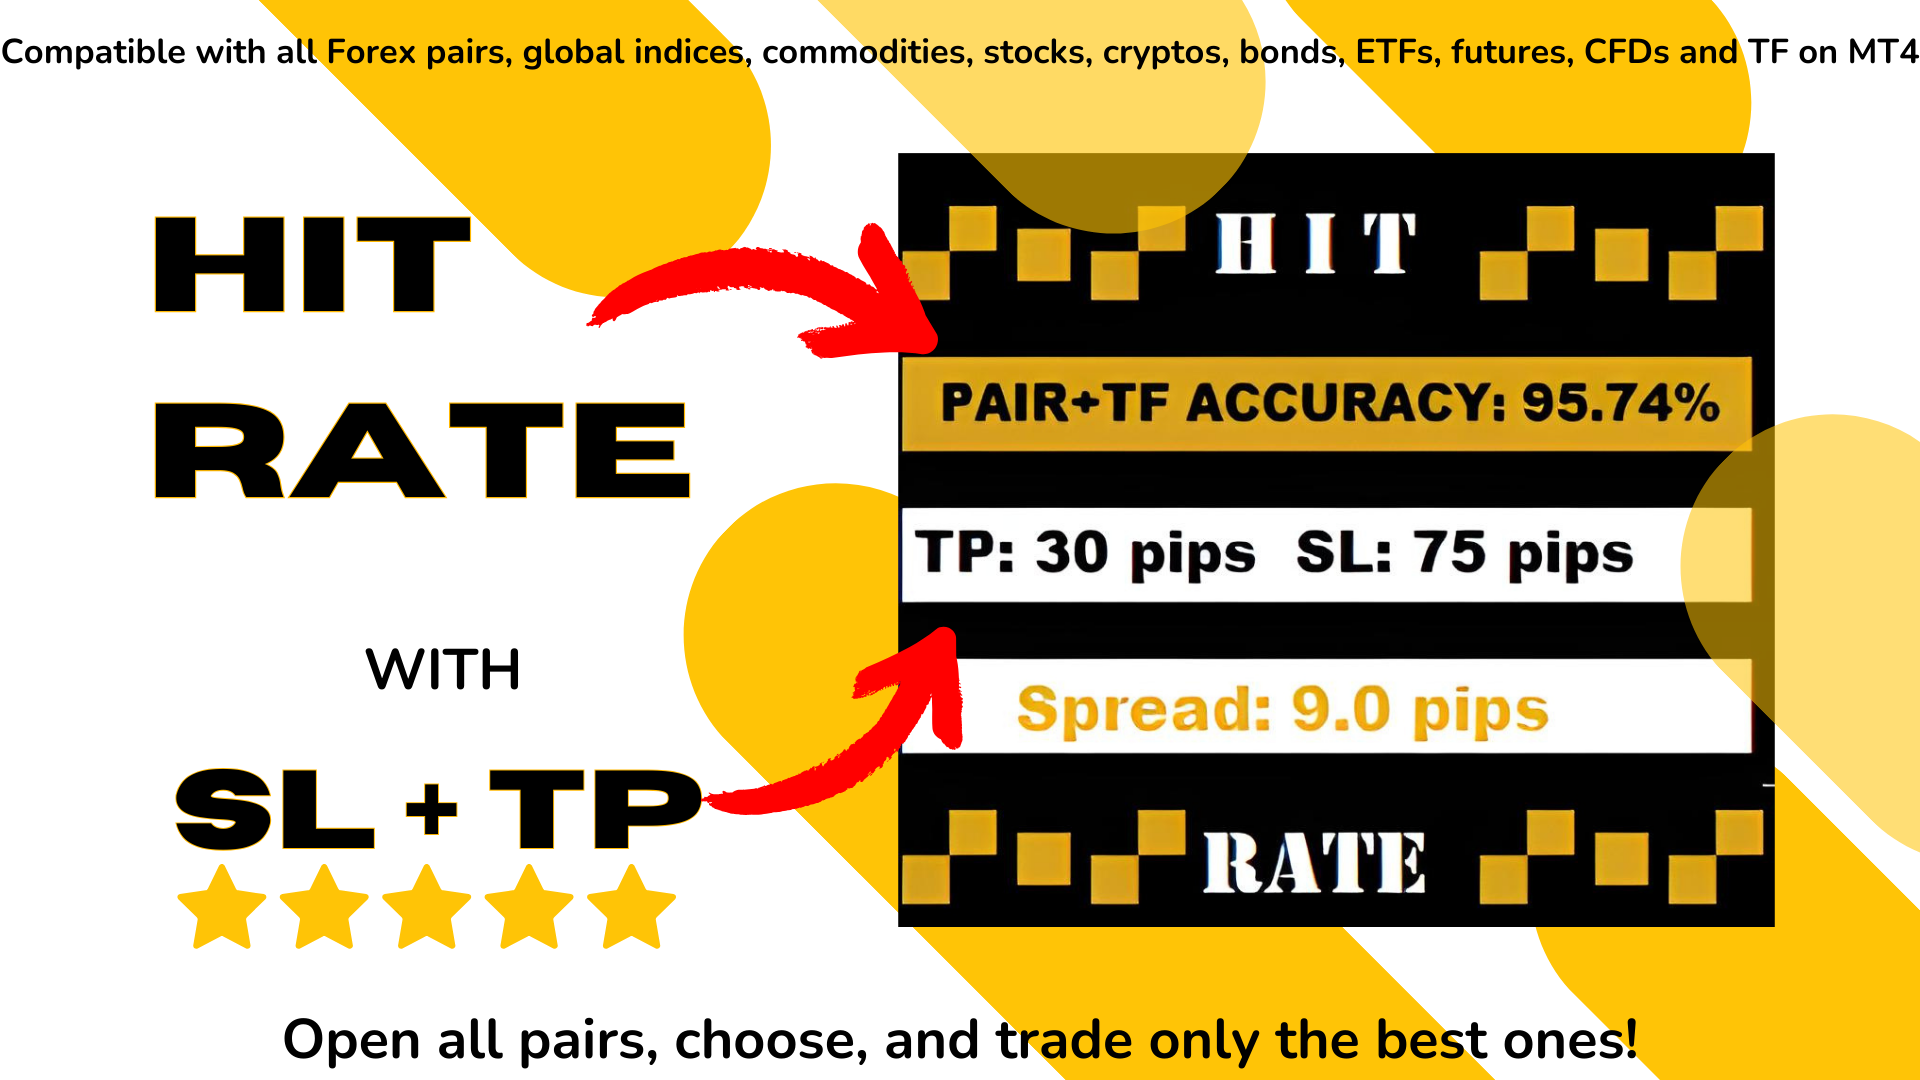
Hit Rate Top Bottom Signal offre un approccio totalmente innovativo. È ideale per chi desidera valutare in anticipo come funziona il segnale con un TP-SL specifico e in quali COPPIE/TF dà le migliori prestazioni.

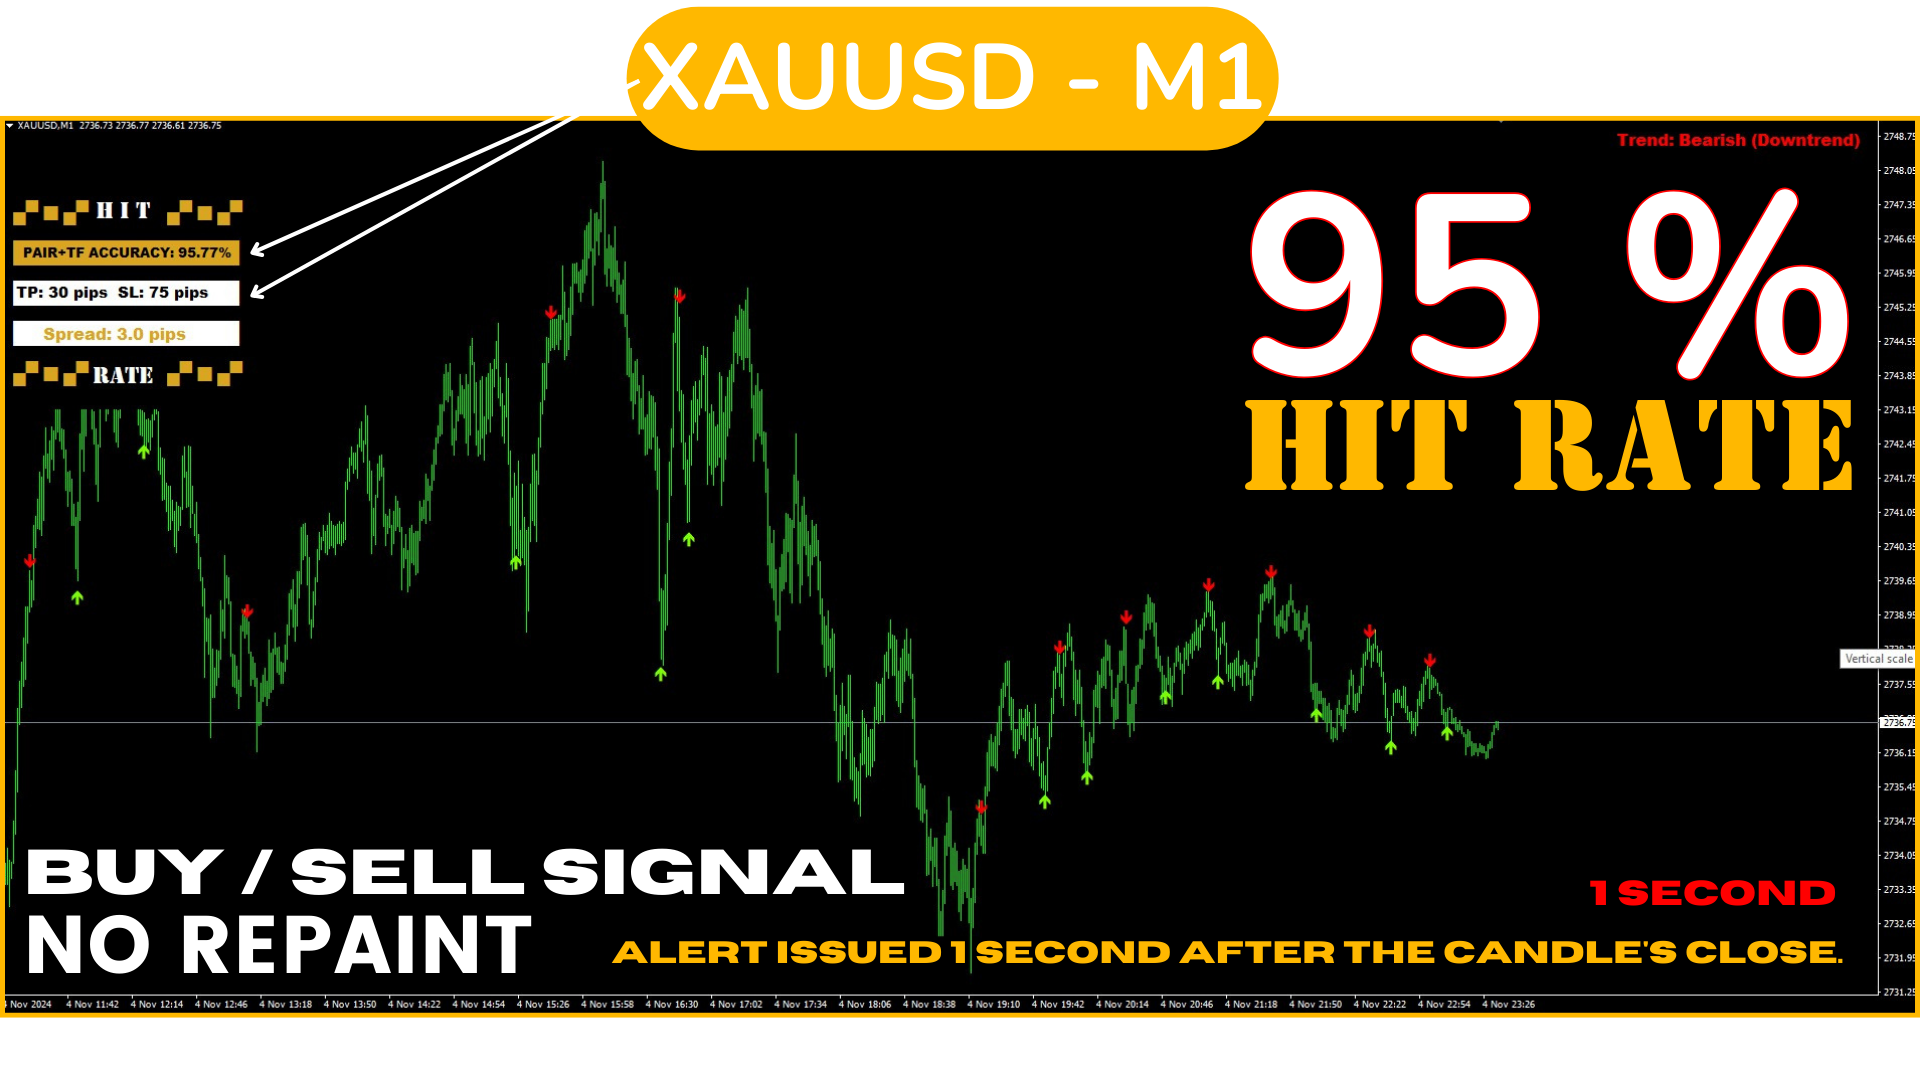
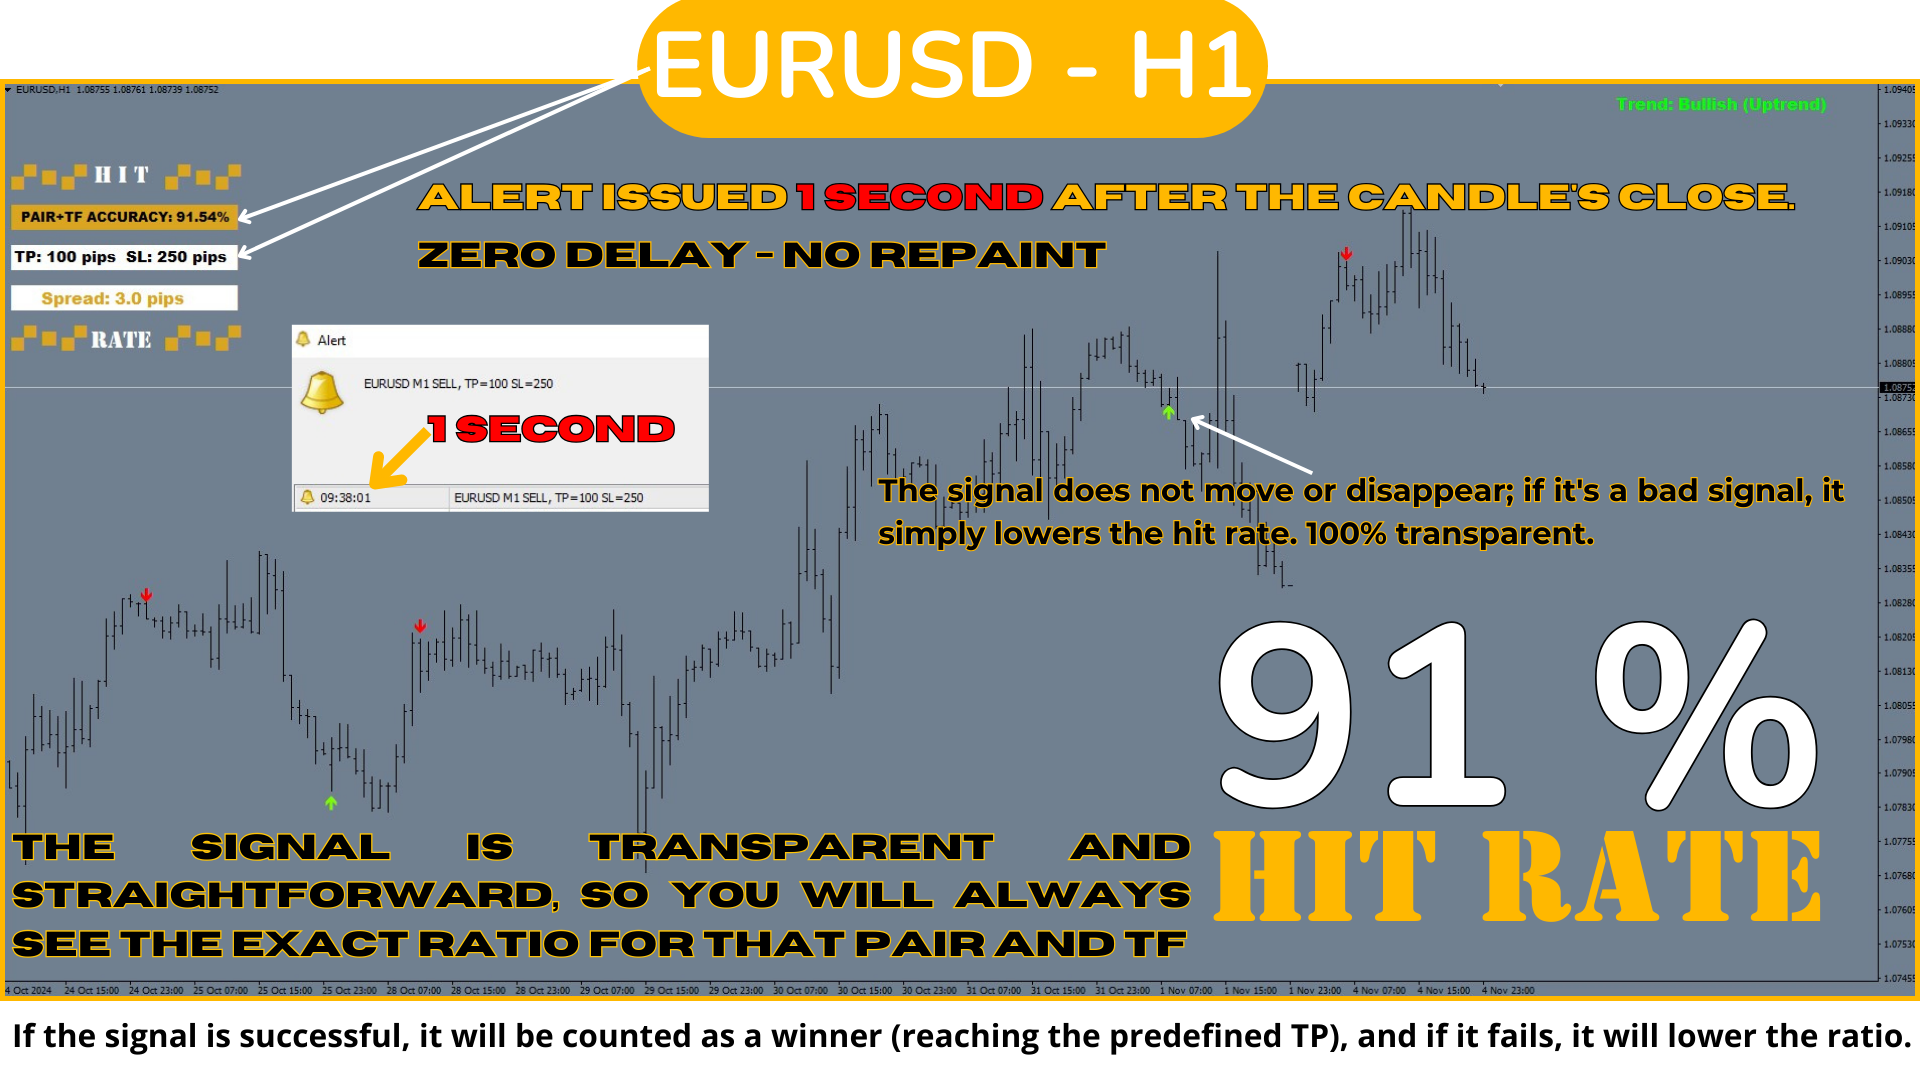
La strategia Hit Rate Top Bottom Signal è uno strumento fondamentale per ogni tipo di trader e di trading poiché non solo emette segnali precisi senza repaint, indicando chiaramente quando operare e in quale direzione, ma tiene anche un registro dettagliato della percentuale di successo per ogni Coppia e TF, con un Take Profit (TP) e Stop Loss (SL) predefiniti. Questo permette di conoscere in anticipo il tasso di efficacia del segnale, fondamentale per una buona gestione del rischio e per operare con la massima precisione.

Questa strategia si distingue perché si concentra sull'individuazione di punti di inversione negli impulsi, anziché movimenti completi, rendendo i segnali emessi più frequenti rispetto al tradizionale Top-Bottom e concentrandosi su
momenti chiave all'interno di ciascuna oscillazione importante del mercato.


Questa capacità di mostrare, in percentuale, l’efficacia storica del segnale in combinazione con un rapporto SL/TP definito rende questa strategia l’opzione migliore per operare in sicurezza, permettendo al trader di prendere decisioni basate sui dati. Fidarsi di un segnale non solo chiaro e diretto, ma anche con una comprovata storia, significa utilizzare una delle migliori strategie disponibili.


Come operare con questo sistema?

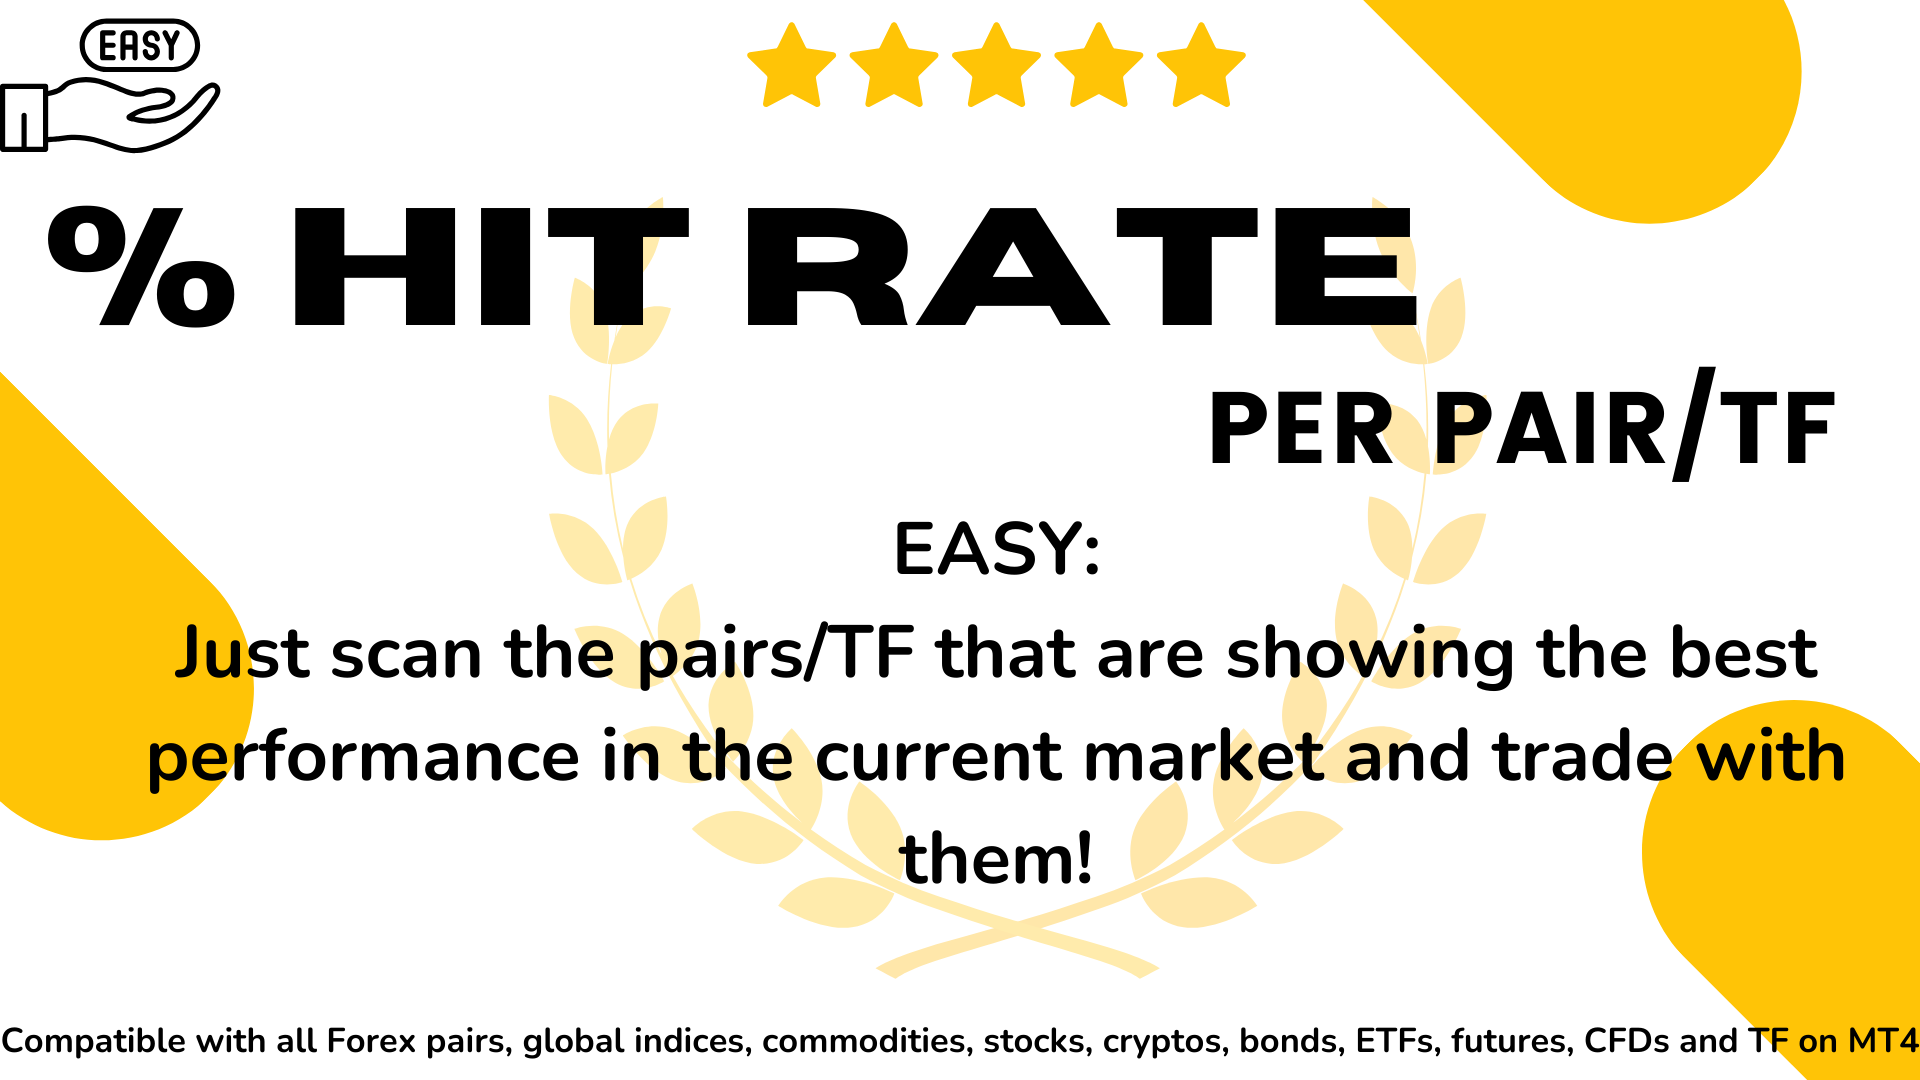
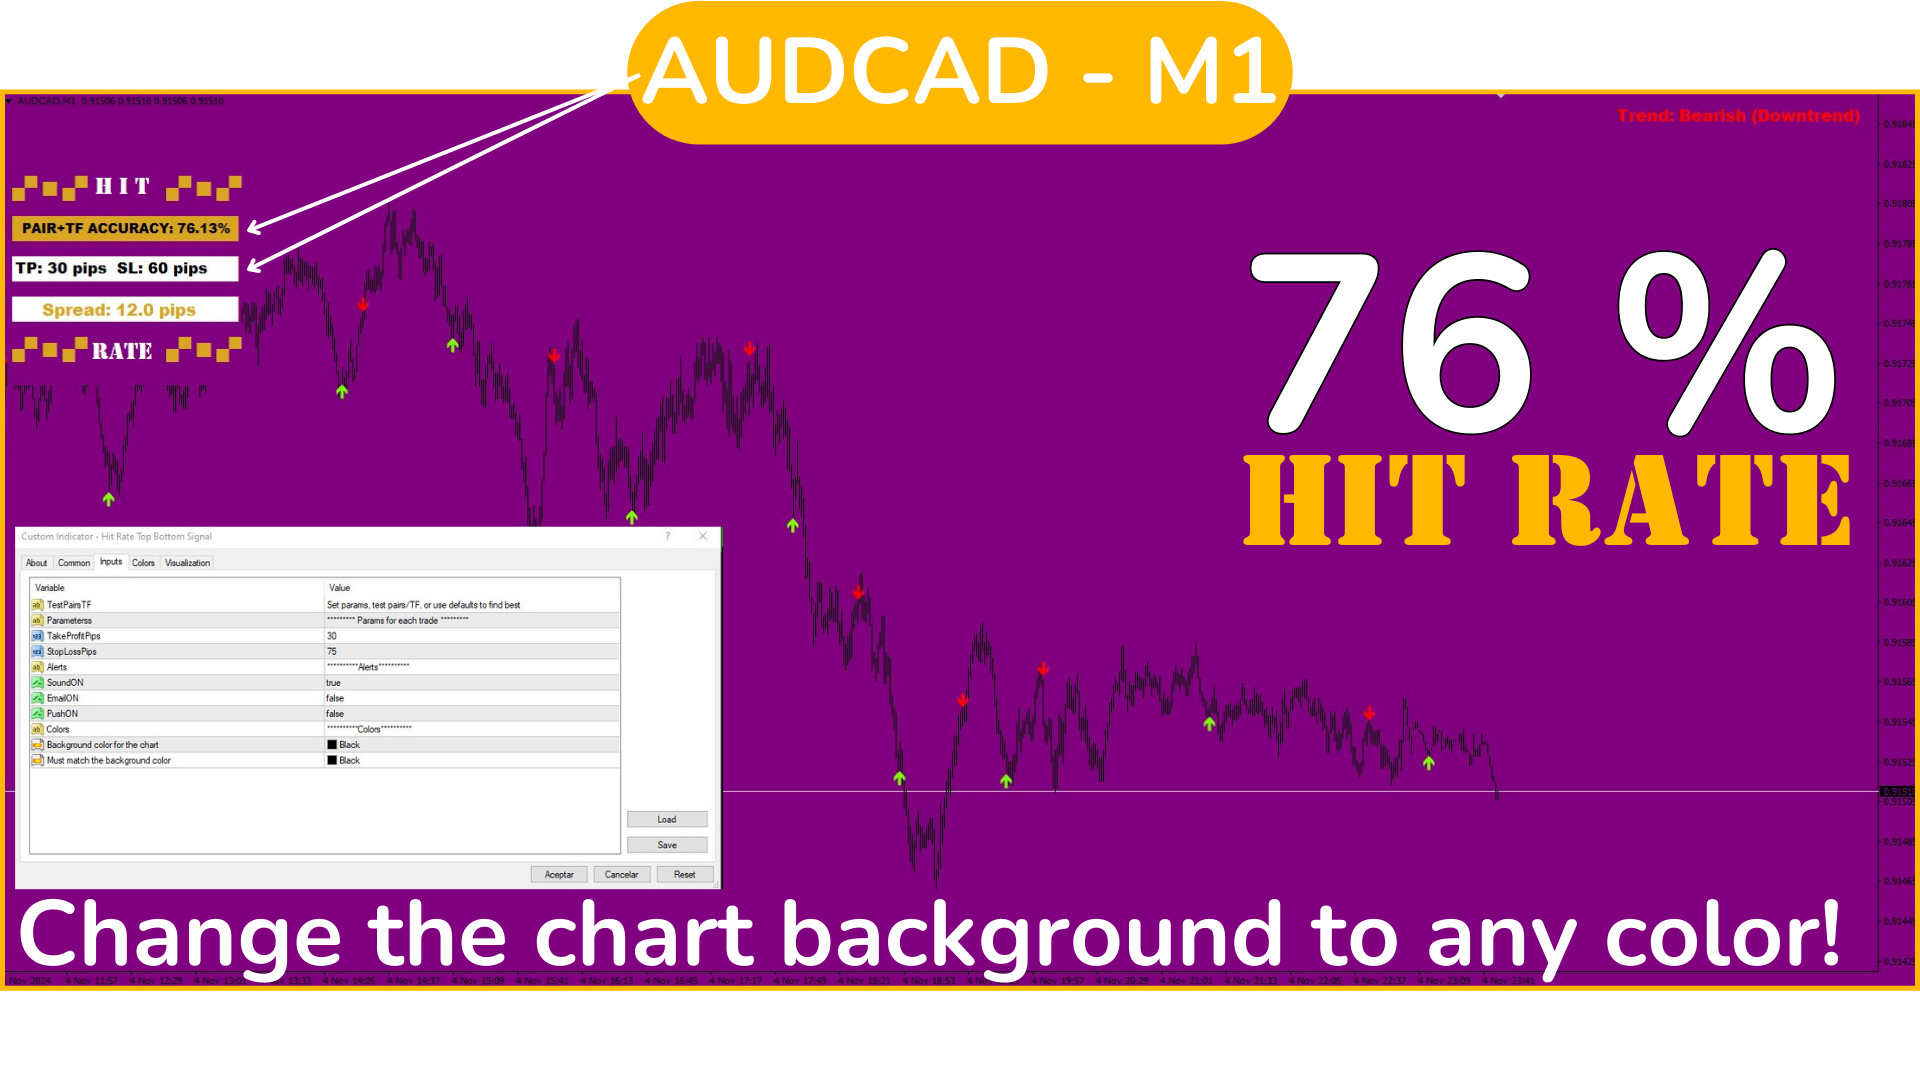
Apri più coppie e carica l'indicatore su ciascuna di esse. Ora, analizza ogni coppia per identificare in quali e in quali TF (time frame) il segnale funziona meglio e concentrati su queste. (VEDI IMMAGINI)

Il segnale, di default, ha un TP di 100 pips e un SL di 250 pips, ma puoi impostare i valori con cui desideri operare o lasciare i valori predefiniti.

Tieni presente che un SL di 250 pips su H1 non è lo stesso su M1, ma non preoccuparti: aggiornando manualmente i parametri di SL e TP, verrà ricalcolata la percentuale di successo del segnale per questi nuovi parametri, consentendoti di conoscere in anticipo i risultati attesi con questi parametri.

In questo modo, puoi regolare i parametri specifici di ciascuna coppia per "ottimizzare" la strategia su quella coppia e TF, e quindi conoscere la percentuale di successo del segnale in quel contesto. Si consiglia di effettuare questo processo una volta al giorno, sempre prima di operare, per identificare le coppie/TF con maggiore efficacia nel momento attuale. I parametri predefiniti funzionano meglio in TF come M30 o H1, a seconda della coppia.

Passo dopo passo:

  1. Scegli una coppia e controlla ogni TF. Verifica in quale di essi ha la percentuale di successo più alta, ad esempio superiore all'85-90% (se utilizzi la configurazione predefinita di TP e SL). Seleziona quel TF. Per capire quale rapporto è ottimale per la tua strategia se non utilizzi i parametri predefiniti di TP e SL, leggi sotto "Rapporto tra SL/TP e Percentuale di Successo".

  2. Ripeti la procedura con tutte le coppie disponibili; più coppie sono aperte, maggiori opportunità di trading avrai.

  3. Ora devi solo aspettare i segnali e aprire le operazioni non appena viene emesso un segnale, rispettando i valori preimpostati di SL e TP.

  4. Nel caso in cui desideri scegliere il TP e SL con cui operare, prima devi modificare i dati nella scheda "Inputs" e impostare i valori per ogni coppia, sempre in pips. Successivamente, osserva ciascun TF di quella coppia, scegli quello che funziona meglio e resta in attesa dei segnali.

Operare liberamente dal telefono:

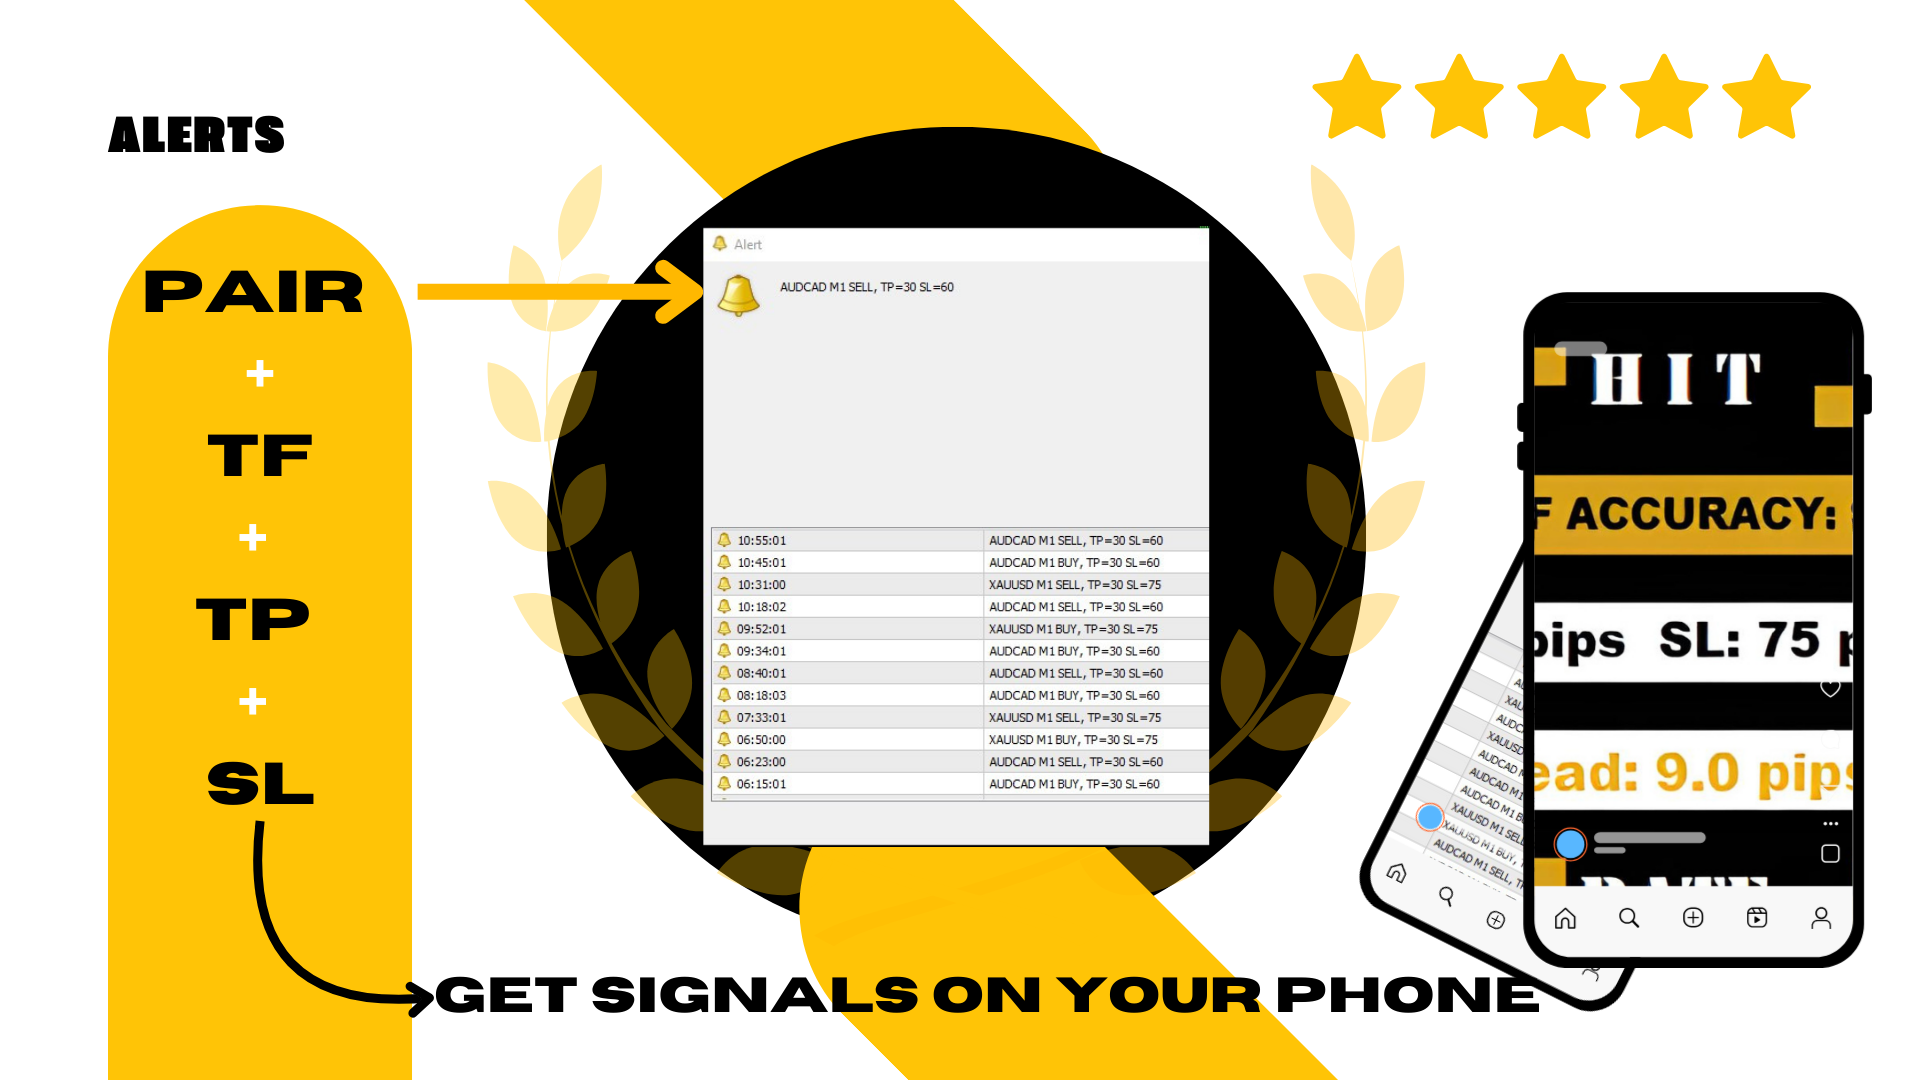
Questo processo "Passo dopo passo" deve essere configurato dal computer, ma successivamente puoi ricevere le notifiche delle operazioni sul tuo telefono. Come? Assicurati di avere configurato il telefono per ricevere messaggi push dal tuo terminale MT4 e consenti le notifiche al terminale dal tuo telefono.

Quando viene emesso un segnale, riceverai sul tuo telefono: COPPIA - TF - TIPO DI SEGNALE (BUY/SELL) - e i valori di TP e SL configurati in precedenza per quella coppia.


In questo modo, non sarà necessario stare sempre davanti al computer poiché potrai aprire le operazioni dal tuo telefono, impostare il SL e il TP di quella coppia, e non dover seguire costantemente il monitoraggio.

Ovviamente, per coloro che preferiscono operare dal computer, il segnale sonoro e visivo con gli stessi dati (COPPIA - TF - TIPO DI SEGNALE e valori di TP e SL) apparirà sullo schermo ogni volta che viene emesso un segnale su una coppia.


Comprendere il Rapporto tra SL/TP e Percentuale di Successo

Il successo di una strategia di trading dipende da due fattori chiave: da un lato il rapporto tra lo Stop Loss (SL) e il Take Profit (TP), dall’altro la percentuale di successo dei segnali. Entrambi svolgono un ruolo fondamentale nella redditività della strategia, e comprendere come funzionano insieme è essenziale per ottimizzare il sistema.

1. Rapporto SL/TP:

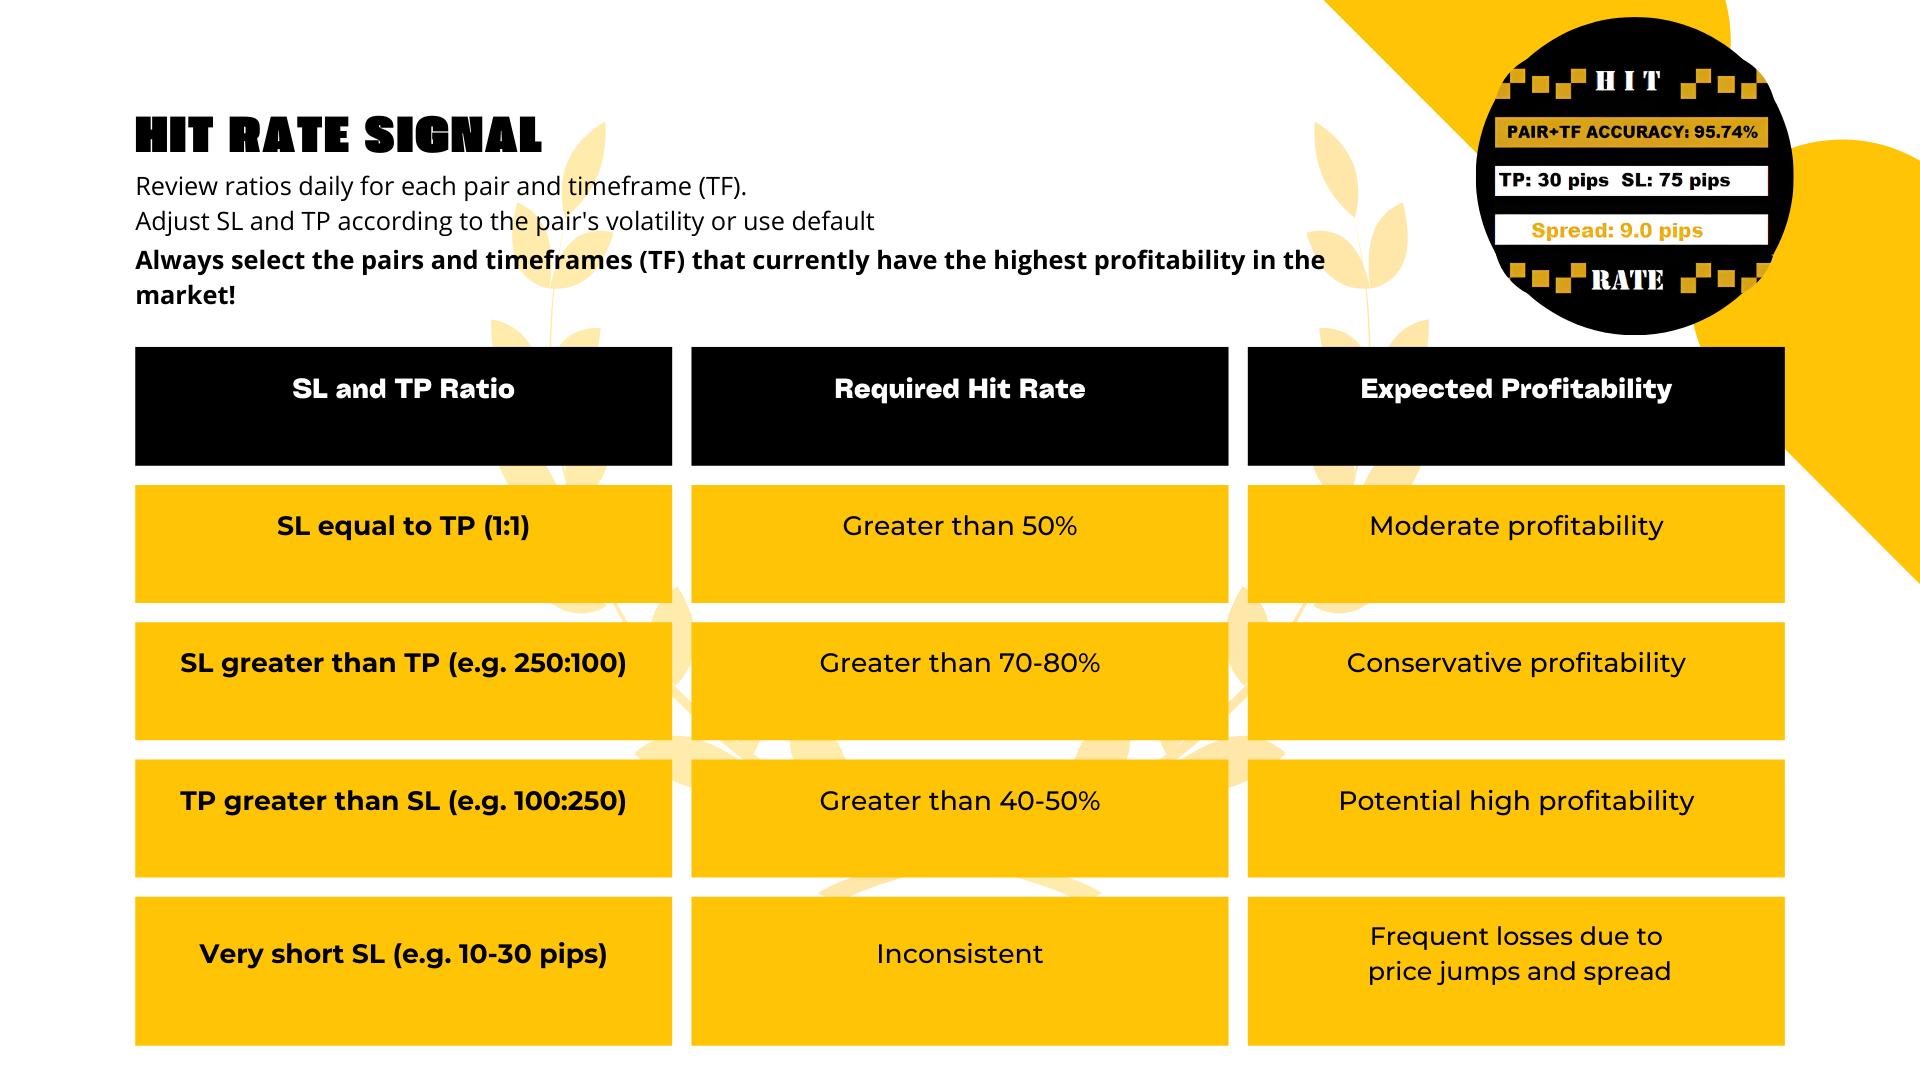
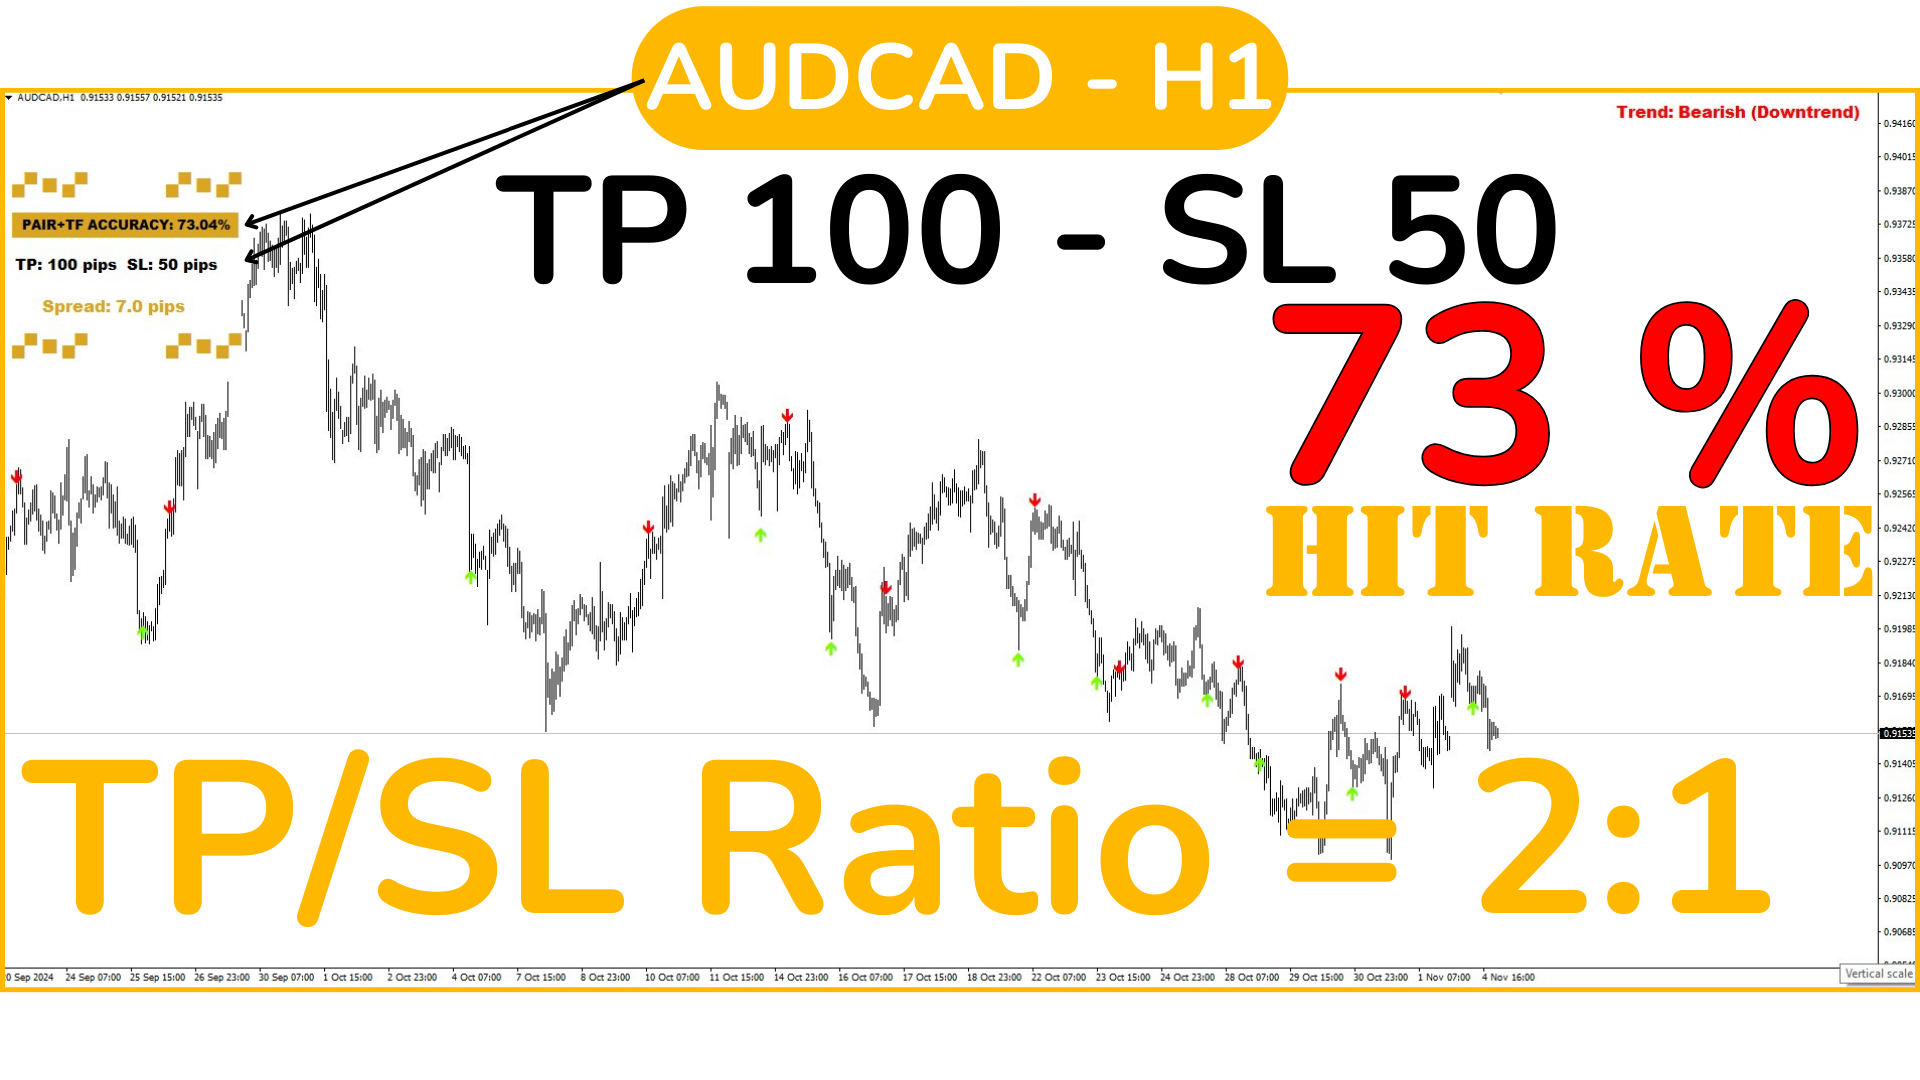
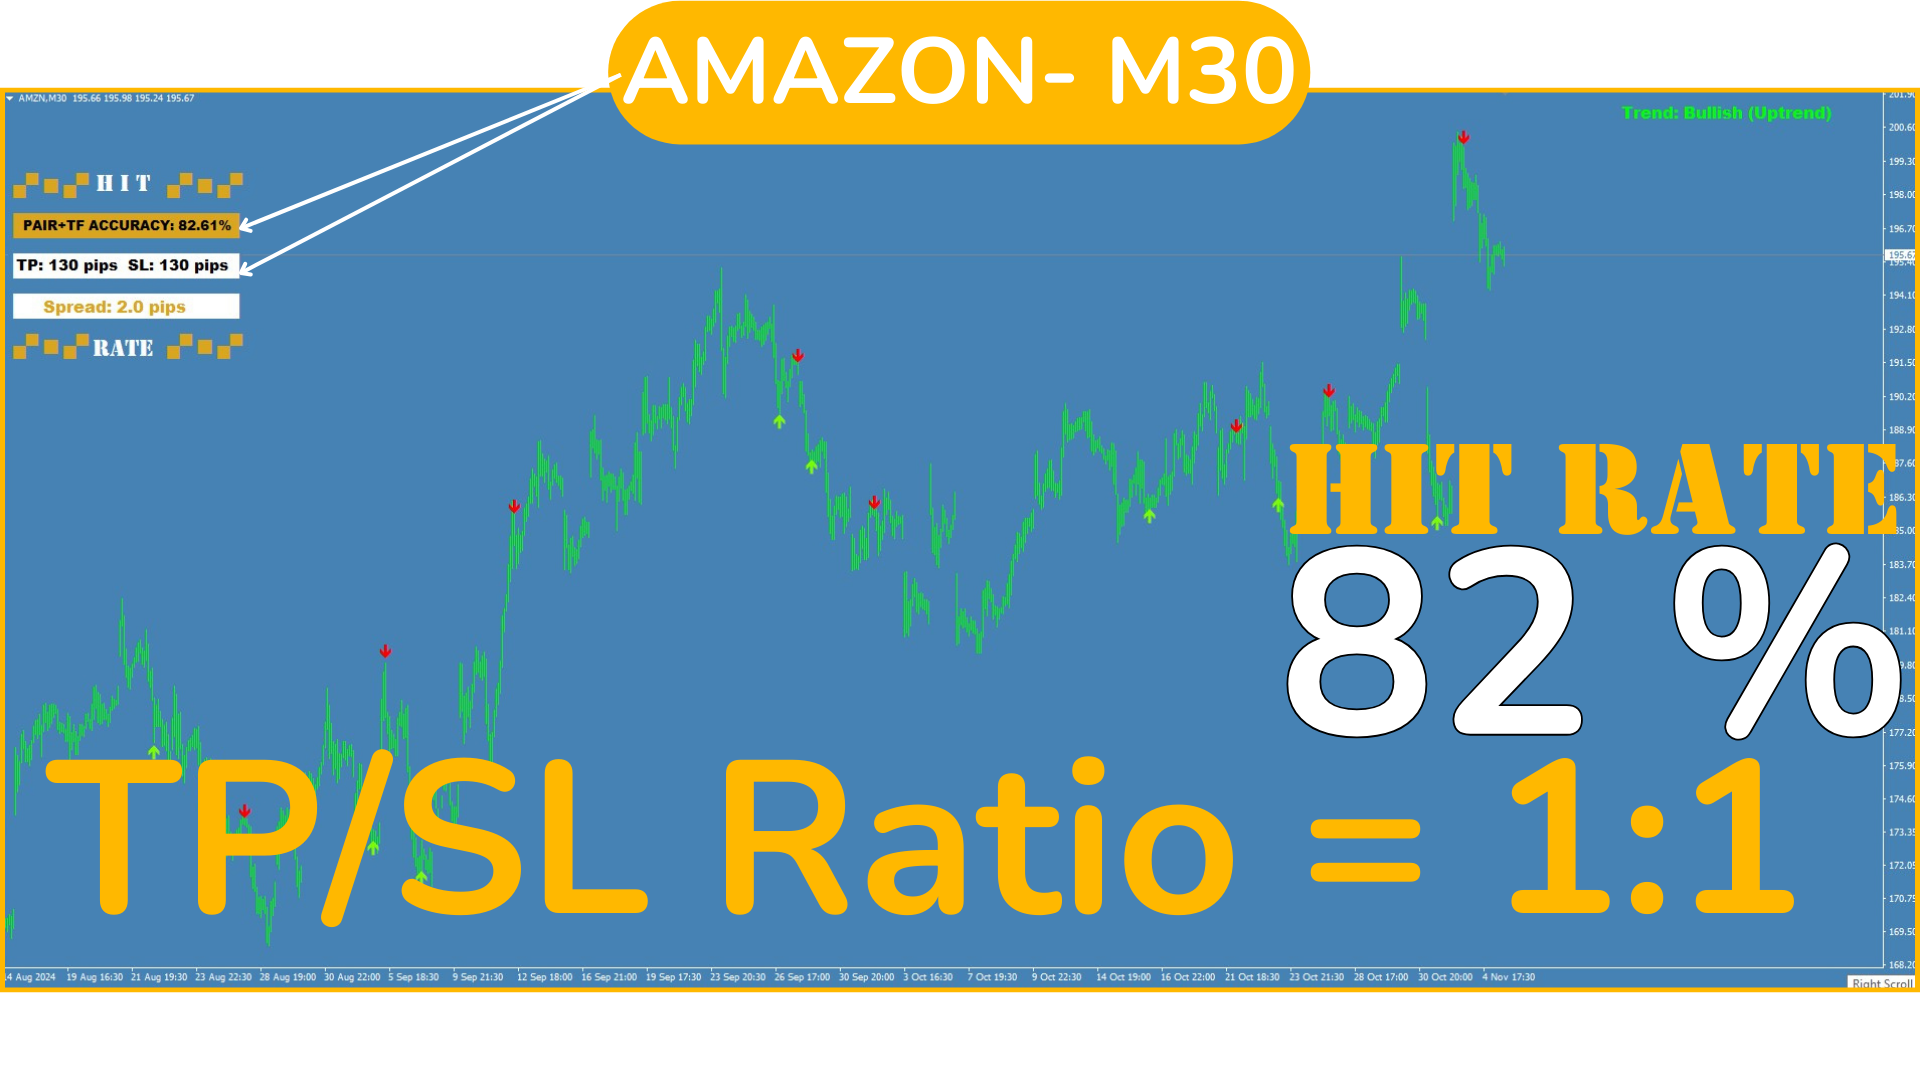
  • Rapporto SL/TP di 1:1: La dimensione del TP è pari a quella dell'SL (ad esempio, SL: 100 pips e TP: 100 pips). In questo caso, la strategia richiede una percentuale di successo superiore al 50% per essere redditizia, poiché guadagni e perdite sono simili.
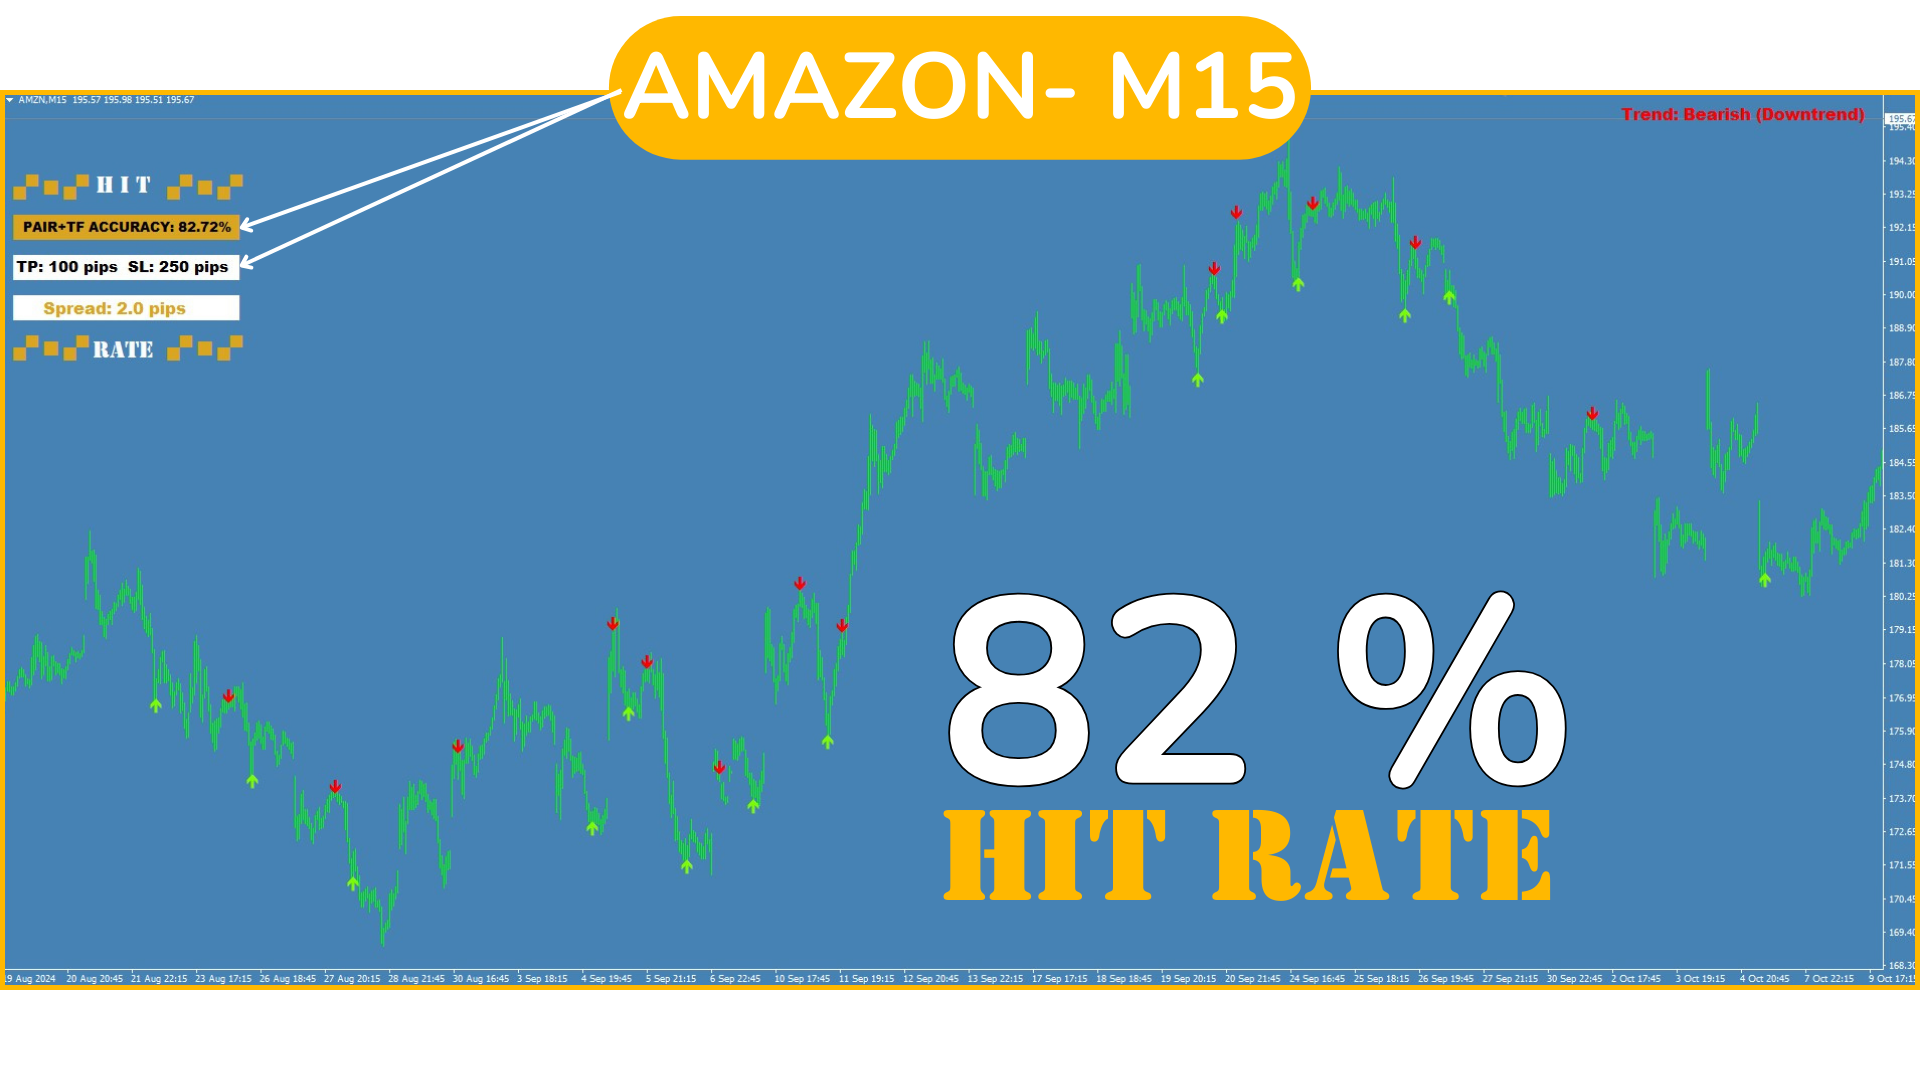
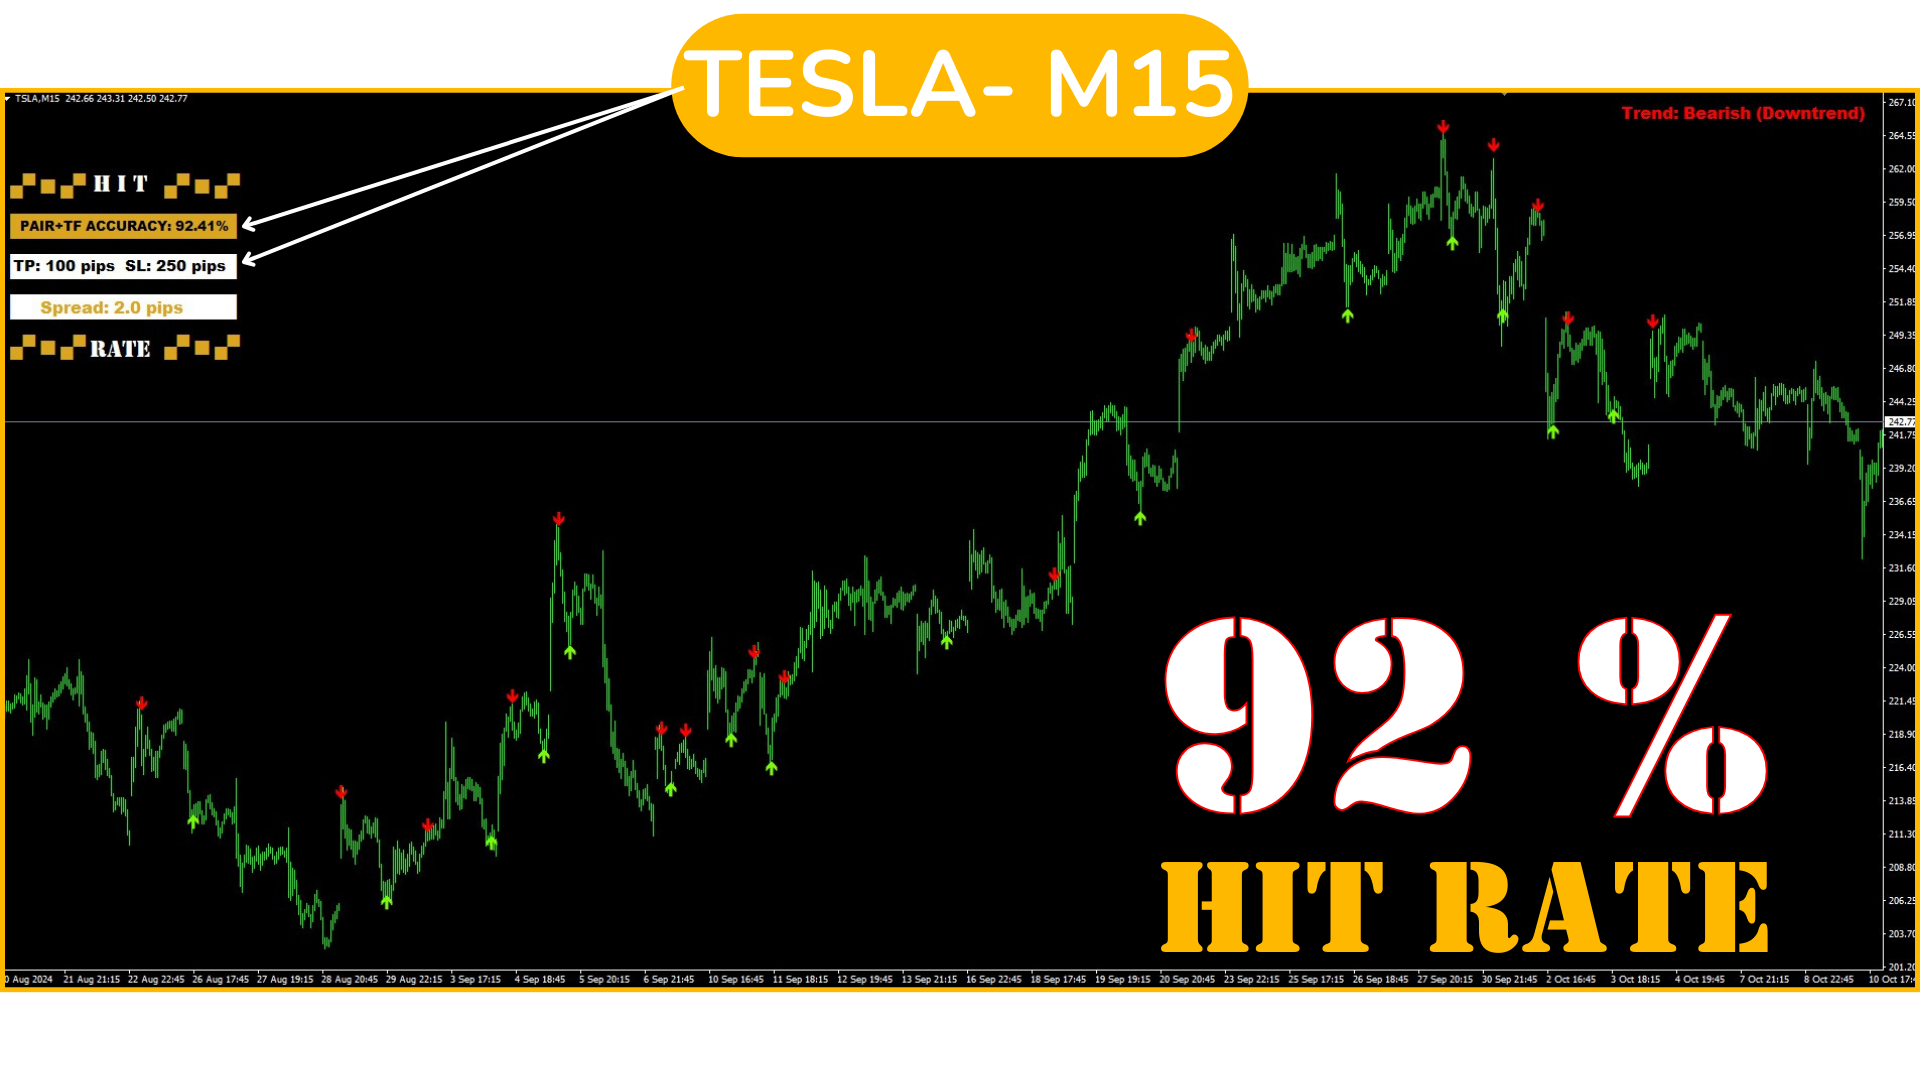
  • SL maggiore del TP: (ad esempio, SL: 250 pips e TP: 100 pips), è necessaria una percentuale di successo molto più elevata per compensare le perdite quando viene raggiunto l'SL. In questo caso, una percentuale di successo superiore al 70% o 80% è ideale.
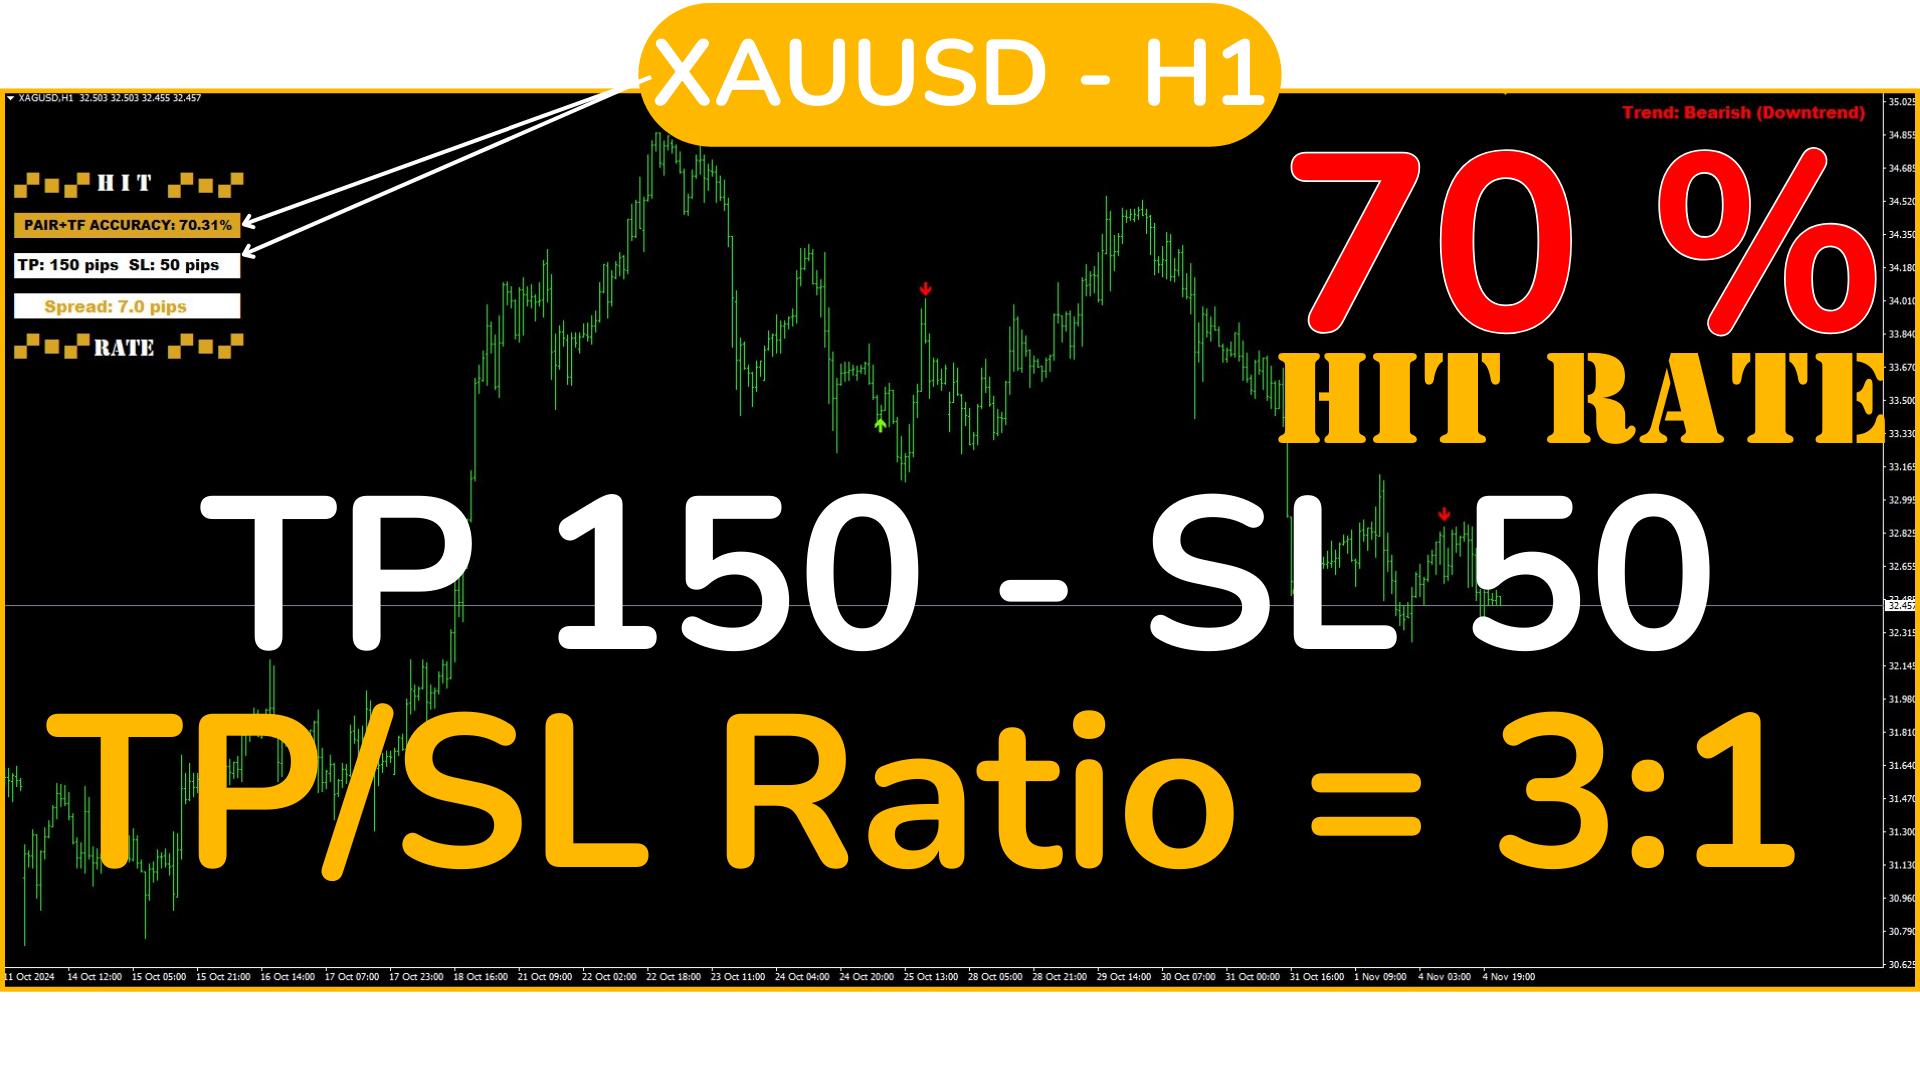
  • TP maggiore dell'SL: (ad esempio, TP: 250 pips e SL: 100 pips), la strategia può essere redditizia anche con una percentuale di successo inferiore, poiché ogni guadagno compenserebbe più perdite. Qui una percentuale di successo del 40-50% sarebbe sufficiente per generare profitti.

In ogni caso! Tieni sempre presente che se un SL è molto "corto", ad esempio 10-30 pips, sarà probabilmente toccato costantemente (considera lo Spread) risultando in perdite continue in operazioni che sarebbero state vincenti. Presta attenzione e lascia sempre spazio sufficiente al prezzo per muoversi (un SL generoso).

2. Percentuale di Successo:

  • La percentuale di successo indica quante volte il sistema ha successo nelle sue previsioni. Un sistema con un’alta percentuale di successo (ad esempio, 90%) è più affidabile e permette rapporti SL/TP più ampi (SL maggiore del TP).
  • Tuttavia, una bassa percentuale di successo non significa necessariamente perdite, a patto che il TP sia molto maggiore dell'SL. Con un TP maggiore, anche se si hanno pochi successi, i guadagni copriranno le perdite.

    QUESTO È IL MOTIVO PER CUI È FONDAMENTALE CONOSCERE IN ANTICIPO LA PERCENTUALE DI SUCCESSO DEL SEGNALE, PER OTTENERE UN RISULTATO OTTIMALE CON UNA BUONA GESTIONE DEL CAPITALE (SL+TP).


Ottimizzazione per Coppia e TF:

Ogni coppia e periodo possono rispondere in modo diverso allo stesso rapporto SL/TP, quindi è importante regolare lo SL e il TP in base alle prestazioni della coppia e del TF. Ad esempio, per coppie volatili o TF maggiori, potrebbe essere conveniente utilizzare un TP più ampio.

Prova diverse configurazioni di SL e TP su ciascuna coppia e TF, e osserva la percentuale di successo in ciascuna. Questo ti aiuterà a trovare l’equilibrio ottimale per massimizzare i profitti e minimizzare le perdite.


Esempio di Valutazione della Redditività:

Immagina una strategia con un SL di 250 pips e un TP di 100 pips. Perché questa configurazione sia redditizia, la percentuale di successo dovrebbe essere IDEALMENTE SUPERIORE AL 70%-80%, a seconda della volatilità e del comportamento specifico della coppia, affinché i guadagni coprano le perdite quando viene raggiunto l'SL.

Tuttavia, se il rapporto viene invertito con un SL di 100 pips e un TP di 250 pips, una percentuale di successo del 40-50% potrebbe essere sufficiente, poiché ogni operazione vincente compenserebbe diverse perdite.


Riepilogo:

  • SL maggiore del TP: È necessaria una percentuale di successo elevata (idealmente superiore al 70%).
  • TP maggiore dell'SL: Può funzionare con una percentuale di successo più bassa, intorno al 40-50%.
  • Ottimizzazione quotidiana: Controlla quotidianamente che il rapporto scelto sia mantenuto per ogni coppia e TF per ottenere le migliori prestazioni. Se noti che il rendimento di una coppia diminuisce, ripeti il processo "Passo dopo passo" e riesamina la configurazione ottimale.

È importante capire che questa strategia può essere utilizzata su tutte le coppie Forex, Oro, Argento, Azioni, Indici e persino Crypto se il tuo broker lo consente, così come su qualsiasi TF, quindi non è necessario restare legati a coppie che: 1- Hanno spread troppo elevati 2- Non hanno il rapporto che stiamo cercando. Scegli tra le migliori!


Infine, tieni presente che non esiste una configurazione ideale unica. Variando le impostazioni, noterai che configurazioni diverse possono dare buoni risultati a seconda della coppia e del TF. È per questo motivo che è importante avere un segnale chiaro che ci avvisi quando fare un trade con SL e TP corrispondenti (e già testati), dandoci un
 analisi percentuale del tasso di successo, rendendo Hit Rate TopBottom Signal una strategia completa. Leggendo semplicemente i dati inviati nelle notifiche e operando di conseguenza, avrai la tranquillità di prendere decisioni informate e già testate.

Trading senza stress, semplice e chiaro. Senza congetture né dubbi!


Prodotti consigliati
THIS IS A NEW PRODUCT RELEASE -  RENT FOR 1 MONTH FOR JUST $49.99: OFFER EXTENDS UNTIL THE END OF JANUARY 2026.   STRATEGY TESTER HAS LIMITED FUNCTIONS AND DOES NOT BEHAVE EXACTLY AS THE INDICATOR WOULD ON A DEMO. Transform Your Trading with Advanced Multi-Timeframe MACD Analysis The Continuation and Reversal Indicator is a sophisticated technical analysis tool that revolutionizes how you interpret MACD signals by analyzing multiple timeframes simultaneously. This professional-grade indicator p
Arbitrage Indicators is a professional and easy-to-use Forex trading indicator that uses the best trading principles of the latest AI arbitrage models. This indicator provides accurate buy and sell signals. Applies to currency pairs only. It has six different metrics options, MACD, KDJ, RSI, CCI, RVI, DEMARK. It can be freely switched by users, and intuitively shows the direction and reversal signal of the currency pair. When the two lines cross colors, the currency has a high probability of rev
Alpha Trend sign has been a very popular trading tool in our company for a long time. It can verify our trading system and clearly indicate trading signals, and the signals will not drift. Main functions: Based on the market display of active areas, indicators can be used to intuitively determine whether the current market trend belongs to a trend market or a volatile market. And enter the market according to the indicator arrows, with green arrows indicating buy and red arrows indicating se
This is the complete REX package. It consists of the lite, pro and ULTRA version.  Perfect for beginners and intermediates. REX complete is 100% non repaint. The strategy is based on a mix of different strategies, statistics, including pivot points, oscillators and patterns.  As the trading idea consists of a variety of some classic indicators like Momentum, Williams Percent Range, CCI, Force Index, WPR, DeMarker, CCI, RSI and Stochastic, it is clear that the fundamental indicators have being u
Chart Patterns Detect 15 patterns (Ascending Triangle, Descending Triangle, Rising Wedge, Falling Wedge, Bullish Flag, Bearish Flag, Bullish Rectangle, Bearish Rectangle Symmetrical triangle, Head and Shoulders, Inverted Head and Shoulders, Triple top, Triple Bottom, Double Top, Double Bottom) Use historical data to calculate the probability of each pattern to succeed (possibility to filter notification according to the chance of success) gives graphic indication about the invalidation level and
Szia! Egy indikátorral. Több idő gyertyájának kirajzoltatása egy charton. Különböző színek rendelhetők a long és short gyertyákhoz. Vonal vastagsága állítható. A gyertya kitöltése engedélyezhető. Hello! With an indicator. Drawing multiple time candles on a chart. Different colors can be ordered for long and short candles. Line thickness can be adjusted. Filling the candle can be allowed. Videó: https://www.youtube.com/watch?v=-9bequnAw-g&amp ;ab_channel=GyulaKlein
Preface: First of all, let me introduce myself. I am a programmer and have been working for over 20 years. 2023 has passed, and our studio has achieved a record of 500 times with 7 manual transmissions. Below, we will show you how to do it through a series of operations. The first step is to model. Modeling is to find a fixed trading pattern. I think everyone has heard of a 2/8 probability, and through this probability, we can further refine it, which means that 1 to 4 is the optimal state. We h
The main idea of this indicator is rates analysis and prediction by Fourier transform. Indicator decomposes exchange rates into main harmonics and calculates their product in future. You may use the indicator as a standalone product, but for better prediction accuracy there is another related indicator - FreqoMaster - which uses FreqoMeterForecast as a backend engine and combines several instances of FreqoMeterForecast for different frequency bands. Parameters: iPeriod - number of bars in the ma
Visual Vortex Indicator MT4
AL MOOSAWI ABDULLAH JAFFER BAQER
Unleash the Power of Market Dynamics with the Vortex Indicator! The Visual Vortex Indicator is your advanced tool for decoding market trends, reversals, and momentum shifts. Priced at $65, this indicator provides a comprehensive view of market behavior, but it’s designed for you to fine-tune and optimize it according to your unique trading strategy. What Makes It Unique? The Vortex Indicator is based on a strategy that identifies directional movements and trend strength by analyzing key price d
This indicator is another variant of the famous powerful indicator Fibonacci-SS https://www.mql5.com/en/market/product/10136 but has different behaviour in placing Pending Order and TP Line. Automatically places Fibonacci retracement lines from the last highest and lowest visible bars on the chart with: An auto Pending Order (Buy/Sell). Taking Profit 1, Taking Profit 2 is pivot point and Taking Profit 3 for extended reward opportunity. The best risk and reward ratio. Simple and powerful indicat
This advisor enters the market at the opening of   London Market . It has a automatic function that give buy (arrow up green) and sell (arrow down red) signal when the indicator met high probabilities requirements.Once the signal is generated it is the trader discretions to start the order button and do trade manually. Stop loss are base on ATR. Recommended Take profit is 20pips.  The trading system is suitable for both experienced traders and beginners.  Timeframe is  M5 . Minimum account bal
Stratos Pali
Michela Russo
5 (4)
Stratos Pali Indicator   is a revolutionary tool designed to enhance your trading strategy by accurately identifying market trends. This sophisticated indicator uses a unique algorithm to generate a complete histogram, which records when the trend is Long or Short. When a trend reversal occurs, an arrow appears, indicating the new direction of the trend. Important Information Revealed Leave a review and contact me via mql5 message to receive My Top 5 set files for Stratos Pali at no cost! Dow
The indicator provides a superior alternative to price action analysis. It enables the identification of normalized patterns, which are then transformed into a graphical representation to forecast future steps within a time series. In the top-left corner, you'll find information regarding the expected prediction accuracy, determined through a complex MSQE calculation. You have the flexibility to adjust the time window, making it easy to validate the indicator's performance. Additionally, you can
True SnD
Indra Lukmana
5 (1)
This Supply & Demand indicator uses a unique price action detection to calculate and measures the supply & demand area. The indicator will ensure the area are fresh and have a significant low risk zone. Our Supply Demand indicator delivers functionality previously unavailable on any trading platform. Trading idea You may set pending orders along the supply & demand area. You may enter a trade directly upon price hit the specific area (after a rejection confirmed). Input parameters Signal - Set
Simple to read and powerful, no fancy lines and drawings to clutter your chart or distract you. The trend probability oscillator estimates how likely a trend will continue in a certain period. The cummulator period controls how many bars in the past to use and is a proxy for the timescale the trend probability should hold. The use of a Max Line improves this further by indicating when a trend is likely to reverse. In most cases a trend must lose momentum before reversing. Hence, a trend probabil
Gartley Projection D
Oleksandr Medviediev
3.71 (7)
The indicator identifies the harmonic patterns (XABCD) according to developments of H.M.Gartley ( "Profits in the Stock Market" , 1935г). It projects D-point as a point in the perspective projection (specify ProjectionD_Mode = true in the settings). Does not redraw. When a bar of the working timeframe closes, if the identified pattern point has not moved during Patterns_Fractal_Bars bars, an arrow appears on the chart (in the direction of the expected price movement). From this moment on, the ar
Indicatori chiave dei prezzi della zona di domanda e offerta sfondo Il sistema ricerca automaticamente le aree di domanda e offerta nella linea K e traccia in tempo reale le linee di prezzo chiave. I trader possono operare in base alle linee di negoziazione dei prezzi. Caratteristiche principali Il sistema ricerca automaticamente le aree di domanda e offerta nella linea K. Il sistema traccerà anche linee di prezzo chiave in tempo reale, e i trader potranno operare in base a tali linee di prezzo
Watch the Clock
David Leander Tschacher
Watch the Clock shows a clock at a desired position. The clock is useful if you want to check when a candle closes. You can also set an alert to be prepared before the news. ️ Watch the Clock works also in the strategy tester. ️ Watch the Clock requires a minimum of CPU power. ️ Watch the Clock can improve your manual style of trading. Inputs Alert -> At which time should the alert occur? Time Shift in Minutes -> Should the time be incremented by x minutes? Size -> The font size of the tim
MACD Divergence
Sergey Deev
2.5 (2)
The indicator detects divergence signals - the divergences between the price peaks and the MACD oscillator values. The signals are displayed as arrows in the additional window and are maintained by the messages in a pop-up window, e-mails and push-notifications. The conditions which formed the signal are displayed by lines on the chart and in the indicator window. Indicator Parameters MacdFast - fast MACD line period MacdSlow - slow MACD line period MacdSignal - MACD signal line period MacdPric
Dynamic Forex28 Navigator
Bernhard Schweigert
4.43 (7)
Dynamic Forex28 Navigator - Lo strumento di trading Forex di nuova generazione. ATTUALMENTE SCONTATO DEL 49%. Dynamic Forex28 Navigator è l'evoluzione dei nostri indicatori popolari di lunga data, che combinano la potenza di tre in uno: Advanced Currency Strength28 Indicator (695 recensioni) + Advanced Currency IMPULSE con ALERT (520 recensioni) + CS28 Combo Signals (Bonus). Dettagli sull'indicatore https://www.mql5.com/en/blogs/post/758844 Cosa offre l'indicatore di forza di nuova generazione?
Indicatore Crypto_Forex "Morning Star pattern" per MT4. - L'indicatore "Morning Star pattern" è un indicatore molto potente per il trading Price Action: nessuna rielaborazione, nessun ritardo. - L'indicatore rileva i pattern rialzisti Morning Star sul grafico: segnale freccia blu sul grafico (vedi immagini). - Con avvisi su PC, dispositivi mobili ed e-mail. - È disponibile anche il suo fratello, l'indicatore ribassista "Evening Star pattern" (segui il link qui sotto). - L'indicatore "Morning S
ZhiBiMACD MT4
Qiuyang Zheng
4.5 (2)
This is a unique MACD indicator that is more accurate and easy to use than traditional MACD. It is suitable for any chart cycle and is suitable for any market variety. The red column is the (Buy) band signal, and the blue column is the (Sell) band signal. The yellow and green lines are trend lines, and the two lines never cross. Buy: In the blue column, look at the green line up through the middle 0 axis. Sell: In the red column, look at the yellow line down the middle 0 axis. The MACD's de
The indicator identifies two most important patterns of technical analysis - Pin Bar and Engulfing. MT5-version  https://www.mql5.com/en/market/product/53701 Settings: Mincandle size for PinBar - The minimum size of the Pin-Bar candlestick; Percentage of candle body on size - The percentage of the candle body in relation to its length; PinBar Alert - Alert when a Pin-Bar is detected; PinBar Mail - Sends an email when a Pin Bar is found; PinBar Notification - Sends a push notification when a Pin
PABT Pattern Indicator - it's classical system one of the signal patterns. Indicator logic - the Hi & Lo of the bar is fully within the range of the preceding bar, look to trade them as pullback in trend. In the way if indicator found PABT pattern it's drawing two lines and arrow what showing trend way.  - First line - it's entry point and drawing at: 1. On the high of signal bar or on middle of the signal bar (depending from indicator mode) for buy; 2. On the low of signal bar or on middle of t
RQL Trend Board – Description RQL Trend Board   is a simple but powerful multi-timeframe trend dashboard. It shows the current market bias across several timeframes at the same time, using an internal trend-classification method. Each timeframe is displayed as a colored box:   Green   – bullish bias → look for   long   setups   Yellow   – ranging / unclear →   no trade zone   Red   – bearish bias → look for   short   setups The indicator gives a clear   overall picture   of where the
FREE
Indicatore Crypto_Forex Pattern PINBAR per MT4, senza ridisegnare, senza ritardi. - L'indicatore "PINBAR Pattern" è un indicatore molto potente per il trading basato sull'azione dei prezzi. - L'indicatore rileva le PinBar sul grafico: - PinBar rialzista - Segnale a freccia blu sul grafico (vedi immagini). - PinBar ribassista - Segnale a freccia rossa sul grafico (vedi immagini). - Con avvisi su PC, dispositivi mobili ed e-mail. - L'indicatore "PINBAR Pattern" è eccellente da combinare con i li
Owl smart levels
Sergey Ermolov
4.24 (37)
Versione MT5  |  FAQ L' indicatore Owl Smart Levels   è un sistema di trading completo all'interno dell'unico indicatore che include strumenti di analisi di mercato popolari come i   frattali avanzati di Bill Williams , Valable ZigZag che costruisce   la corretta struttura a onde   del mercato, e i   livelli di Fibonacci che segnano i livelli esatti di entrata nel mercato e luoghi per prendere profitti. Descrizione dettagliata della strategia Istruzioni per lavorare con l'indicatore Consulente-
Spirit mt4
Alena Snigireva
5 (1)
Spirit mt4 is an indicator that works without flashing, the signals are triggered after the arrow at the beginning of the next candle Includes several indicators for overbought and oversold levels. Works with any currency pair: EUR/USD, AUD/USD and others. After the purchase, send me a private message and I will send you the settings that I use for this indicator. Suitable for trading cryptocurrencies. I like to trade cryptocurrency more, so I use it more there. It can also be used for bi
Gli utenti di questo prodotto hanno anche acquistato
Indicatore Miraculous – Strumento Forex e Binario 100% Non-Repaint Basato sul Quadrato di Nove di Gann Questo video presenta l' Indicatore Miraculous , uno strumento di trading altamente accurato e potente, sviluppato specificamente per i trader di Forex e Opzioni Binarie . Ciò che rende unico questo indicatore è la sua base sul leggendario Quadrato di Nove di Gann e sulla Legge della Vibrazione di Gann , rendendolo uno degli strumenti di previsione più precisi disponibili nel trading moderno. L
BinaryIndicator
Andrey Spiridonov
BinaryIndicator is a highly accurate indicator for trading binary options. It shows excellent results in scalping. This indicator is based in multifactor analysis of trend indicators, as well as confirmation oscillators, which in the end gives an increased accuracy of signals. Advantages of the indicator Increased accuracy of signals. Excellent results when trading binary options with a short expiration time from M30 to M1 . It works on any timeframes. Works with any trade symbols. Parameters
Rtc ML Ai Predictor MT4
Muhammad Faisal Sagala
Rtc ML Ai | Predictor CORE MACHINE LEARNING ENGINE Adaptive ML Market Predictor – Multi-Bar Trend & Candle Forecast What This Indicator Does This indicator is a  real-time market prediction engine  designed to analyze price behavior and estimate  future market tendencies . Unlike conventional indicators, this system  does not rely on static parameters or historical curve-fitting , but adapts its internal state dynamically during live market operation. Instead of using static rules, the indic
FFx Engulfing Setup Alerter gives trade suggestions with Entry, Target 1, Target 2 and StopLoss. Below are the different options available: Entry suggestion - pips to be added over the break for the entry 3 different options to calculate the SL - by pips, by ATR multiplier or at the pattern High/Low 3 different options to calculate the 2 TPs - by pips, by ATR multiplier or at Risk/Reward Offset the dashboard - any place on the chart Remove the suggestion once the price reached the SL line Lines
FFx InsideBar Setup Alerter gives trade suggestions with Entry, Target 1, Target 2 and StopLoss. Below are the different options available: Entry suggestion - pips to be added over the break for the entry Minimum candle size - to avoid too close buy/sell entry suggestions 3 different options to calculate the SL - by pips, by ATR multiplier or at the pattern High/Low 3 different options to calculate the 2 TPs - by pips, by ATR multiplier or at Risk/Reward Offset the dashboard - any place on the c
FFx OutsideBar Setup Alerter gives trade suggestions with Entry, Target 1, Target 2 and StopLoss. Below are the different options available: Entry suggestion - pips to be added over the break for the entry. 3 different options to calculate the SL - by pips, by ATR multiplier or at the pattern High/Low. 3 different options to calculate the 2 TPs - by pips, by ATR multiplier or at Risk/Reward. Offset the dashboard - any place on the chart. Remove the suggestion once the price reached the SL line.
FFx PinBar Setup Alerter gives trade suggestions with Entry, Target 1, Target 2 and StopLoss. Below are the different options available: Entry suggestion - pips to be added over the break for the entry Minimum candle size - to avoid too small candles 3 different options to calculate the SL - by pips, by ATR multiplier or at the pattern High/Low 3 different options to calculate the 2 TPs - by pips, by ATR multiplier or at Risk/Reward Offset the dashboard - any place on the chart Remove the sugges
Automatic, live & interactive picture of all trendlines. Assign push, email and sound alerts to the lines of your choice and be informed about price rollback, breakout, rollback after breakout, number of rollbacks, line expiration by double breakout. Correct, drag or delete the lines and interactively tune the line system. https://youtu.be/EJUo9pYiHFA . Chart examples https: //www.mql5.com/en/users/efficientforex Price Interaction Events All events are effective immediately and only after one
The purpose of this new version of the MT4 standard indicator provided in your platform is to display in a sub-window multiple timeframes of the same indicator with its divergences. See the example shown in the picture below. But the display isn't like a simple MTF indicator. This is the real display of the indicator on its timeframe. Here's the options available in the FFx divergences indicator: Select the timeframes to be displayed (M1 to Monthly) Define the width (number of bars) for each tim
The purpose of this new version of the MT4 standard indicator provided in your platform is to display in a sub-window multiple timeframes of the same indicator with its divergences. See the example shown in the picture below. But the display isn't like a simple MTF indicator. This is the real display of the indicator on its timeframe. Here's the options available in the FFx divergences indicator: Select the timeframes to be displayed (M1 to Monthly). Define the width (number of bars) for each ti
The FFx Dashboard MTF alerter will show you on a single chart all the timeframes (M1 to Monthly) with their own status for the indicator. 2 Alert Options: Single timeframe: each selected timeframe alert separately when a signal occurs Multi timeframes: all selected timeframes must agree for an alert to be triggered Both options have an input to select the timeframes to be used for the alert(s). How to Understand the Status: Green/Red square: histogram above/below 0 line Green square + Red bord
The FFx Dashboard MTF alerter will show you on a single chart all the timeframes (M1 to Monthly) with their own status for the indicator. 2 Alert Options: Single timeframe: each selected timeframe alert separately when a signal occurs Multi timeframes: all selected timeframes must agree for an alert to be triggered Both options have an input to select the timeframes to be used for the alert(s). How to understand the status: Green/Red square: RSI above/below 50 line Green square + Red border: R
The FFx Dashboard MTF alerter will show you on a single chart all the timeframes (M1 to Monthly) with their own status for the indicator. 2 Alert Options: Single timeframe: each selected timeframe alert separately when a signal occurs Multi timeframes: all selected timeframes must agree for an alert to be triggered Both options have an input to select the timeframes to be used for the alert(s). How to understand the status: Green/Red square: Stoch above/below 50 line Green square + Red border:
The FFx Dashboard MTF alerter will show you on a single chart all the timeframes (M1 to Monthly) with their own status for the indicator. 2 Alert Options: Single timeframe: each selected timeframe alert separately when a signal occurs Multi timeframes: all selected timeframes must agree for an alert to be triggered Both options have an input to select the timeframes to be used for the alert(s). How to understand the status: Green/Red square: Price above/below Cloud (Kumo) Green square + Red bo
The FFx Dashboard MTF alerter will show you on a single chart all the timeframes (M1 to Monthly) with their own status for the indicator. 2 Alert Options: Single timeframe: each selected timeframe alert separately when a signal occurs Multi timeframes: all selected timeframes must agree for an alert to be triggered Both options have an input to select the timeframes to be used for the alert(s). How to understand the status: Green/Red square: MA pointing Up/Down Green square + Red border: MA po
The FFx Dashboard MTF alerter will show you on a single chart all the timeframes (M1 to Monthly) with their own status for the indicator. 2 Alert Options: Single timeframe: each selected timeframe alert separately when a signal occurs. Multi timeframes: all selected timeframes must agree for an alert to be triggered. Both options have an input to select the timeframes to be used for the alert(s). How to understand the status: Green square: Price above PSAR Red square: Price below PSAR Options
The FFx Dashboard MTF alerter will show you on a single chart all the timeframes (M1 to Monthly) with their own status for the indicator. 2 Alert Options: Single timeframe: each selected timeframe alert separately when a signal occurs Multi timeframes: all selected timeframes must agree for an alert to be triggered Both options have an input to select the timeframes to be used for the alert(s). How to understand the status: Green/Red square: CCI above/below levels (ie. 100/-100) Grey square: C
The FFx Dashboard MTF alerter will show you on a single chart all the timeframes (M1 to Monthly) with their own status for the indicator. 2 Alert Options: Single timeframe: each selected timeframe alert separately when a signal occurs Multi timeframes: all selected timeframes must agree for an alert to be triggered Both options have an input to select the timeframes to be used for the alert(s). How to understand the status: Green/Red square: ADX above level Grey square: ADX below level Red bor
The FFx Dashboard MTF alerter will show you on a single chart all the timeframes (M1 to Monthly) with their own status. 2 Alert Options: Single timeframe: each selected timeframe alert separately when a signal occurs Multi timeframes: all selected timeframes must agree for an alert to be triggered Both options have an input to select the timeframes to be used for the alert(s). How to understand the status: Green/Red square: bullish/bearish candle Options available in the FFx Dashboard Alerter
The [GRAFF] III manual trading system is based on multiple MetaTrader (MT4) indicators. Together, the entire PACK of GRAFF III indicators makes an advanced trading tool. The system consists of over 20 different custom-built indicators which have been carefully selected and tested in the long term to produce strong and efficient trading signals. The particular indicators are based on different mathematical formulas, so the entire system is calibrated to remove false signals from its own indicator
FFx Universal Strength Meter PRO is more than a basic strength meter. Instead of limiting the calculation to price, it can be based on any of the 19 integrated strength modes + 9 timeframes. With the FFx USM, you are able to define any period for any combination of timeframes. For example, you can set the dashboard for the last 10 candles for M15-H1-H4… Full flexibility! Very easy to interpret... It gives a great idea about which currency is weak and which is strong, so you can find the best pai
A simplistic indicator informing a user on RSI divergence by sending messages to mobile device and email. The indicator draws 2 vertical lines, marking two RSI extrema that formed the divergence. You get the alert, open the charts and make a decision. The indicator does not show past divergences, thus when you attach it to a chart for the first time you see nothing. Graphics and alerts will appear as soon as divergences do. Drop it in Tester to see how it works. Parameters: RSIPeriod - number of
Pan PrizMA CD Phase is an analogue of the МetaТrader 5 indicator , and is an option based on the Pan PrizMA indicator. Details . Averaging by a quadric-quartic polynomial increases the smoothness of lines, adds momentum and rhythm. Extrapolation by the sinusoid function near a constant allows adjusting the delay or lead of signals. The value of the phase - wave status parameter (which is close in meaning to the trigonometric phase or the angle of the radius-vector rotation in the trigonometric p
Green Wall Arrows
Daniel Luchinger
1 (1)
The Name Green Wall : Arrows hits a lot of TP, by changing the idea of non using SL as something bad, but instead use Small TP and a lot of free Margin and Patience. Use micro TP and a lot of Free Margin with this indicator on Forex. It also can be used with Binary Options. This strategy is intended to be traded Manually. This Indicator runs on Open Bar, arrows will delete when price are against it. The only Indicator Parameter is Alerts true/false, all the rest is included inside the code. Arro
Golden Monowave
Ahmed Mohamed Ali
Golden Monowave is monowave indicator, the monowave theory is one of Elliott wave approach and one of most complicate and accurate method. Golden Monowave can shortcut many major steps to identify and describe the monowave. It works on any timeframe and with any trading instrument, including currencies, indices, futures, etc. Input Parameters initial_Bars - set the initial number of bars to calculate. wave_color - select the color of the wave. label_color - select the color of labels. temp_labe
Ticks Size
Viktor Kolmakov
This indicator displays in a separate window the difference between the number of points which increased the price, and the number of points that decreased the price during the time interval specified in the settings. The time interval for calculation is expressed as the number of bars of the chart the indicator is attached to. This approach allows you to evaluate the movement direction (growth or fall) of the instrument's price, the strength of the movement and the size of the movement in point
FFx Basket Scanner
Eric Venturi-Bloxs
MetaTrader 5 version available here : https://www.mql5.com/en/market/product/24882 FFx Basket Scanner is a global tool scanning all pairs and all timeframes over up to five indicators among the 16 available. You will clearly see which currencies to avoid trading and which ones to focus on. Once a currency goes into an extreme zone (e.g. 20/80%), you can trade the whole basket with great confidence. Another way to use it is to look at two currencies (weak vs strong) to find the best single pairs
Altri dall’autore
HFT Fast M1 Gold Scalper MT5 EA
Martin Alejandro Bamonte
2.22 (9)
HFT AI FAST SCALPER V10.1 La versione più avanzata del nostro EA fino ad oggi, completamente ricostruita con decisioni basate sull’IA , votazione multi-IA e logica di trading dinamica . Ora non è più limitato solo a XAUUSD (Oro) su M1, ma supporta anche BTCUSD e ETHUSD , con ingressi ad alta frequenza, gestione intelligente del rischio e piena adattabilità. Questo EA combina IA gratuite connesse tramite OpenRouter con filtri avanzati per un trading di precisione in qualsiasi condizione di mer
ARIA Connector EA
Martin Alejandro Bamonte
2.21 (29)
Aria Connector EA – V4 (Macchina di Apprendimento + Modello di Apprendimento XGBoost +112 IA a Pagamento e Gratuite + Sistema di Votazione + Prompt Esterni ed Editabili) Mentre la maggior parte degli EA sul mercato afferma di utilizzare "IA" o "reti neurali" ma in realtà esegue solo script di base, Aria Connector EA V4 ridefinisce cosa significa il trading veramente alimentato dall'IA. Questa non è teoria, non è esagerazione di marketing, è una connessione diretta e verificabile tra la tua pia
HFT Fast M1 Gold Scalper V8 EA
Martin Alejandro Bamonte
3.67 (3)
VERSIONE ULTRA OTTIMIZZATA – MT4 HFT FAST M1 GOLD SCALPER V8.2 , nella sua versione MT4, è il rilascio più potente, stabile e raffinato fino ad oggi. HFT è uno scalper ad alta frequenza che opera esclusivamente sull’Oro (XAUUSD) nel timeframe M1, eseguendo un gran numero di operazioni ogni giorno. Supporta una leva finanziaria fino a 1:500 e funziona con size di lotto molto ragionevoli per una vera strategia di scalping. Per questo motivo, è necessario utilizzare conti dedicati al trading scalpi
Candle Probability Scalper
Martin Alejandro Bamonte
Guida all'uso del Candle Probability Scalper Questo indicatore rende lo scalping facile e al 100% intuitivo. Candle Probability Scalper ti mostrerà a colpo d'occhio le percentuali di forza degli acquirenti e dei venditori in TEMPO REALE sulla candela attuale. Le percentuali vengono aggiornate a ogni tick, consentendoti di sapere, secondo per secondo, cosa stanno facendo la maggior parte degli acquirenti e dei venditori, senza alcun ritardo. Ciò ti aiuterà immensamente a determinare o confermare
Ai FGS EA
Martin Alejandro Bamonte
1 (1)
This EA is a private edition developed for traders who are part of our advanced testing and support program. It offers early access to selected configurations and system updates that will later be integrated into the main public release. Only users who have previously communicated with our team and received confirmation should proceed with the purchase. The EA operates using our latest optimization logic and is intended for professional traders who understand the importance of running control
Aurum Apex Mt4 EA
Martin Alejandro Bamonte
5 (2)
Ora puoi scaricare la versione demo di Aurum Apex dalla scheda Commenti per valutarne le prestazioni in tempo reale con il tuo broker! Aurum Apex EA è un potente strumento di trading automatico al 100% progettato per la piattaforma MT4. Analizza il mercato in tempo reale e rileva varie opportunità di trading. Adatto a tutti i livelli di trader, Aurum Apex EA offre tre modalità di rischio regolabili tramite il parametro di Rischio: Rischio = 0.1 (Basso Rischio): Ideale per i nuovi trader poco fa
Scalping Signal NO Repaint NO Lag
Martin Alejandro Bamonte
3 (2)
"Scalping Signal No Repaint No Lag" è l'unico indicatore sul mercato che, quando trascinato su qualsiasi grafico, carica automaticamente tutti gli indicatori necessari senza la necessità di caricare alcun template o altri indicatori. Configura automaticamente il grafico in modo che appaia esattamente come nell'immagine fornita. Questo indicatore garantisce segnali senza ridisegno né ritardo, rendendolo ideale per strategie di scalping su tutte le coppie di valute e su tutti i timeframe (TF). Fun
Clear Breakout
Martin Alejandro Bamonte
5 (2)
L'indicatore "Breakout Buy-Sell" è progettato per identificare e evidenziare potenziali opportunità di acquisto e vendita basate su breakout di prezzo durante diverse sessioni di mercato (Tokyo, Londra e New York). Questo indicatore aiuta i trader a visualizzare chiaramente le zone di acquisto e vendita, nonché i livelli di take-profit (TP) e stop-loss (SL). Strategia di utilizzo L'indicatore può essere utilizzato come segue: Impostazione iniziale : Seleziona la sessione di mercato e regola il G
GbpUsd Pip Hunter EA
Martin Alejandro Bamonte
GBPUSD Pip Hunter EA Caratteristiche principali: Ottimizzato per GBPUSD su M15: Progettato e testato specificamente per la coppia GBPUSD su un grafico a 15 minuti. Dimensione minima del conto consigliata: Richiede un saldo minimo del conto di $1000 per garantire drawdown bassi. Compatibilità degli spread: Miglior utilizzato con conti a spread basso o ECN per massimizzare la redditività. Gestione del rischio: Include un'opzione per disattivare la funzione di Lotto Esponenziale impostandola a 1.0,
L'indicatore MTFMA (Medie Mobili Multi-Temporali) utilizza più medie mobili (MA) in diversi intervalli di tempo per fornire segnali di acquisto e vendita (che non ridisegnano) in una finestra separata dal grafico principale. È versatile e facile da interpretare, adatto sia per lo scalping in intervalli di tempo più piccoli sia per il trading a lungo termine in intervalli di tempo maggiori. Perché è Multi-Temporale? Il termine multi-temporale si riferisce alla capacità dell'indicatore di utilizza
Indicatore NextCandlePredictor NextCandlePredictor, un indicatore di segnale con allerta che non ridisegna, non cambia colore, non si muove, non scompare e non ha ritardi. Ti aiuterà a identificare la direzione delle prossime candele in qualsiasi timeframe. Altamente raccomandato per i mercati ad alta volatilità come New York, Londra o anche la sovrapposizione di entrambi. Caratteristiche Principali: Versatilità nei Timeframe: Fornisce segnali rapidi e precisi in qualsiasi timeframe, da M1 a H1
L'indicatore "MultiSymbol & TF Chart Integrated" è progettato per fornire una visione completa del mercato rapidamente, permettendoti di monitorare fino a 60 coppie di valute nei timeframe preferiti su un unico grafico (modalità multipla) o visualizzare la coppia che stai negoziando su tutti i TF (modalità semplice). Vantaggi Principali: Monitoraggio Completo: Permette di monitorare in tempo reale tutte le coppie desiderate su un unico grafico a colpo d'occhio. Risparmio di Tempo: Evita la neces
Pairs and TF Changer
Martin Alejandro Bamonte
Sei stanco di passare da un grafico all'altro per monitorare diverse coppie di valute e timeframe? L'indicatore Pairs and TF Changer è qui per rivoluzionare la tua esperienza di trading! Una volta caricati tutti gli indicatori per la tua strategia, aggiungi Pairs and TF Changer al grafico. Se necessario, puoi quindi regolare la sua posizione, i colori o il numero di colonne visualizzate! Caratteristiche principali: Integrazione senza soluzione di continuità: Integra facilmente questo indicatore
GO Trend MultiTimeFrame
Martin Alejandro Bamonte
Indicatore GoTrend Multi-Timeframe L'indicatore "GoTrend Multi-Timeframe" è uno strumento essenziale per i trader che cercano un modo rapido ed efficiente per valutare le tendenze generali e specifiche di una coppia di valute su diversi timeframe. Questo indicatore consente ai trader di ottenere una visione chiara e completa della direzione del mercato a colpo d'occhio, ottimizzando il processo decisionale e migliorando l'efficacia delle loro strategie di trading. Caratteristiche Principali: Ana
Gold Vertex EA
Martin Alejandro Bamonte
Gold Vertex EA is a reliable and stable option for those looking to automate their trading in the gold market. With a robust system based on one of the most effective indicators and a solid trend-following strategy, Gold Vertex EA is a powerful tool for traders who want precise, worry-free trading. Requirements Platform : MetaTrader 4 Supported Instruments : Specifically developed and configured for Gold (XAUUSD) Recommended Account Type : ECN or low spread Minimum Deposit Recommended : $100 Tim
Inferno Signals EA
Martin Alejandro Bamonte
Inferno Signals EA è progettato per sfruttare i movimenti più significativi del mercato, operando sul solido timeframe M30. È ideale per coloro che desiderano iniziare con un piccolo investimento iniziale, a partire da soli 100 $ per coppia, con una gestione automatica del capitale che include regolazioni dinamiche dei lotti e livelli di sicurezza come lo Stop-Loss (SL). Con un basso drawdown e una strategia focalizzata sulla cattura delle migliori opportunità, Inferno Signals EA mira a massimiz
MarketPrice Indicator
Martin Alejandro Bamonte
L'indicatore MarketPrice è progettato per fornire una visualizzazione rapida che permette di vedere a colpo d'occhio la direzione della tendenza di una coppia di valute su tutti i frame temporali (Time Frames), facilitando e velocizzando le decisioni di trading. MarketPrice Indicator si basa su livelli giornalieri e segnali di trading derivati dall'incrocio di medie mobili e la forza del mercato secondo diversi indicatori tecnici. È già completamente configurato, ma è possibile modificare qualsi
Last 50 Pips
Martin Alejandro Bamonte
L'indicatore Last 50 Pips è progettato per identificare rapidamente opportunità di acquisto e vendita basate sul comportamento recente dei prezzi. Misura la variazione dei prezzi nelle ultime candele per evidenziare in giallo i momenti in cui il prezzo potrebbe cambiare direzione. Segnale di acquisto: Dovresti aprire una posizione di ACQUISTO quando l'indicatore passa da ROSSO a GIALLO , suggerendo un cambiamento da una tendenza al ribasso a una al rialzo. Consulta le immagini per vedere quanto
FlashPoints Breakout
Martin Alejandro Bamonte
Ogni giorno all'inizio del mercato, Flashpoints Breakout esamina i livelli di pivot, supporto e resistenza utilizzando i dati del giorno precedente (massimo, minimo e chiusura) per calcolare due livelli di breakout (rialzista e ribassista). In questo modo, avrai i nuovi livelli di ingresso pronti per la mattina, insieme ai valori di Take Profit (TP) e Stop Loss (SL), permettendoti di piazzare ordini pendenti Buy Stop o Sell Stop senza ulteriori calcoli. Con Flashpoints Breakout , ogni giorno puo
Buy Sell Magic Signal
Martin Alejandro Bamonte
BUYSELLMAGIC is a non-repainting signal-type trading indicator designed to precisely detect entry points in the market.  Features Reliable and permanent signals : BUYSELLMAGIC signals are final once the candle closes, ensuring they will not be modified or removed from the chart. This gives you the confidence of working with an indicator that keeps its signals stable and trustworthy. Comprehensive alerts : In addition to signals on the chart, you’ll receive notifications via email, pop-up alerts
Automatic Fibonacci Pivots
Martin Alejandro Bamonte
Automatic Fibonacci Pivots automatically calculates pivot levels and support/resistance based on Fibonacci, clearly showing key reference points that indicate potential reversal or trend continuation zones, as well as buy and sell areas . Designed for traders seeking clarity on charts without having to recalculate and manually place Fibonacci levels each time. Once set up on your computer, it will send an alert to your phone when a potential buy/sell signal is issued, allowing you to trade direc
M1 Easy Scalper
Martin Alejandro Bamonte
4 (3)
M1 EASY SCALPER è un indicatore di scalping progettato specificamente per il timeframe di 1 minuto (M1), compatibile con qualsiasi coppia di valute o strumento disponibile sul tuo terminale MT4. Naturalmente, può essere utilizzato anche su altri timeframe, ma funziona particolarmente bene su M1 (che è impegnativo!) per fare scalping. Nota: se intendi fare scalping, assicurati di avere un conto adatto. Non usare conti Cent o Standard, perché hanno spread troppo elevati! (usa conti ECN, RAW o Zero
Trade Insights Display
Martin Alejandro Bamonte
Trade Insights Display is the ideal companion for traders who want to operate with clarity and precision. This indicator provides real-time access to critical account data, such as: Balance Equity Margin Spread Swap Remaining time for the current candle . These data points are essential, regardless of the strategy or other indicators you use. Having this indicator always visible allows you to quickly assess your account status, the swap for each pair (helping you avoid high-cost trades), and the
EuroGeddon EA
Martin Alejandro Bamonte
EUROGEDDON EA – Performance Incomparabile con Rischio Controllato EUROGEDDON EA è un robot di trading completamente automatico con INTELLIGENZA ADATTIVA , creato per la crescita costante di piccoli conti mantenendo un controllo totale sul capitale. Con un lotto di 0.01 ogni 200 $ sul conto, opera con un rischio molto basso e raggiunge un Drawdown estremamente contenuto , offrendo una performance che vale davvero la pena testare di persona. Scarica la versione demo e provala dal vivo. Non
ZeroLag TrendCandle Signal
Martin Alejandro Bamonte
ZeroLag TrendCandle — Sistema di colorazione delle candele e allarmi in tempo reale (Senza Repainting) ZeroLag TrendCandle è uno strumento di rilevamento del trend in tempo reale che applica una colorazione delle candele senza repaint basata su un'analisi avanzata dell'indicatore Williams Percent Range (WPR). Evidenzia i cambiamenti di trend, le variazioni di momentum e i potenziali inversioni tramite un sistema cromatico dinamico — consentendo ai trader di capire immediatamente la direzione d
Candle Fusion Pro
Martin Alejandro Bamonte
Candle Fusion Pro — Riconoscimento dei pattern + Filtro di tendenza + Filtro di momentum (Nessun repaint) Rileva potenti pattern di candele giapponesi e conferma la loro forza con analisi in tempo reale di trend e momentum. Candle Fusion Pro è lo strumento visivo definitivo per i trader che si affidano a precisione del price action , struttura del trend e conferme multilivello . Funzionalità principali Entrata basata su pattern : Rileva oltre 10 pattern avanzati giapponesi , tra cui: Shooting
ClearView Trend Finder
Martin Alejandro Bamonte
ClearView Trend Finder — Lo vedi quanto è chiaro? Hai mai avuto la sensazione che il tuo grafico sia troppo caotico? Troppi indicatori, segnali contrastanti e linee che complicano solo l'analisi? ClearView Trend Finder elimina completamente questo disordine visivo e ti permette di concentrarti sull’unica cosa che conta davvero: la tendenza chiara . Questo sistema trasforma il grafico in una vista pulita e precisa, che non si ridisegna né si modifica mai. Ogni candela è filtrata per mostrare so
Filtro:
Nessuna recensione
Rispondi alla recensione