Hit Rate Top Bottom Signal

ヒット率トップボトムシグナル

ヒット率トップボトムシグナル

ヒット率トップボトムシグナル は、完全に革新的なアプローチを提供します。特定のTP-SLとPAIRS/TFで最も優れたパフォーマンスを発揮する方法を事前に評価したい方に理想的です。

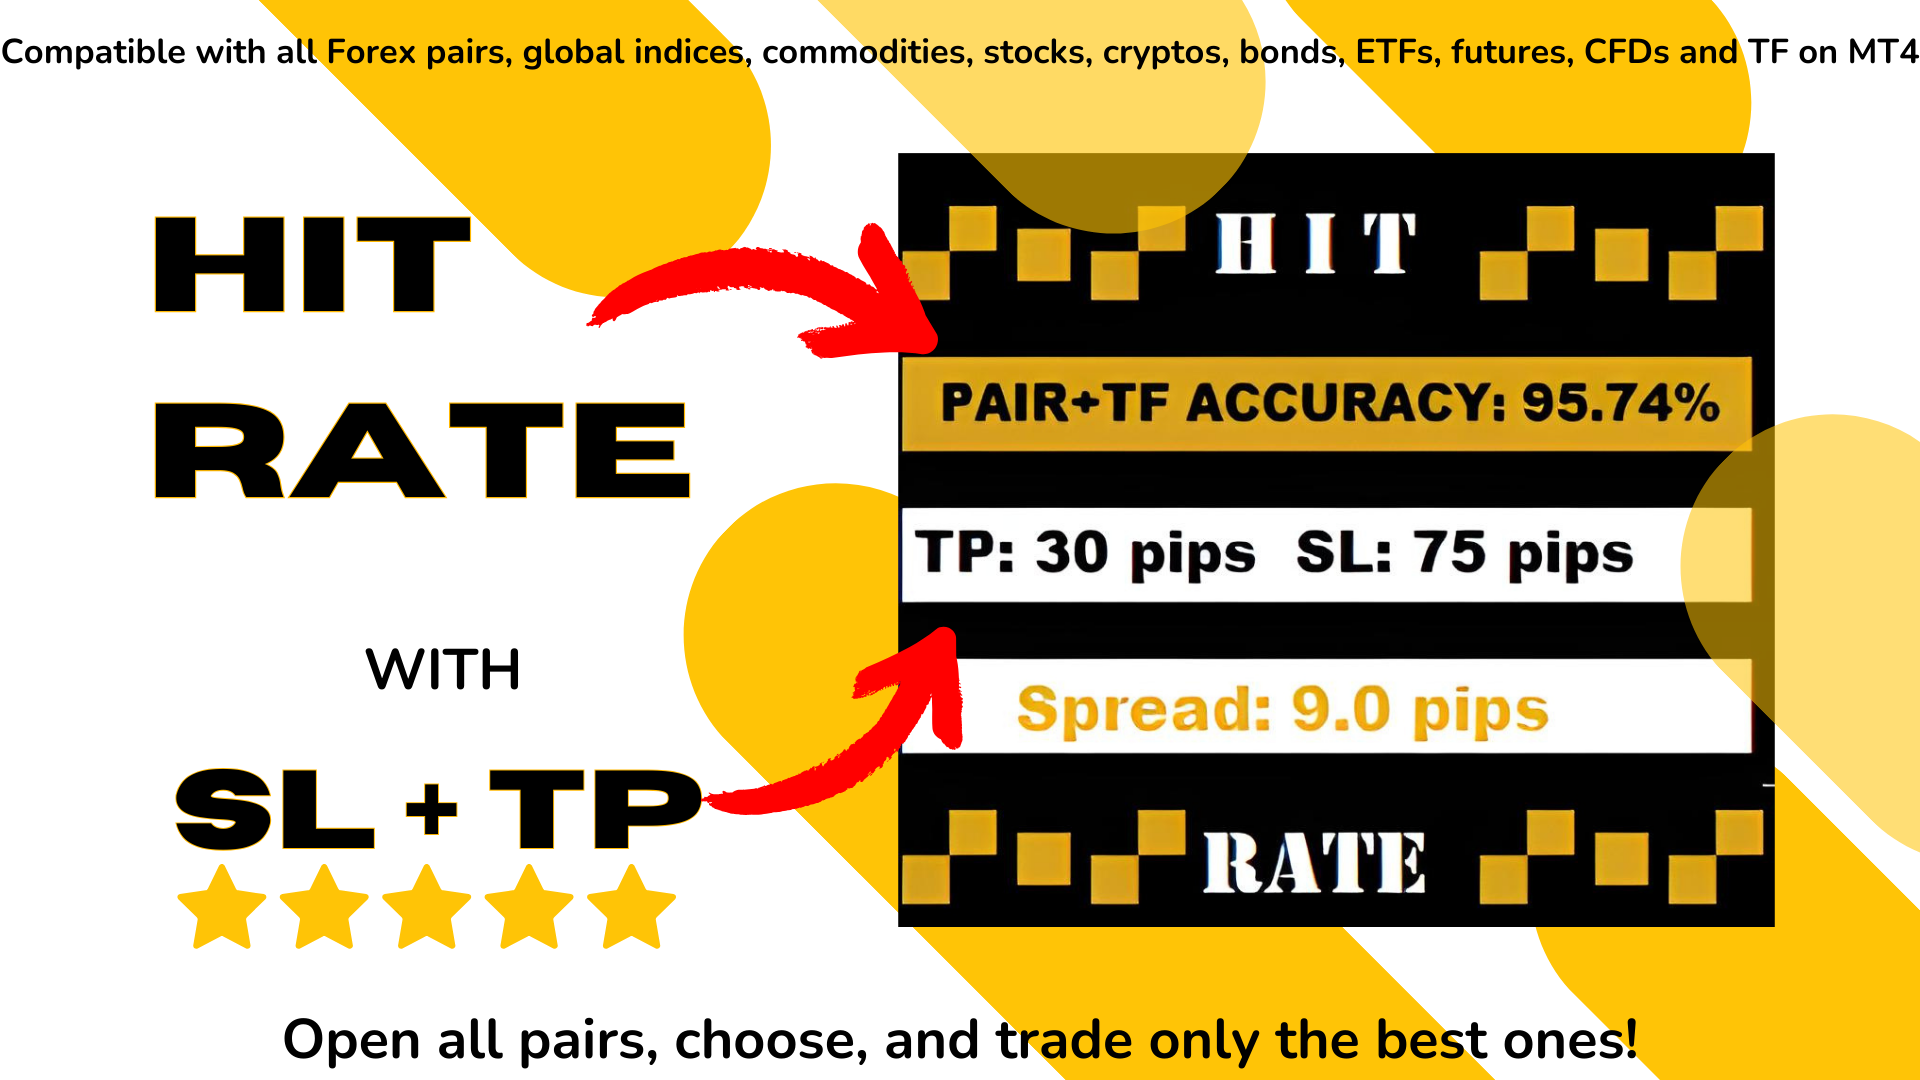
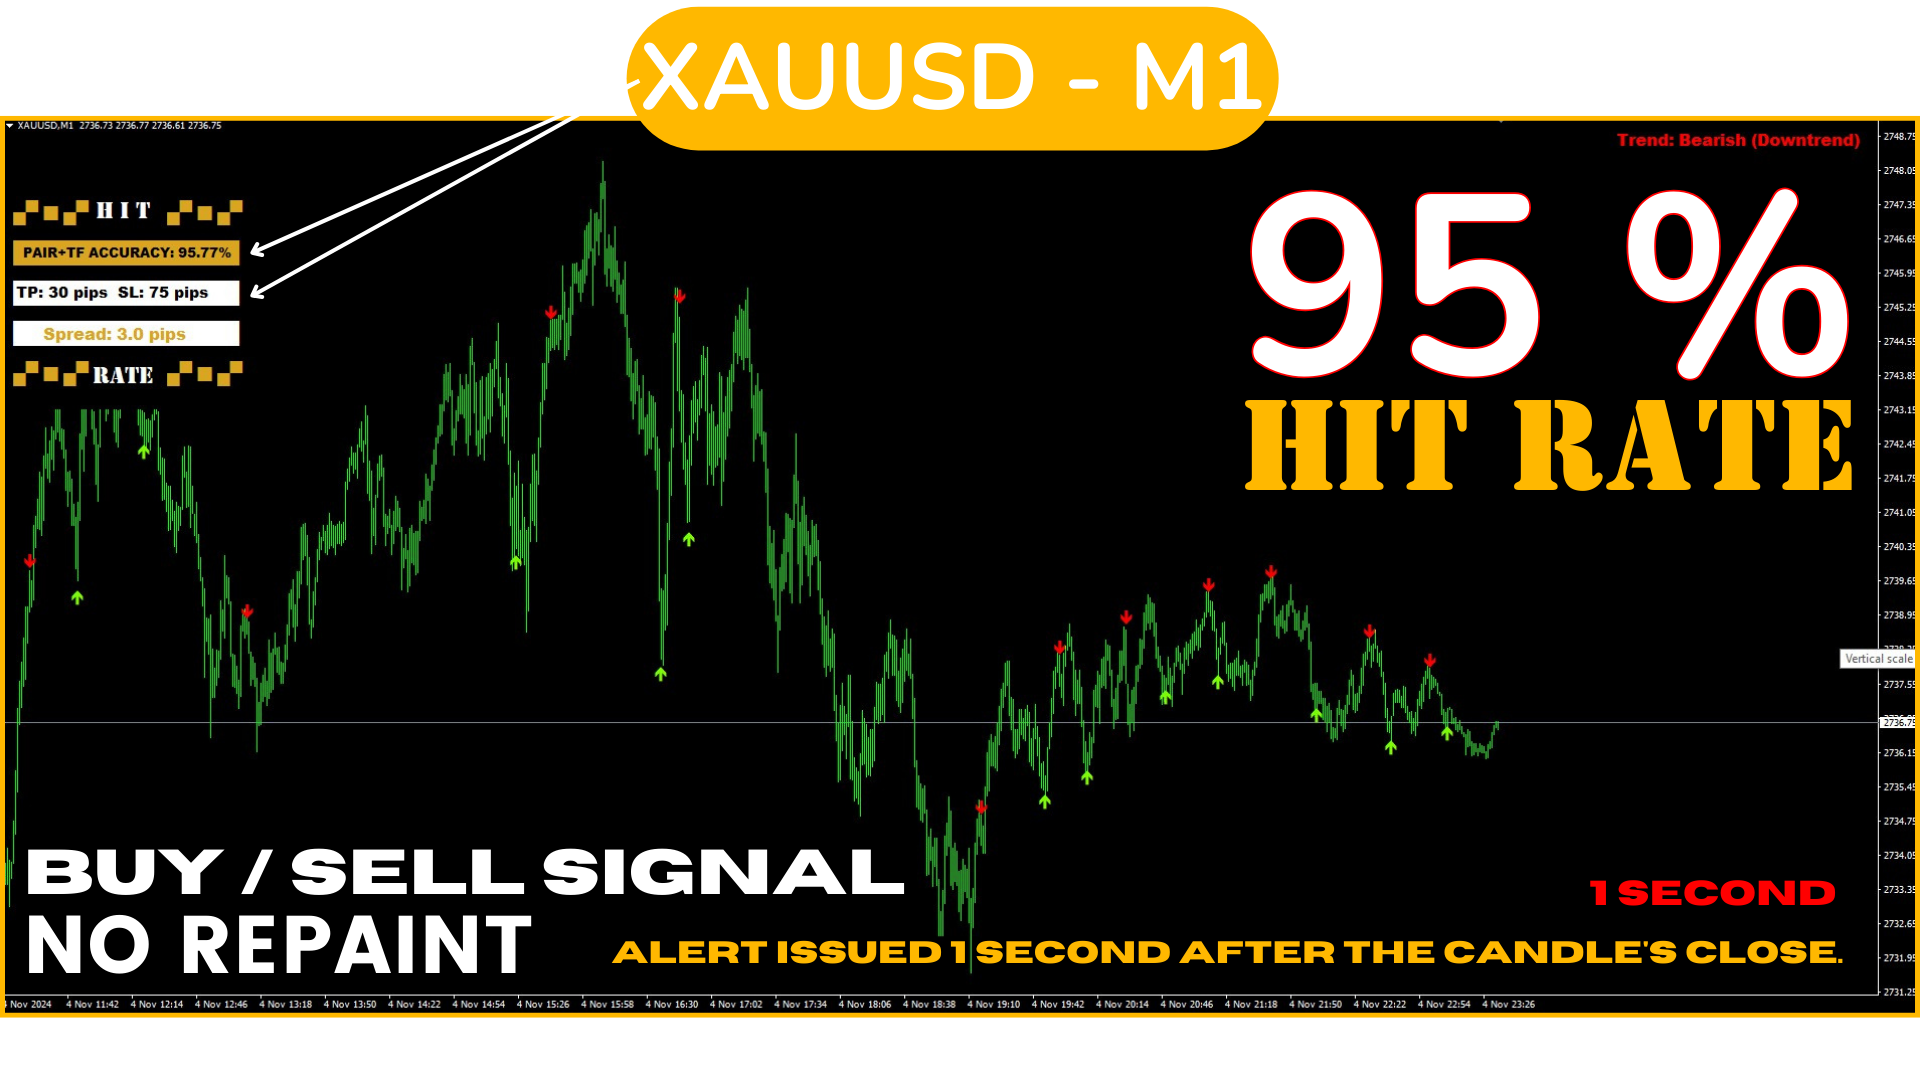
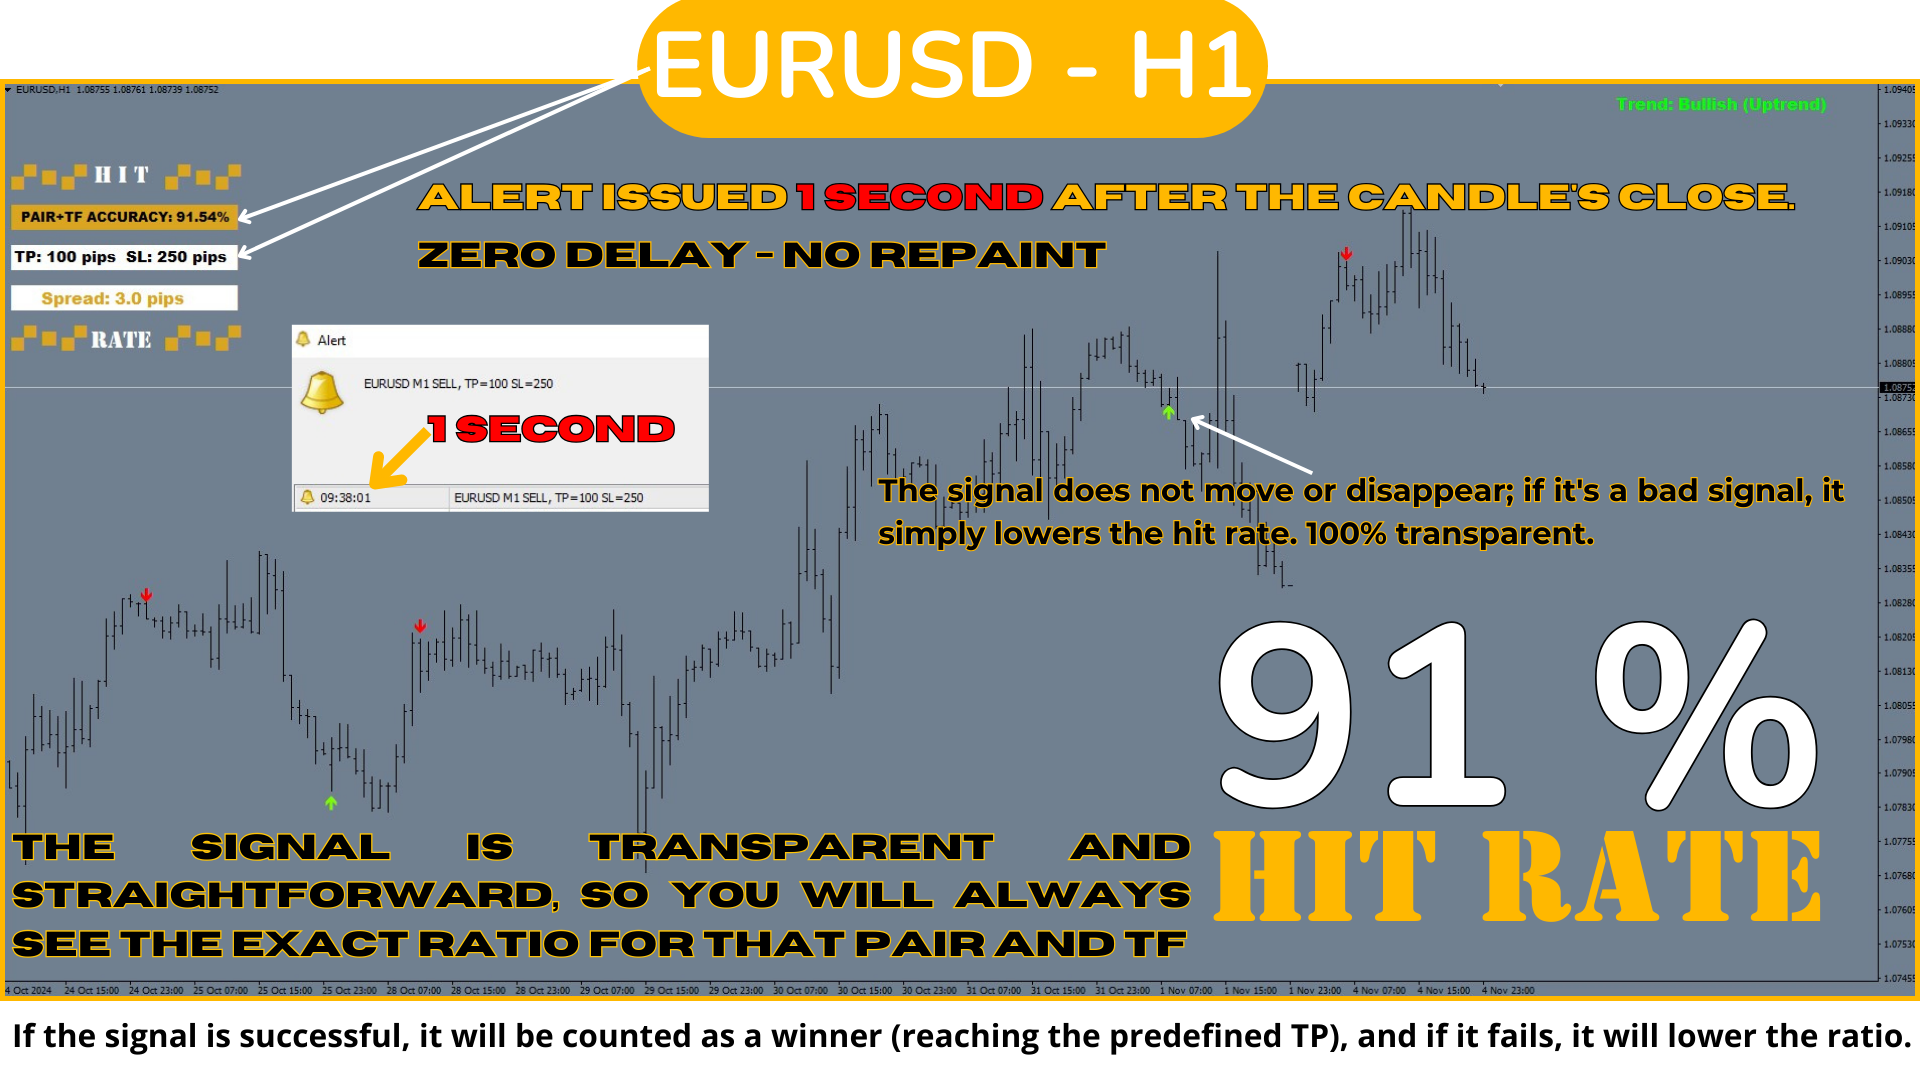
ヒット率トップボトムシグナル 戦略は、すべてのトレーダーとトレードスタイルにとって基本的なツールです。これは、リペイントしない精度の高いシグナルを提供し、どのタイミングでどの方向に取引するかを明確に示すだけでなく、各通貨ペアとTFのヒット率を詳細に記録し、あらかじめ設定されたテイクプロフィット(TP)とストップロス(SL)を提供するためです。これにより、シグナルの有効性の比率を事前に知ることができ、リスク管理と正確な取引に非常に重要です。

この戦略の特徴は、全体的な動きではなく、インパルス内のリバーサルポイントの検出に焦点を当てている点で、従来のトップボトムよりも頻繁にシグナルが発生し、
市場の重要な各変動のキーとなる瞬間に焦点を当てています。


このシグナルの歴史的な効果を%で表示するSL/TP比率との組み合わせにより、この戦略は安全に取引するための最適な選択肢となり、トレーダーがデータに基づいて意思決定を行えるようになります。クリアで直接的かつ履歴のあるシグナルを使用することで、最適な戦略の一つを利用していることになります。


このシステムで取引する方法は?

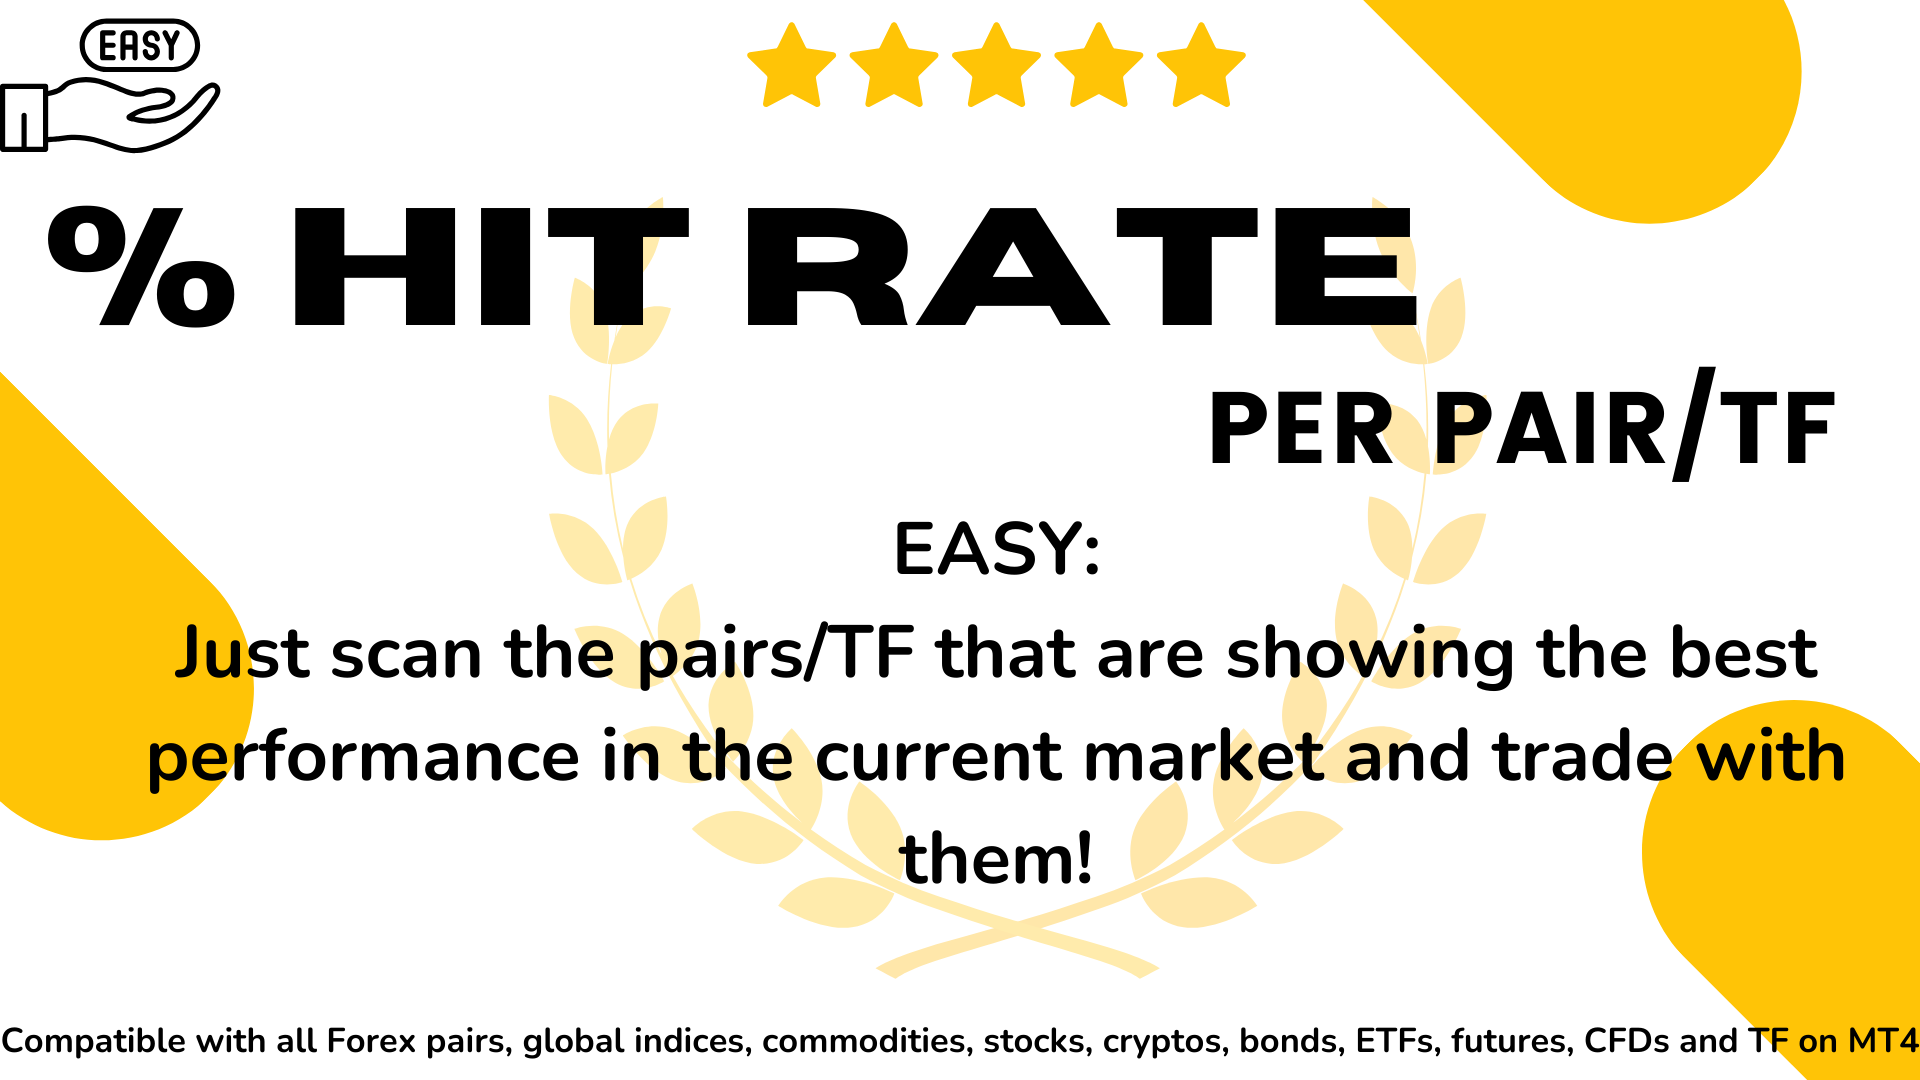
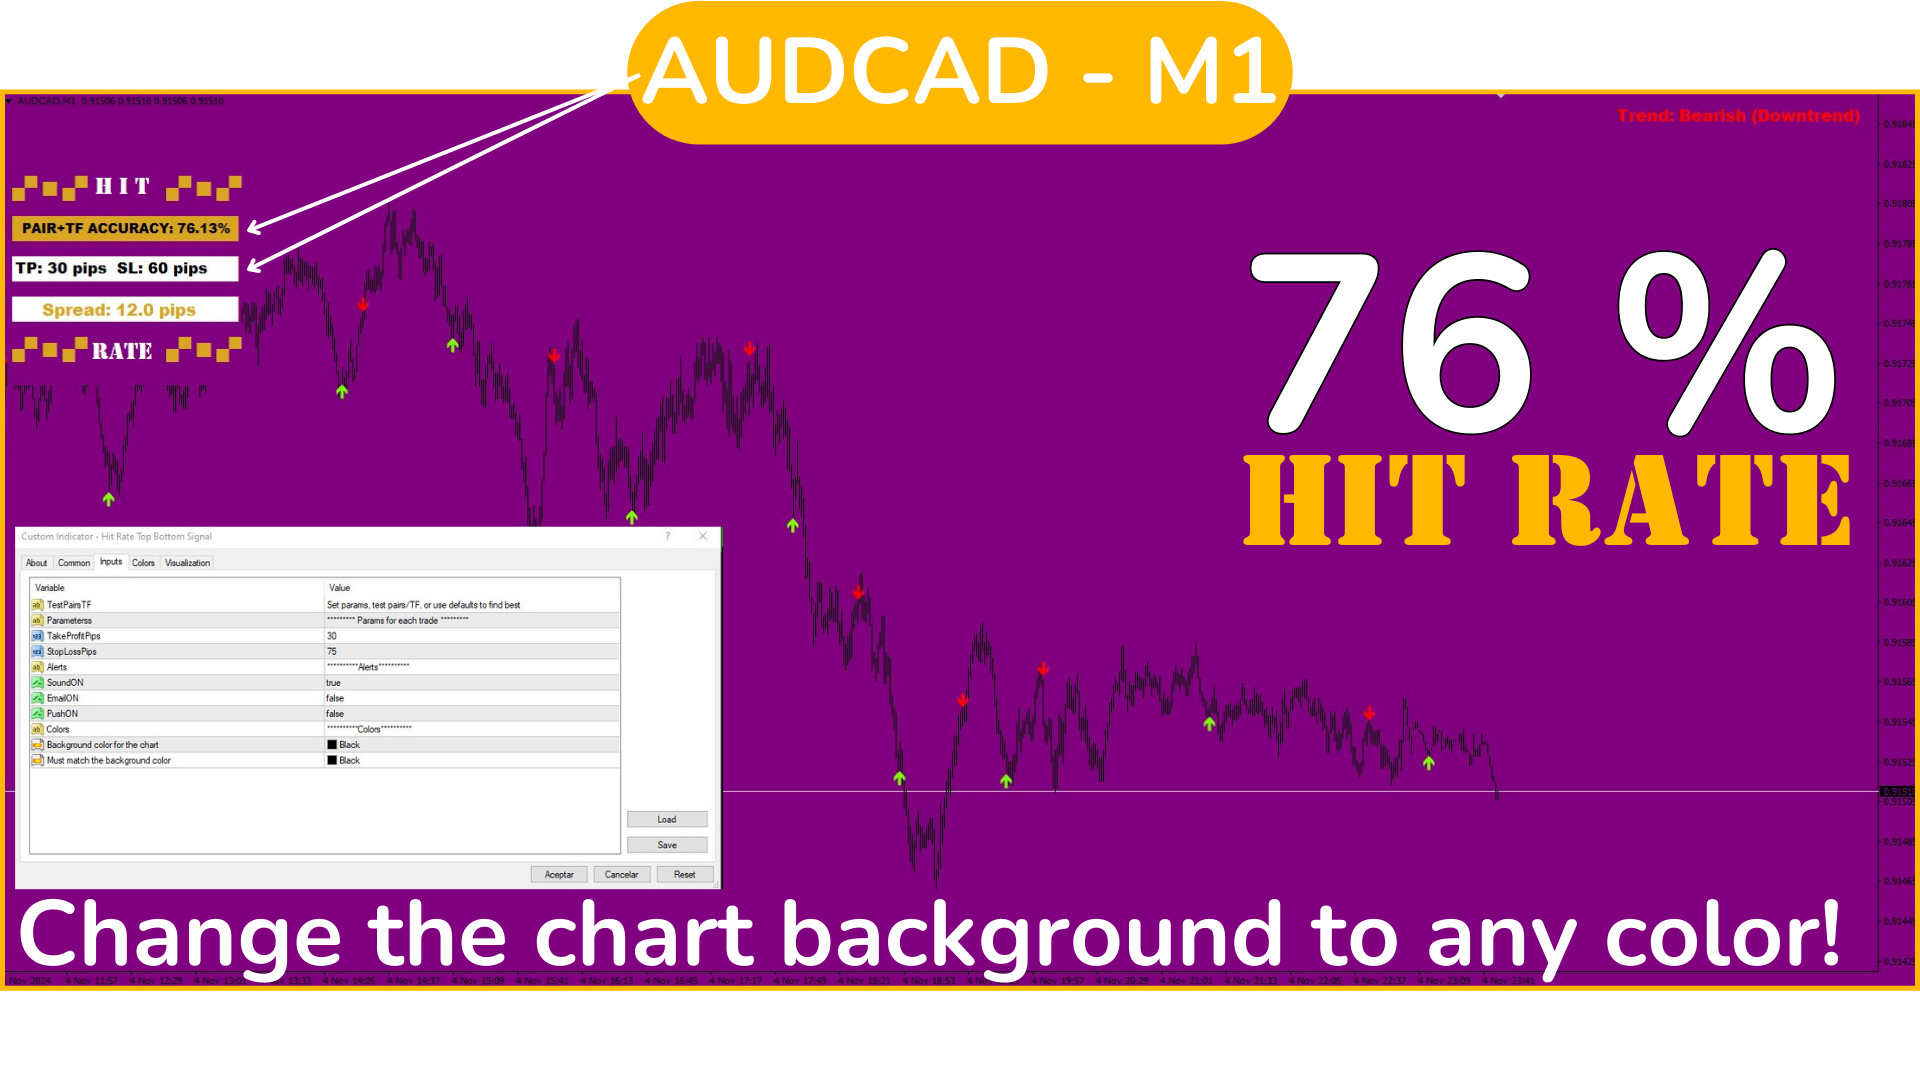
複数の通貨ペアを開き、それぞれにインジケーターをロードします。その後、各ペアを分析し、どのペアとTF(タイムフレーム)でシグナルが最適なパフォーマンスを発揮しているかを特定し、それに集中してください。(画像参照)

デフォルトでは、シグナルはTPが100ピップ、SLが250ピップで設定されていますが、取引したい値を設定することも、デフォルトのままにすることも可能です。

SLがH1での250ピップとM1での250ピップは同じではないことに注意してください。しかし、心配はいりません。SLとTPのパラメータを手動で更新することで、新しいパラメータに対するシグナルのヒット率が再計算され、これらのパラメータでの期待される結果を事前に知ることができます。

こうして、各ペアの特定のパラメータを調整し、そのペアとTFで戦略を「最適化」してシグナルのヒット率を知ることができます。このプロセスは毎日、取引を開始する前に行うことをお勧めします。デフォルトのパラメータは、通貨ペアに応じてM30やH1といったTFで最も効果的に機能します。

ステップバイステップ:

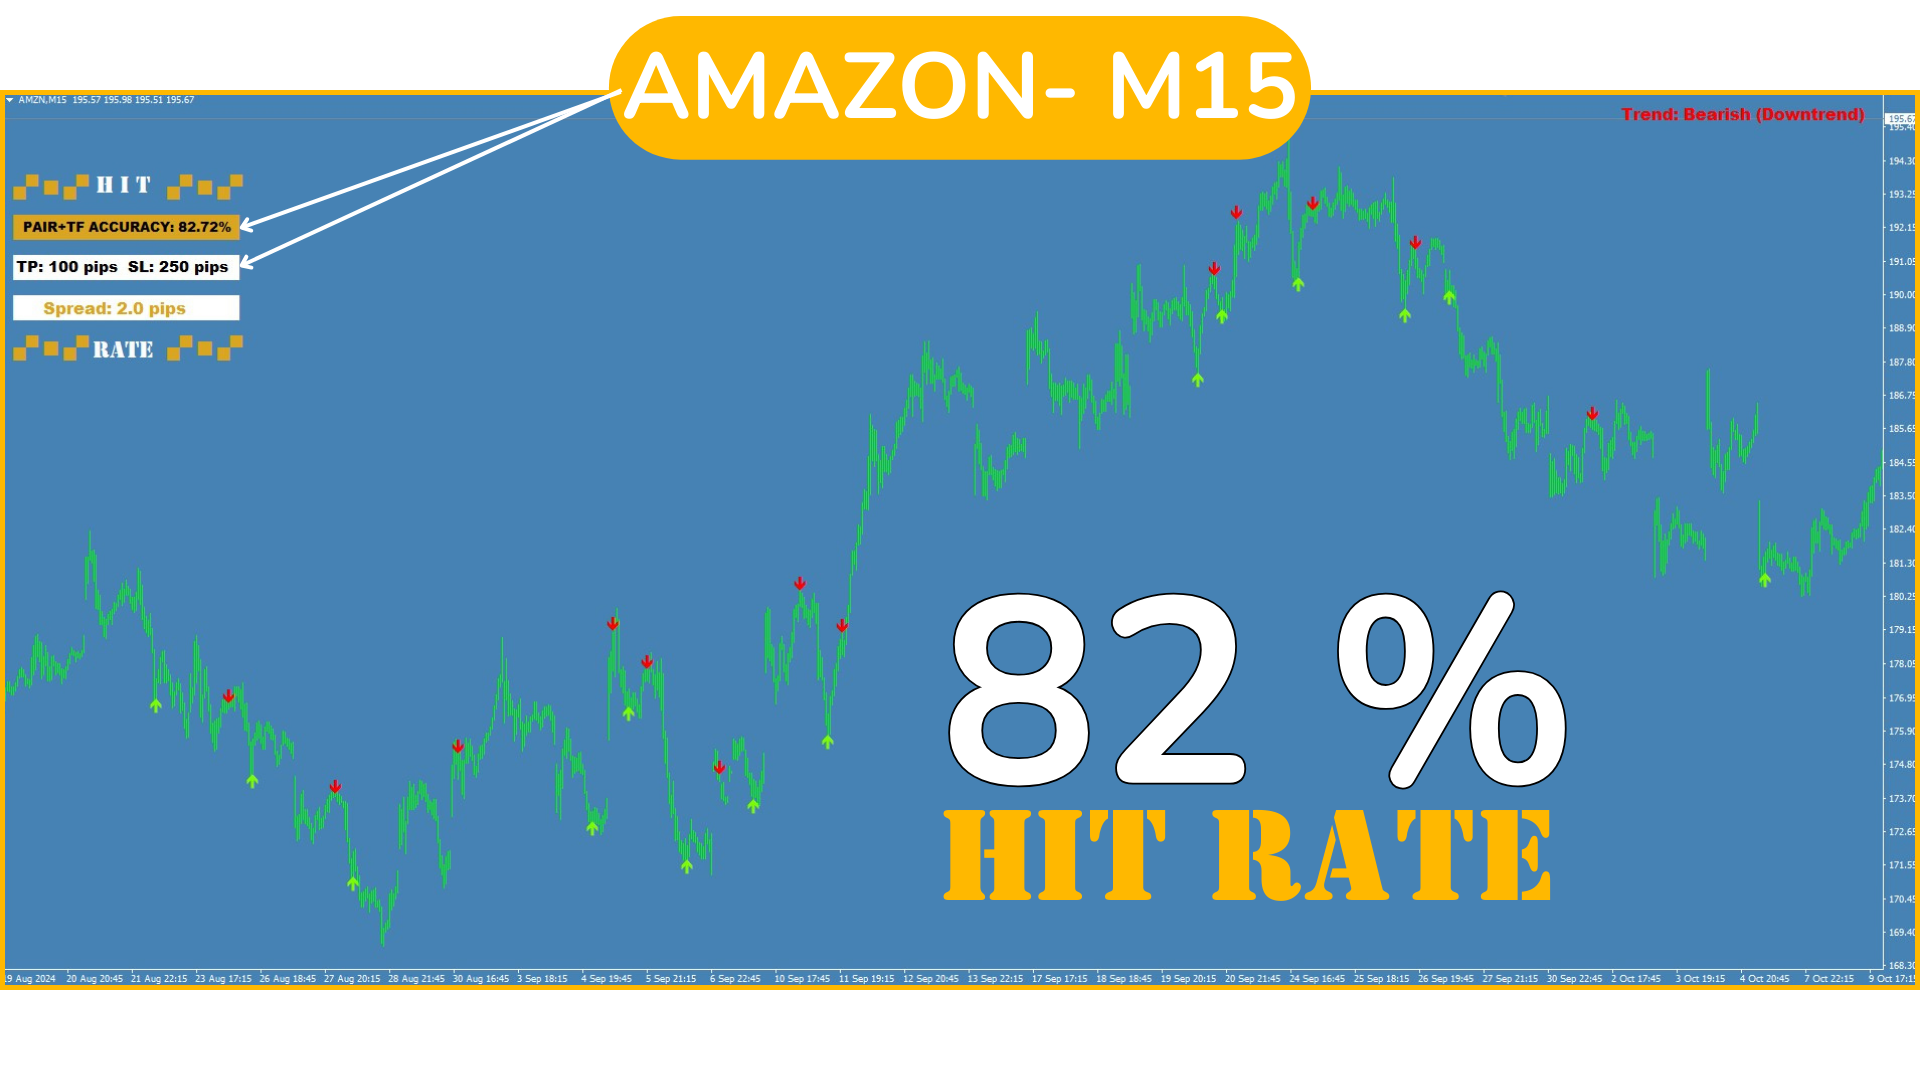
  1. 通貨ペアを選び、各TFを確認します。 たとえば、デフォルトのTPとSL設定を使用している場合、ヒット率が85〜90%以上のTFを確認し、そのTFを選択します。デフォルトのTPとSLを使用しない場合、最適な比率を理解するためには、以下の「SL/TPとヒット率の比率」を参照してください。

  2. 利用可能なすべてのペアで手順を繰り返します。開いているペアが多いほど、取引機会が増えます。

  3. シグナルを待ち、シグナルが発生したらすぐに取引を開始します。事前に設定されたSLとTPを遵守します。

  4. 使用するTPとSLを選択したい場合、まず「インプット」タブでデータを変更し、各ペアの値をピップ単位で設定します。その後、そのペアの各TFを確認し、最も効果的なものを選択してシグナルに注意を払います。
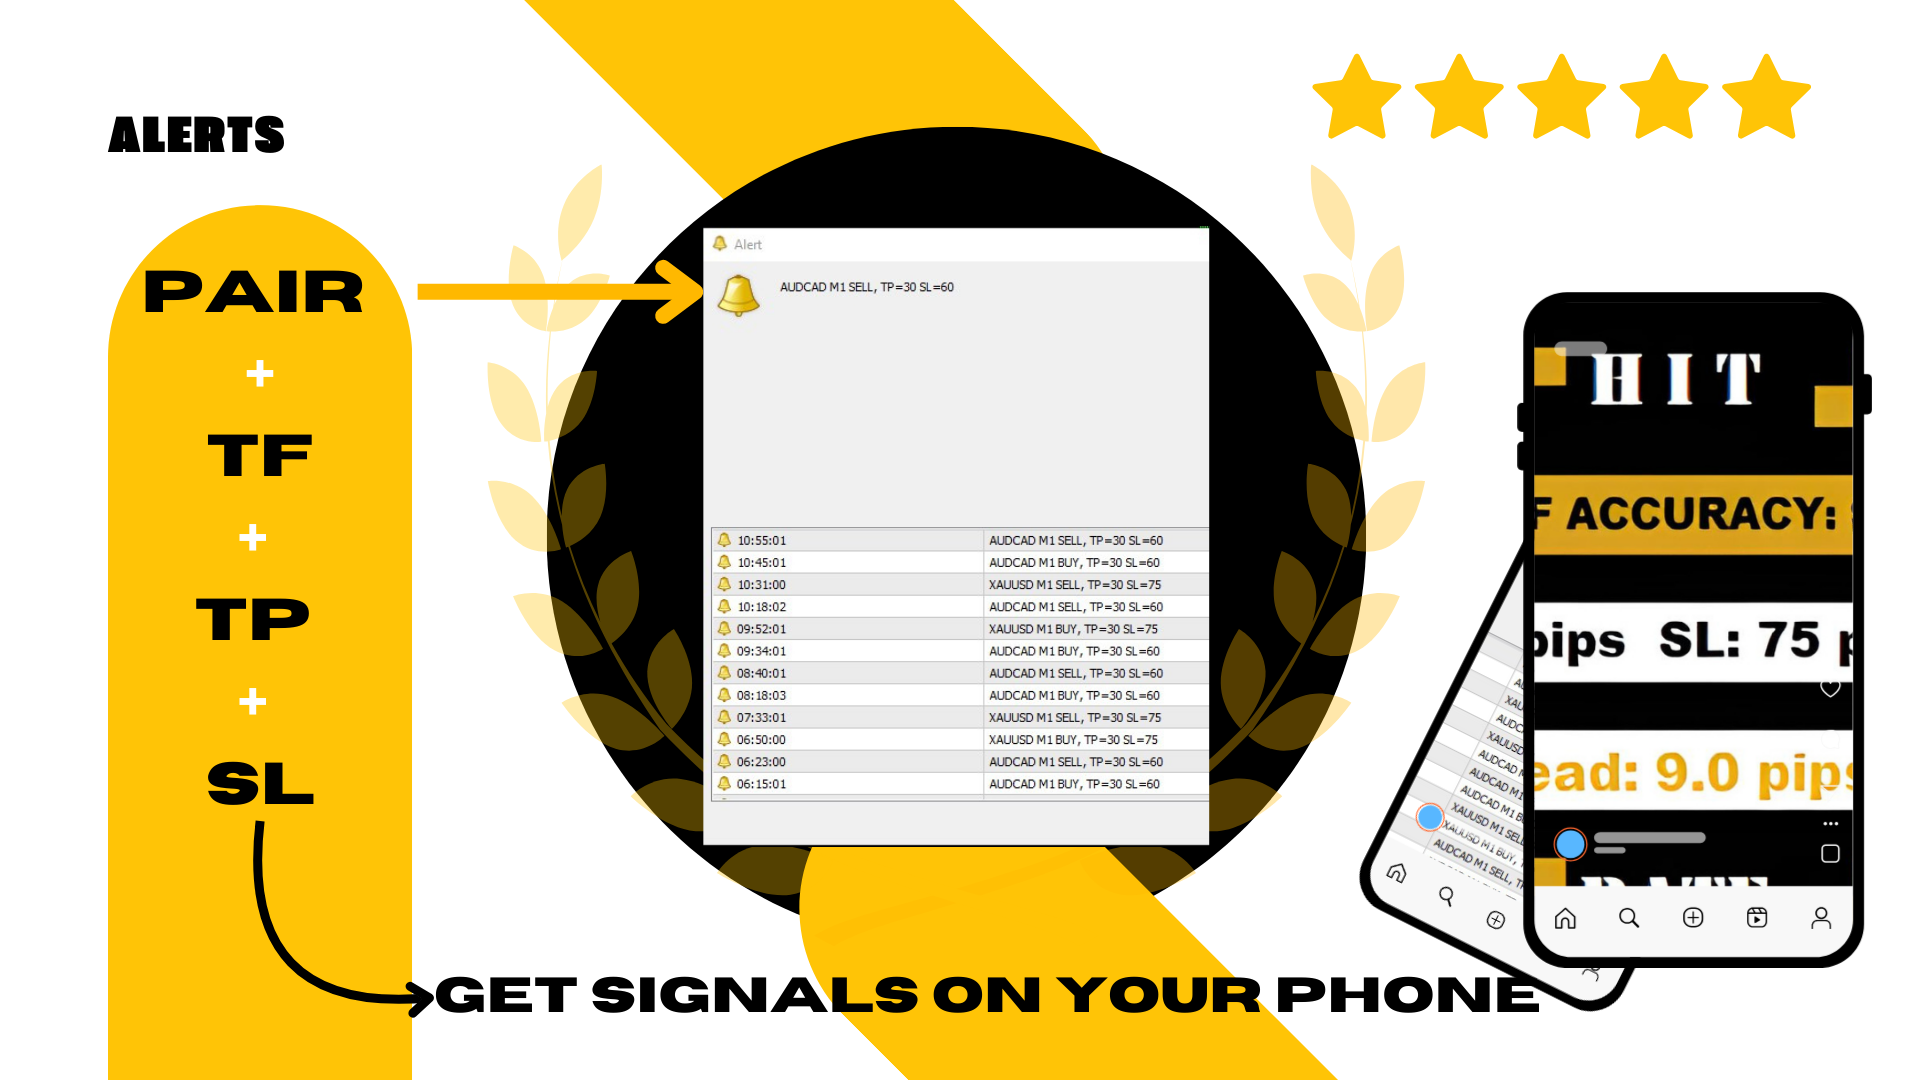
携帯電話で自由に取引:

この「ステップバイステップ」プロセスは、コンピューターで設定する必要がありますが、その後、携帯電話で取引通知を受け取ることができます。 方法は?MT4ターミナルでプッシュメッセージを受信するように携帯電話を設定し、端末から携帯電話への通知を許可してください。

シグナルが発行されると、携帯電話に通知が届きます:通貨ペア - TF - シグナルの種類(買/売) - およびそのペアの事前設定されたTPとSL値。


このようにして、コンピュータの前に常にいる必要はありません。携帯電話から取引を開始し、ペアのSLとTPを設定して、常時監視する必要がなくなります。

ただし、コンピュータで取引したい人のために、音声およびビジュアルシグナルが画面に表示され、シグナルが発行されるたびに同じデータ(通貨ペア - TF - シグナルの種類およびTPとSL値)を確認できます。


SL/TPとヒット率の比率の理解

取引戦略の成功は、2つの重要な要素に依存します一つはストップロス(SL)とテイクプロフィット(TP)間の比率、もう一つはシグナルのヒット率です。どちらも戦略の収益性において重要な役割を果たし、それらがどのように連携して機能するかを理解することが、システムの最適化には不可欠です。

1. SL/TP比率:

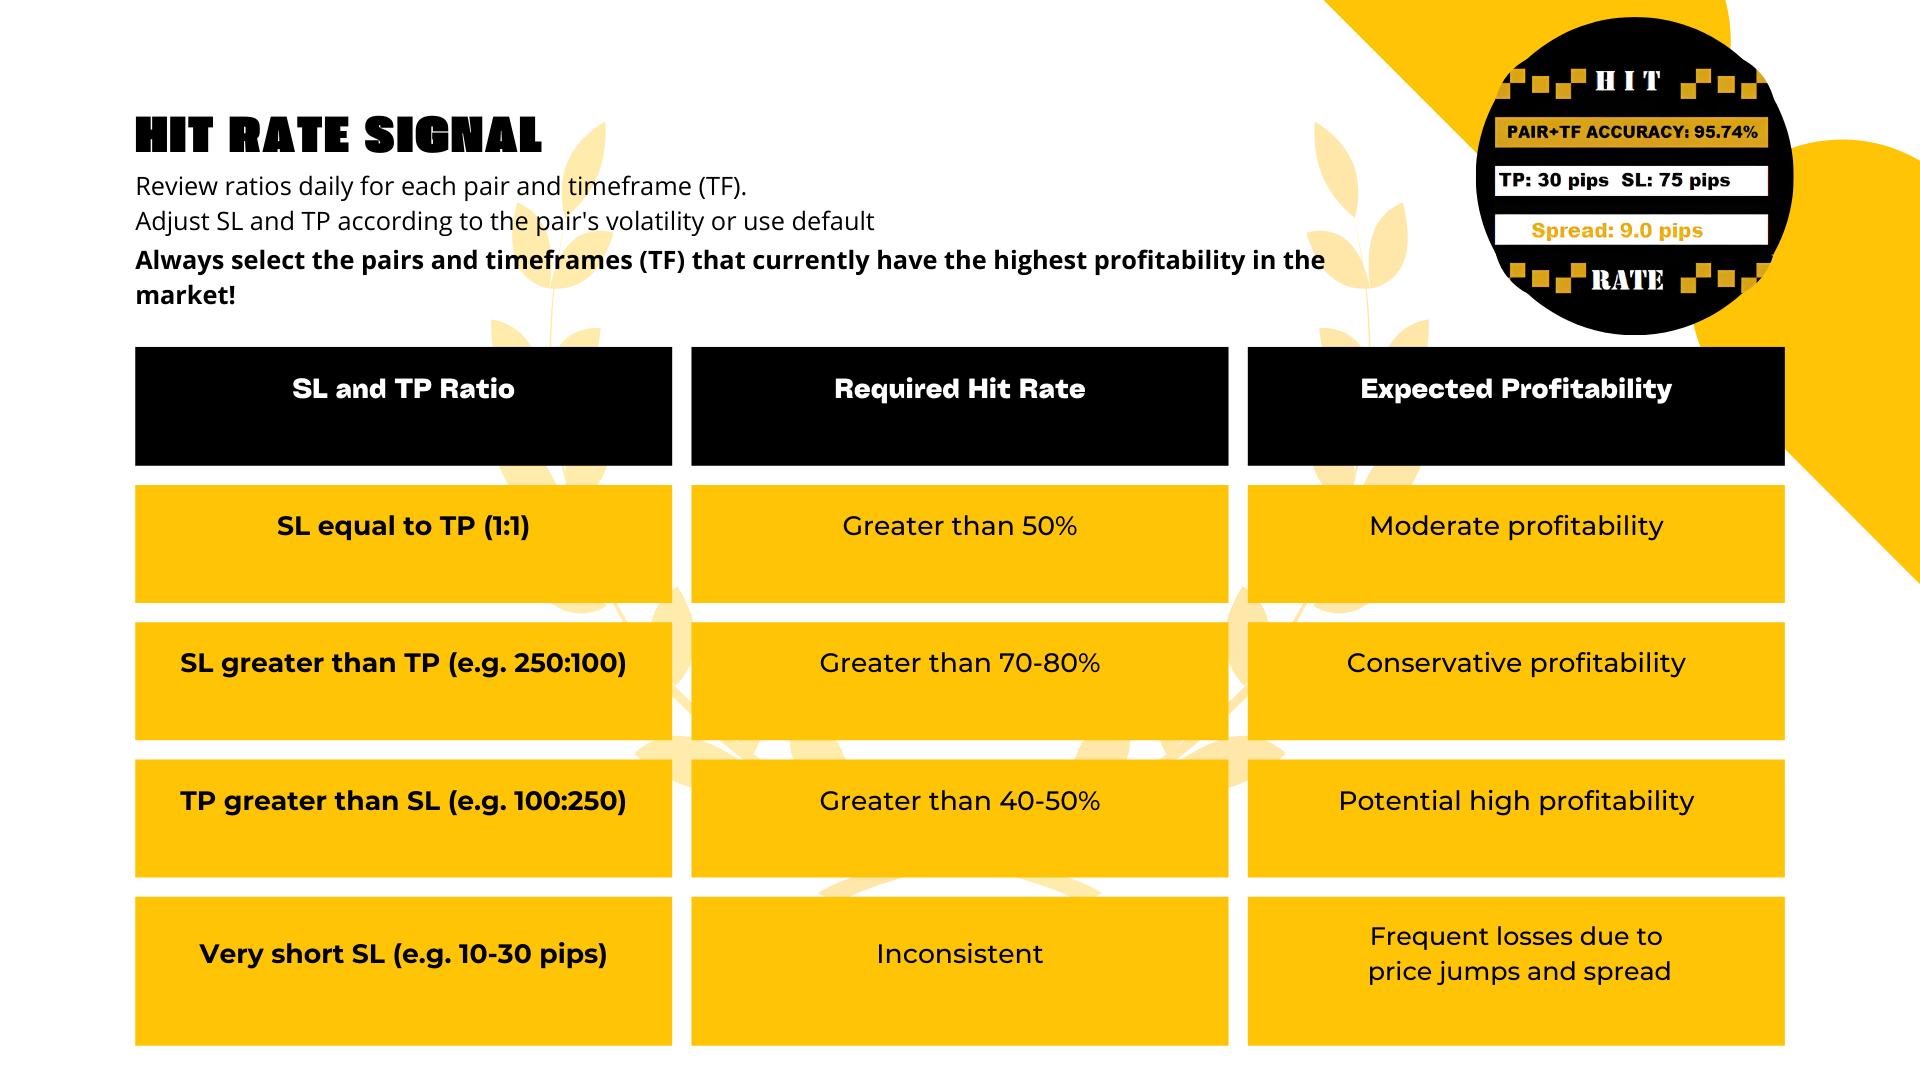
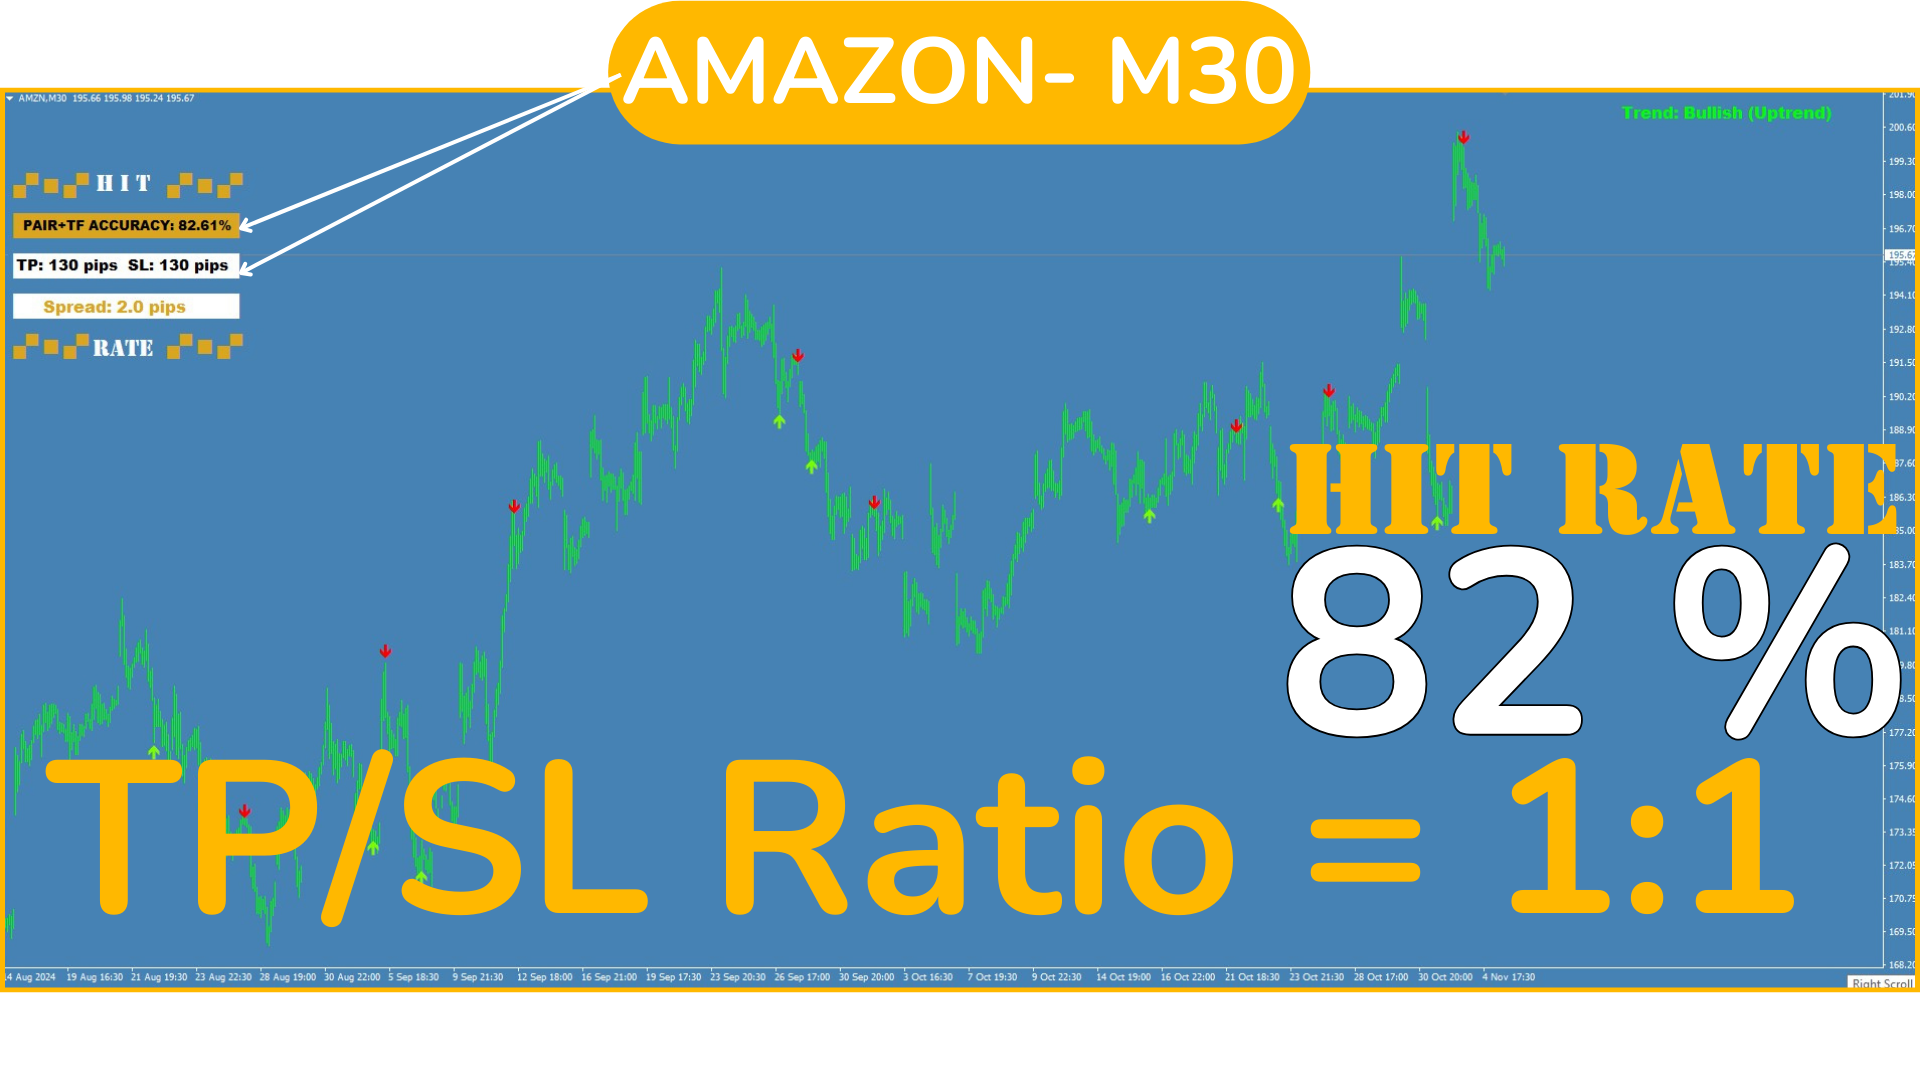
  • SL/TP比率 1:1: TPサイズはSLと同じです(例:SL:100ピップ、TP:100ピップ)。この場合、戦略が利益を生むにはヒット率が50%を超える必要があります。なぜなら、勝ち負けの金額がほぼ同じだからです。
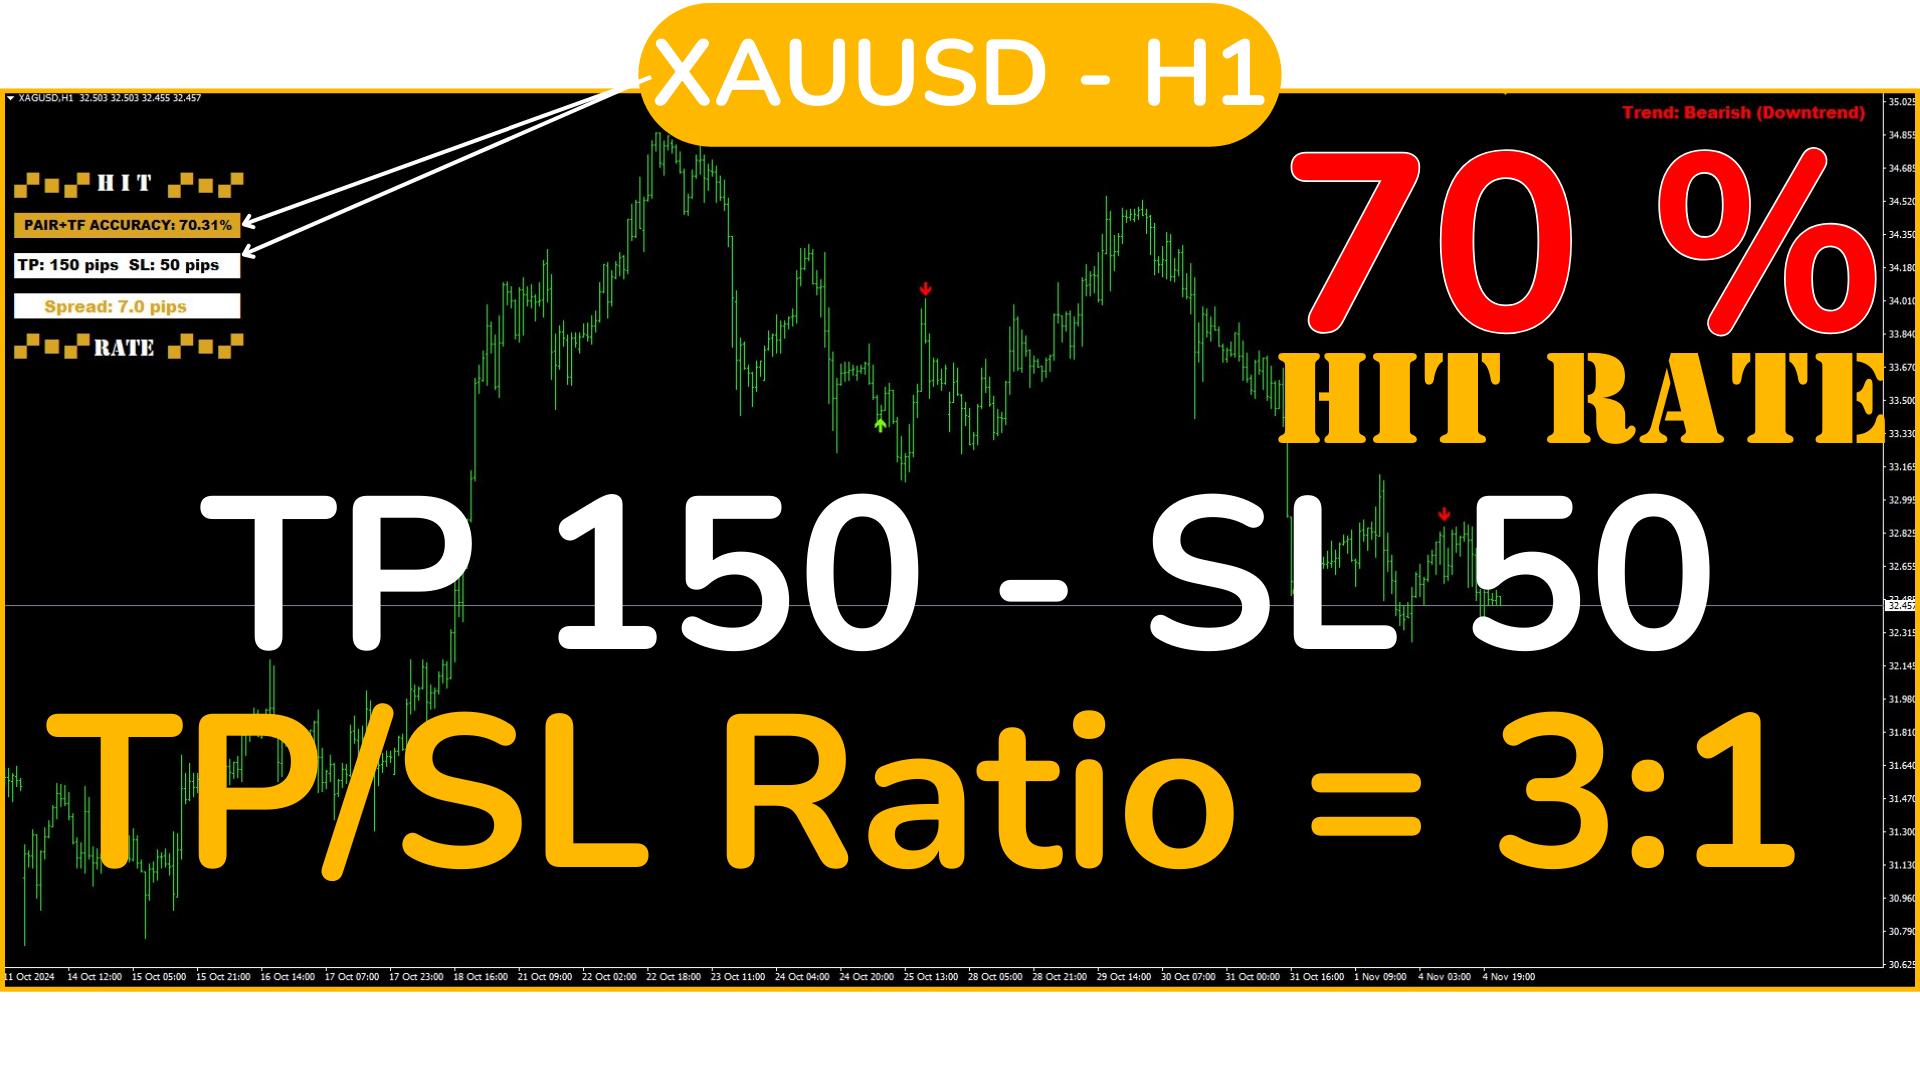
  • SLがTPより大きい場合:例:SL:250ピップ、TP:100ピップ)、SLが発動されたときの損失を補うために、より高いヒット率が必要です。この場合、ヒット率が70%〜80%を超えることが理想的です。
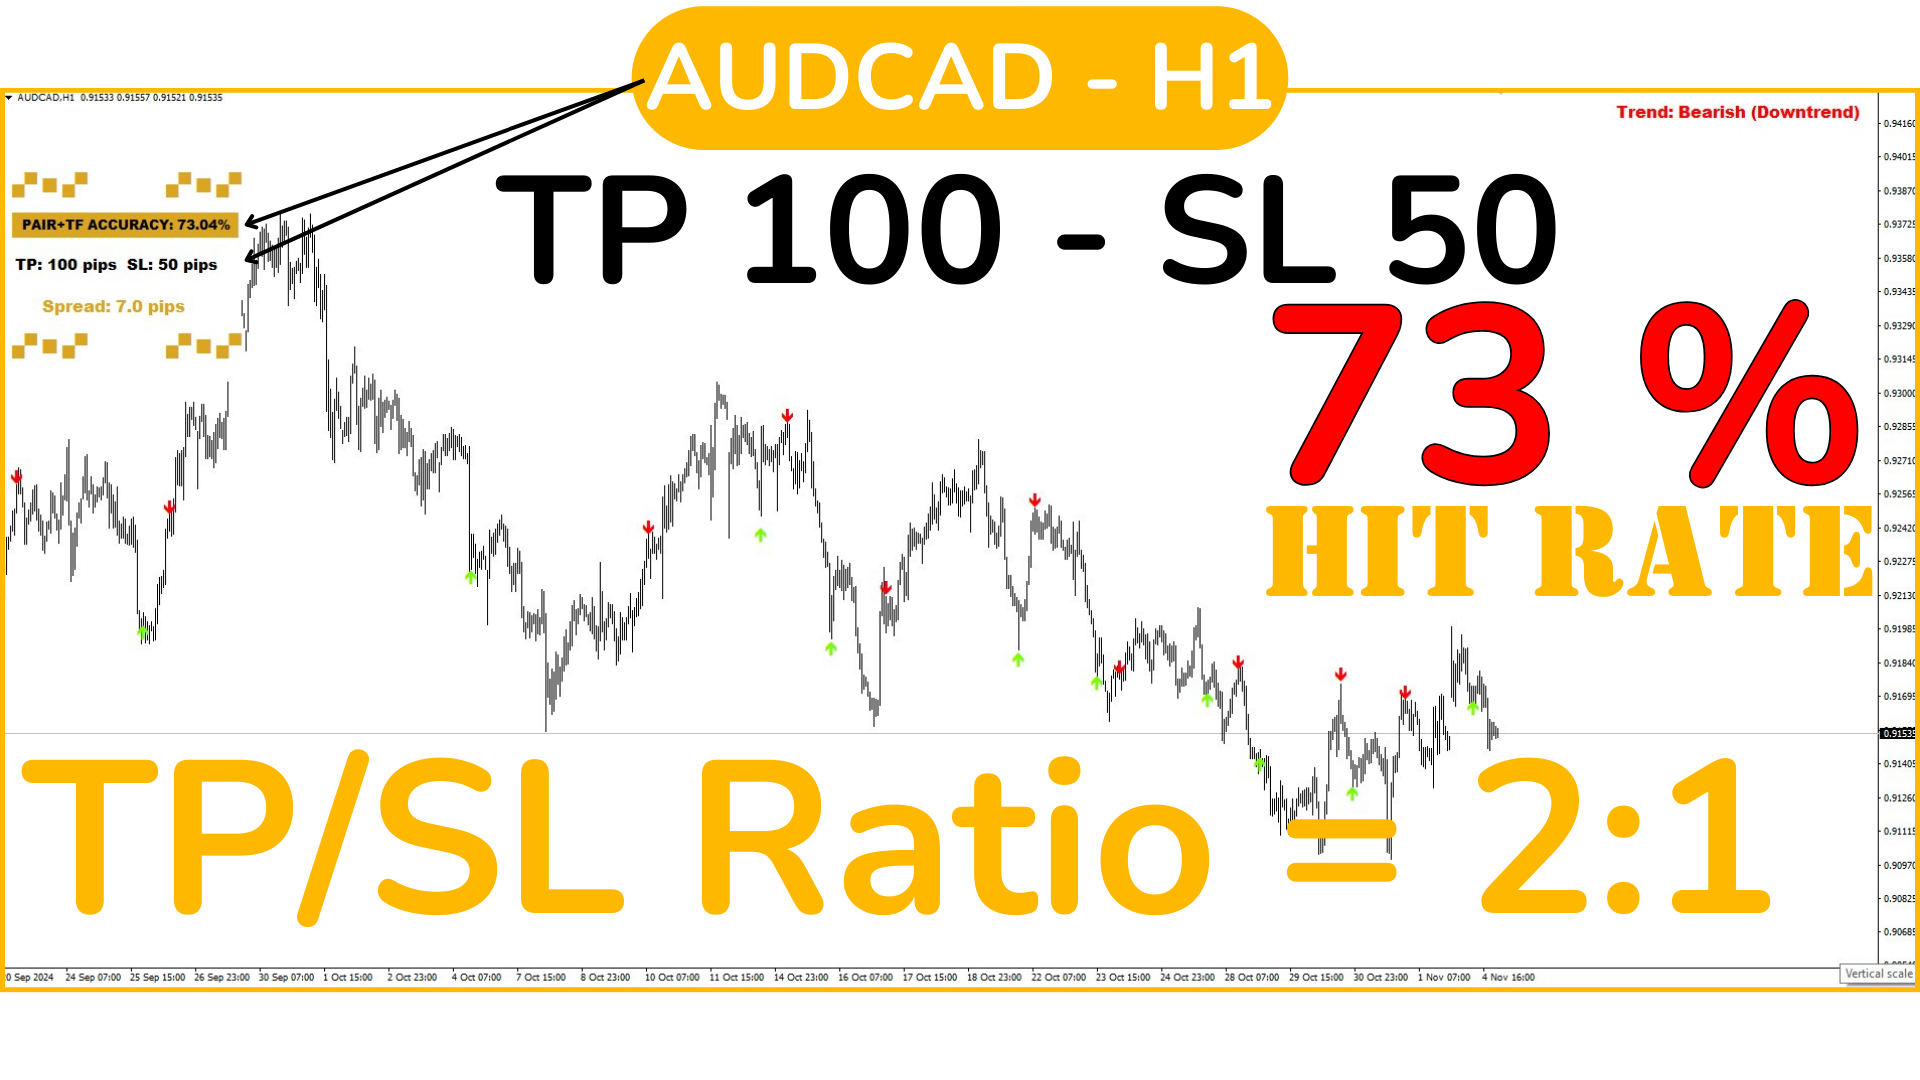
  • TPがSLより大きい場合: (例:TP:250ピップ、SL:100ピップ)、各利益が複数の損失を補うため、ヒット率が低くても戦略は収益性を維持できます。この場合、利益を生み出すには40-50%のヒット率で十分です。

どの場合でも!!SLが非常に「短い」場合、例えば10-30ピップ、スプレッドの影響で頻繁に発動し、本来なら勝つはずの取引が損失になる可能性があります。常に慎重に、価格に十分な動きの余地(広いSL)を持たせましょう。

2. ヒット率:

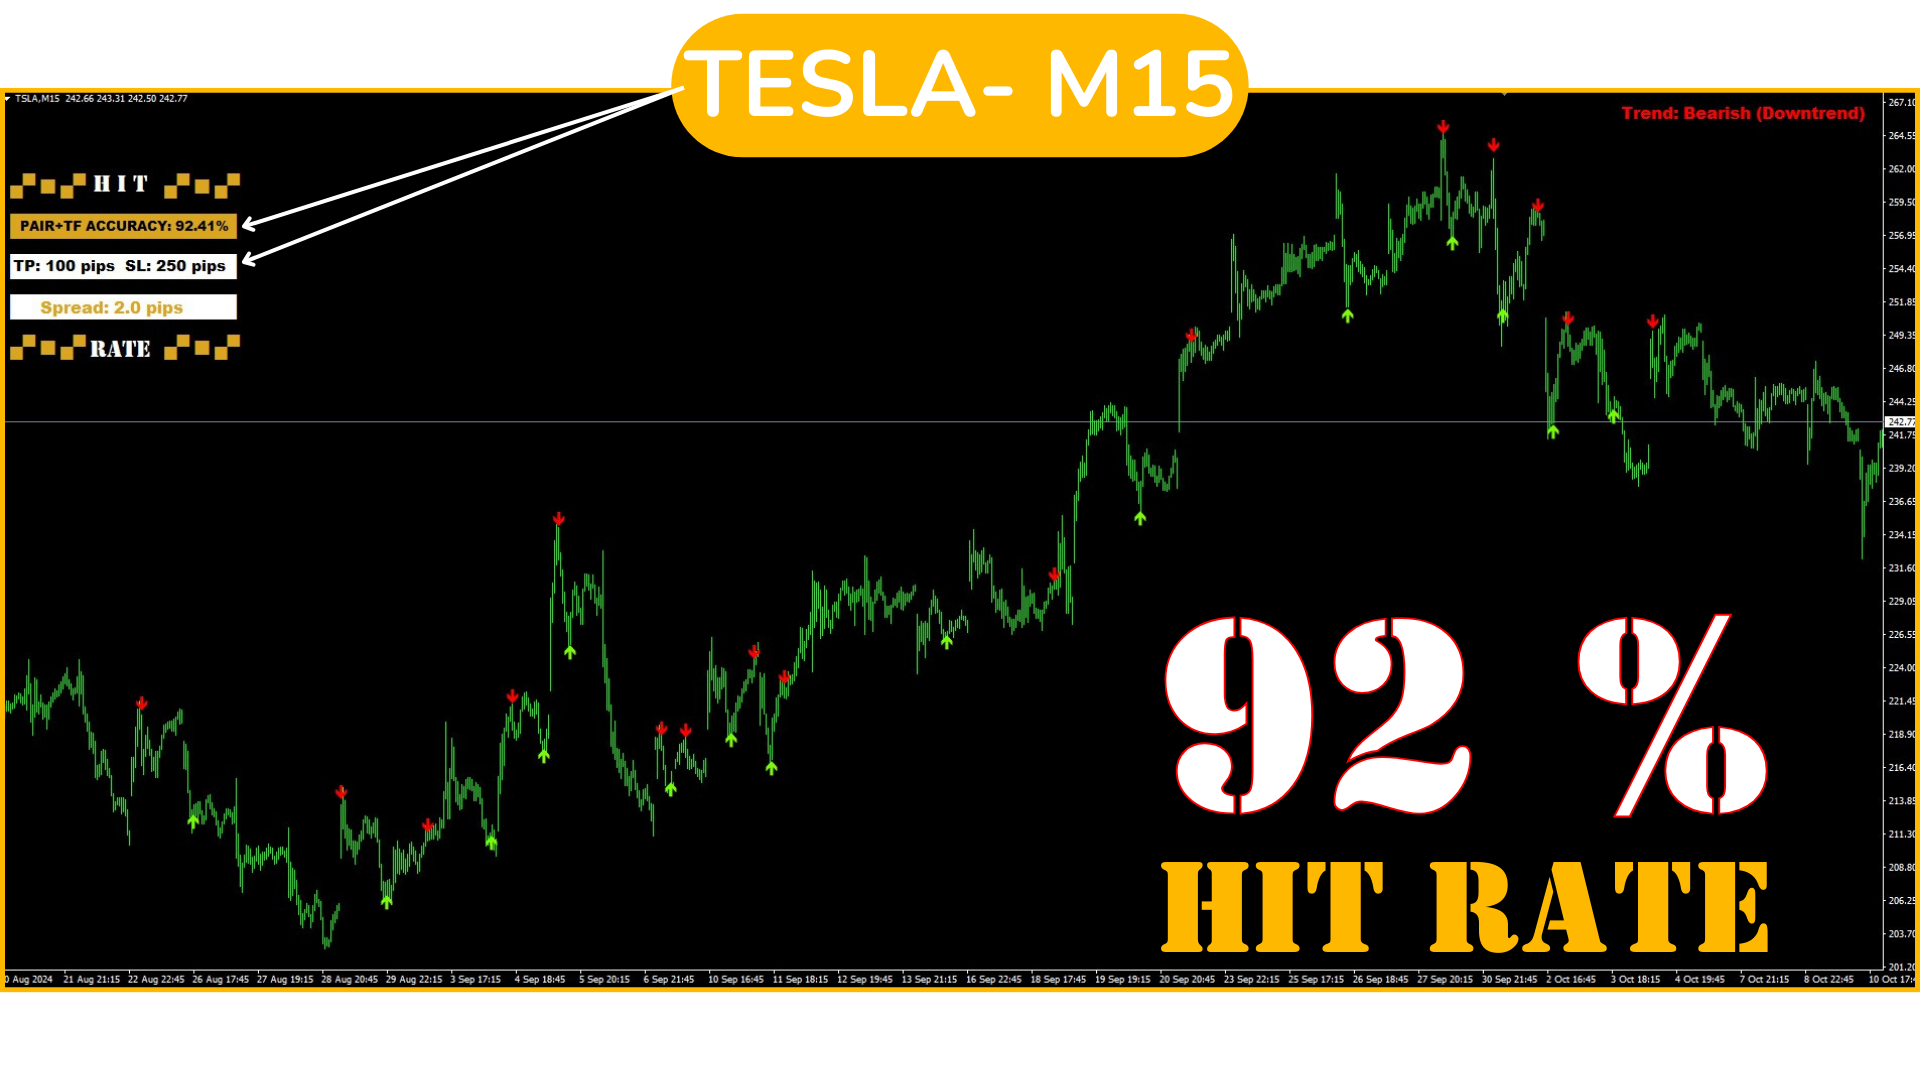
  • ヒット率は、システムが予測を的中させた頻度を示します。ヒット率の高いシステム(例:90%)は信頼性が高く、SL/TP比率を広く(SLがTPより大きい)設定することが可能です。
  • ただし、ヒット率が低くてもTPがSLを大幅に上回る場合、必ずしも損失を意味するわけではありません。TPが大きければ、たとえ的中が少なくても利益で損失をカバーできます。

    これは、シグナルのヒット率を事前に知ることが、優れた資本管理(SL+TP)とともに最適な結果を達成するために重要である理由です。


通貨ペアとTFに応じた最適化:

各通貨ペアとタイムフレームは、同じSL/TP比率に対して異なる反応を示す可能性があるため、通貨ペアとTFのパフォーマンスに応じてSLとTPを調整することが重要です。たとえば、ボラティリティが高い通貨ペアや高いTFでは、より広いTPを使用することが望ましい場合があります。

各通貨ペアとTFで異なるSLとTPの設定を試し、各ケースのヒット率を観察してください。これにより、利益を最大化し、損失を最小限に抑える最適なバランスを見つけることができます。


収益性評価の例:

SLが250ピップ、TPが100ピップの戦略を想定してください。この設定で利益を上げるためには、ヒット率は 理想的には70%〜80%を超える必要があります。これは、通貨ペア固有のボラティリティと行動に依存します。SLが発動された場合の損失を補填するためです。

ただし、比率を反転してSLを100ピップ、TPを250ピップにした場合、ヒット率が40%〜50%であっても十分です。なぜなら、各勝利の取引が複数の損失をカバーできるからです。


要約:

  • SLがTPより大きい場合:ヒット率が高い必要があります(理想的には70%以上)。
  • TPがSLより大きい場合:ヒット率が低くても機能します(約40%〜50%)。
  • 毎日の最適化: 各通貨ペアとTFで選択された比率が維持されているかを毎日確認して、最適なパフォーマンスを実現し、パフォーマンスが低下した場合は「ステップバイステップ」プロセスを繰り返し、最適な設定を再評価します。

この戦略は、FX通貨ペア、金、銀、株式、指数、さらには暗号通貨(ブローカーが許可する場合)や任意のTFで使用できるため、1-スプレッドが高すぎる 2-私たちが探している比率に合わない通貨ペアに固執する必要はありません。最高の選択をしてください!


最後に、単一の理想的な設定は存在しないことを覚えておいてください。設定を変更することで、通貨ペアやTFに応じて異なる設定が良好な結果をもたらすことがわかります。そのため、いつ取引を行うかを通知し、それに対応するSLとTP(事前にテスト済み)を提供する明確なシグナルを持つことで、ヒット率の比率分析を受け取ることができ、ヒット率トップボトムシグナルが完全な戦略になるのです。 通知に基づいて取引を行うことで、情報に基づいた決定を下す安心感が得られます。

0ストレスでの取引、シンプルでクリア。推測や不安なし!


おすすめのプロダクト
Arbitrage Indicators is a professional and easy-to-use Forex trading indicator that uses the best trading principles of the latest AI arbitrage models. This indicator provides accurate buy and sell signals. Applies to currency pairs only. It has six different metrics options, MACD, KDJ, RSI, CCI, RVI, DEMARK. It can be freely switched by users, and intuitively shows the direction and reversal signal of the currency pair. When the two lines cross colors, the currency has a high probability of rev
Alpha Trend signは私たちの取引システムを検証し、取引信号を明確に提示し、信号がドリフトすることはありません。 主な機能: •市場が活況を示している地域に応じて、指標に基づいて現在の相場がトレンド相場に属しているか、それとも揺れ相場に属しているかを直感的に判断することができる。 そして、指標の指示矢印に基づいて市場に切り込み、緑の矢印は購入を提示し、赤の矢印は販売を提示する。 •小周期変動による頻繁な取引信号の発生を回避するために、5分以上の時間周期で取引を行うことを推奨します。 •最適な取引タイミングを逃さないために、シグナルプロンプトをオンにすることもできます。 •本指標はトレンド相場をよく予測するだけでなく、幅広振動相場でも利益を得ることができる。 •本指標は大道至簡の原則に基づいており、異なる段階のトレーダーが使用するのに適している。 注意事項: •Alpha Trend signには明確な入退場信号があり、損失を与えないように逆位相操作を提案しない。 •Alpha Trend signは特に成熟した指標であり、デルのチー
This is the complete REX package. It consists of the lite, pro and ULTRA version.  Perfect for beginners and intermediates. REX complete is 100% non repaint. The strategy is based on a mix of different strategies, statistics, including pivot points, oscillators and patterns.  As the trading idea consists of a variety of some classic indicators like Momentum, Williams Percent Range, CCI, Force Index, WPR, DeMarker, CCI, RSI and Stochastic, it is clear that the fundamental indicators have being u
Chart Patterns Detect 15 patterns (Ascending Triangle, Descending Triangle, Rising Wedge, Falling Wedge, Bullish Flag, Bearish Flag, Bullish Rectangle, Bearish Rectangle Symmetrical triangle, Head and Shoulders, Inverted Head and Shoulders, Triple top, Triple Bottom, Double Top, Double Bottom) Use historical data to calculate the probability of each pattern to succeed (possibility to filter notification according to the chance of success) gives graphic indication about the invalidation level and
Supertrend Professional は、Supertrend インジケーターに基づいた MetaTrader 4 用エキスパートアドバイザーです。ドイツ指数(GER30/GER40/DAX)のトレンドフォロー取引用に設計されています。 FTMO コンプライアンス EA はプロップファーム(FTMO、The Funded Trader など)のルールに従ってドローダウンを計算します: - デイリードローダウンは FTMO の要件どおり、MAX(残高、有効証拠金)を計算基準として使用 - 基準残高は毎日深夜に自動更新 - 制限に達した時点ですべてのポジションを自動決済 - ファンデッドアカウントでの運用や、プロフェッショナルなリスク管理ルールの遵守に最適 機能 EA には以下の機能が含まれています: - 内蔵 Supertrend インジケーター(外部依存なし) - 設定可能なドローダウン制限(日次および合計)、FTMO 準拠の計算 - 自動ブレイクイーブン機能 - プログレッシブトレーリングストップ - オプションのマーチンゲールシステム(倍率と最大ステップ数を
Szia! Egy indikátorral. Több idő gyertyájának kirajzoltatása egy charton. Különböző színek rendelhetők a long és short gyertyákhoz. Vonal vastagsága állítható. A gyertya kitöltése engedélyezhető. Hello! With an indicator. Drawing multiple time candles on a chart. Different colors can be ordered for long and short candles. Line thickness can be adjusted. Filling the candle can be allowed. Videó: https://www.youtube.com/watch?v=-9bequnAw-g&amp ;ab_channel=GyulaKlein
Preface: First of all, let me introduce myself. I am a programmer and have been working for over 20 years. 2023 has passed, and our studio has achieved a record of 500 times with 7 manual transmissions. Below, we will show you how to do it through a series of operations. The first step is to model. Modeling is to find a fixed trading pattern. I think everyone has heard of a 2/8 probability, and through this probability, we can further refine it, which means that 1 to 4 is the optimal state. We h
The main idea of this indicator is rates analysis and prediction by Fourier transform. Indicator decomposes exchange rates into main harmonics and calculates their product in future. You may use the indicator as a standalone product, but for better prediction accuracy there is another related indicator - FreqoMaster - which uses FreqoMeterForecast as a backend engine and combines several instances of FreqoMeterForecast for different frequency bands. Parameters: iPeriod - number of bars in the ma
Visual Vortex Indicator MT4
AL MOOSAWI ABDULLAH JAFFER BAQER
Unleash the Power of Market Dynamics with the Vortex Indicator! The Visual Vortex Indicator is your advanced tool for decoding market trends, reversals, and momentum shifts. Priced at $65, this indicator provides a comprehensive view of market behavior, but it’s designed for you to fine-tune and optimize it according to your unique trading strategy. What Makes It Unique? The Vortex Indicator is based on a strategy that identifies directional movements and trend strength by analyzing key price d
This indicator is another variant of the famous powerful indicator Fibonacci-SS https://www.mql5.com/en/market/product/10136 but has different behaviour in placing Pending Order and TP Line. Automatically places Fibonacci retracement lines from the last highest and lowest visible bars on the chart with: An auto Pending Order (Buy/Sell). Taking Profit 1, Taking Profit 2 is pivot point and Taking Profit 3 for extended reward opportunity. The best risk and reward ratio. Simple and powerful indicat
This advisor enters the market at the opening of   London Market . It has a automatic function that give buy (arrow up green) and sell (arrow down red) signal when the indicator met high probabilities requirements.Once the signal is generated it is the trader discretions to start the order button and do trade manually. Stop loss are base on ATR. Recommended Take profit is 20pips.  The trading system is suitable for both experienced traders and beginners.  Timeframe is  M5 . Minimum account bal
Stratos Pali
Michela Russo
4.43 (7)
Stratos Pali Indicator   is a revolutionary tool designed to enhance your trading strategy by accurately identifying market trends. This sophisticated indicator uses a unique algorithm to generate a complete histogram, which records when the trend is Long or Short. When a trend reversal occurs, an arrow appears, indicating the new direction of the trend. Important Information Revealed Leave a review and contact me via mql5 message to receive My Top 5 set files for Stratos Pali at no cost! Dow
The indicator provides a superior alternative to price action analysis. It enables the identification of normalized patterns, which are then transformed into a graphical representation to forecast future steps within a time series. In the top-left corner, you'll find information regarding the expected prediction accuracy, determined through a complex MSQE calculation. You have the flexibility to adjust the time window, making it easy to validate the indicator's performance. Additionally, you can
True SnD
Indra Lukmana
5 (1)
This Supply & Demand indicator uses a unique price action detection to calculate and measures the supply & demand area. The indicator will ensure the area are fresh and have a significant low risk zone. Our Supply Demand indicator delivers functionality previously unavailable on any trading platform. Trading idea You may set pending orders along the supply & demand area. You may enter a trade directly upon price hit the specific area (after a rejection confirmed). Input parameters Signal - Set
Simple to read and powerful, no fancy lines and drawings to clutter your chart or distract you. The trend probability oscillator estimates how likely a trend will continue in a certain period. The cummulator period controls how many bars in the past to use and is a proxy for the timescale the trend probability should hold. The use of a Max Line improves this further by indicating when a trend is likely to reverse. In most cases a trend must lose momentum before reversing. Hence, a trend probabil
需給ゾーンの主要価格指標 背景 システムはKライン上の需要と供給の領域を自動的に検索し、リアルタイムの主要価格ラインを描画します。トレーダーは価格取引ラインに基づいて取引を行うことができます。 主な特徴 システムはKライン内の供給エリアと需要エリアを自動的に検索します。このシステムはリアルタイムの主要価格ラインも描画し、トレーダーは価格取引ラインに基づいて取引を行うことができます。したがって、需要と供給ゾーン戦略を使用するトレーダーは、需要と供給エリアの兆候を探すのに時間を費やす必要がなくなります。代わりに、需要と供給の領域と主要な価格に対する価格の反応に焦点を当て、自分に合った取引戦略を立てることができます。 ただし、需給ゾーン戦略自体はボラティリティが高い時期に効果を発揮する戦略であるため、市場が強いトレンドを示している場合には注意して使用するか、インジケーターが提供する示唆をトレンドの方向に活用する必要があります。 範囲 ShowZones: 供給ゾーンと需要ゾーンを表示するかどうか DrawLines: 主要価格を表示するかどうか SupplyZoneLineColor:
Watch the Clock shows a clock at a desired position. The clock is useful if you want to check when a candle closes. You can also set an alert to be prepared before the news. ️ Watch the Clock works also in the strategy tester. ️ Watch the Clock requires a minimum of CPU power. ️ Watch the Clock can improve your manual style of trading. Inputs Alert -> At which time should the alert occur? Time Shift in Minutes -> Should the time be incremented by x minutes? Size -> The font size of the tim
The indicator detects divergence signals - the divergences between the price peaks and the MACD oscillator values. The signals are displayed as arrows in the additional window and are maintained by the messages in a pop-up window, e-mails and push-notifications. The conditions which formed the signal are displayed by lines on the chart and in the indicator window. Indicator Parameters MacdFast - fast MACD line period MacdSlow - slow MACD line period MacdSignal - MACD signal line period MacdPric
Dynamic Forex28 Navigator - 次世代の Forex 取引ツール。 現在 49% オフ。 Dynamic Forex28 Navigator は、長年人気のインジケーターを進化させたもので、3 つの機能を 1 つにまとめています。 Advanced Currency Strength28 インジケーター (レビュー 695 件)  + Advanced Currency IMPULSE with ALERT (レビュー 520 件) + CS28 コンボ シグナル (ボーナス)。 インジケーターの詳細 https://www.mql5.com/en/blogs/post/758844 次世代の Strength インジケーターが提供するもの  オリジナルで気に入っていたすべての機能が、新機能と精度の向上によって強化されました。 主な機能: 独自の通貨強度計算式。 すべての時間枠でスムーズかつ正確な強度ライン。 トレンドの特定と正確なエントリーに最適です。 ダイナミックマーケットフィボナッチレベル (マーケットフィボナッチ)。 このインジケーターに固有
Crypto_Forex MT4 用インジケーター「モーニング スター パターン」 - インジケーター「モーニング スター パターン」は、プライス アクション トレーディングに非常に強力なインジケーターです。再描画なし、遅延なし。 - インジケーターは、チャート上で強気のモーニング スター パターンを検出します。チャート上の青い矢印信号 (画像を参照)。 - PC、モバイル、および電子メール アラート付き。 - また、その兄弟である弱気の「イブニング スター パターン」インジケーターも利用できます (以下のリンクに従ってください)。 - インジケーター「モーニング スター パターン」は、サポート/レジスタンス レベルと組み合わせるのに最適です。 高品質のトレーディングロボットとインジケーターをご覧になるにはここをクリックしてください! これは、この MQL5 Web サイトでのみ提供されるオリジナル製品です。
これは、従来のMACDよりも正確で使いやすいユニークなMACD指標です。 それはあらゆるチャートサイクルに適しており、あらゆる市場の種類に適しています。 赤い列は(Buy)バンドの信号、青い列は(Sell)バンドの信号です。 黄色と緑色の線は傾向線で、2本の線は交差しません。 購入する:青い列で、真ん中の0軸を通る緑色の線を見てください。 売り:赤い列で、真ん中の0軸の下の黄色い線を見てください。 MACDの形態信号からの偏差は99%正確です。 購入フォームからの逸脱:バンドの価格がバンドより低く、インディケータのインデックスがますます高くなっていますこの場合、すぐに買い注文をすることができます。 売りからの逸脱:バンドの価格がバンドより高く、インディケータのインデックスが小さくなってきているこの場合、売りシングルはすぐに実行できます。 注:指標の五芒星は、価格の変動により変化します。
The indicator identifies two most important patterns of technical analysis - Pin Bar and Engulfing. MT5-version  https://www.mql5.com/en/market/product/53701 Settings: Mincandle size for PinBar - The minimum size of the Pin-Bar candlestick; Percentage of candle body on size - The percentage of the candle body in relation to its length; PinBar Alert - Alert when a Pin-Bar is detected; PinBar Mail - Sends an email when a Pin Bar is found; PinBar Notification - Sends a push notification when a Pin
ECM Elite Channel is a volatility-based indicator, developed with a specific time algorithm, which consists of finding possible corrections in the market. This indicator shows two outer lines, an inner line (retracement line) and an arrow sign, where the channel theory is to help identify overbought and oversold conditions in the market. The market price will generally fall between the boundaries of the channel. If prices touch or move outside the channel, it's a trading opportunity. The ind
PABT Pattern Indicator - it's classical system one of the signal patterns. Indicator logic - the Hi & Lo of the bar is fully within the range of the preceding bar, look to trade them as pullback in trend. In the way if indicator found PABT pattern it's drawing two lines and arrow what showing trend way.  - First line - it's entry point and drawing at: 1. On the high of signal bar or on middle of the signal bar (depending from indicator mode) for buy; 2. On the low of signal bar or on middle of t
RQL Trend Board – Description RQL Trend Board   is a simple but powerful multi-timeframe trend dashboard. It shows the current market bias across several timeframes at the same time, using an internal trend-classification method. Each timeframe is displayed as a colored box:   Green   – bullish bias → look for   long   setups   Yellow   – ranging / unclear →   no trade zone   Red   – bearish bias → look for   short   setups The indicator gives a clear   overall picture   of where the
FREE
Crypto_Forex インジケーター   PINBAR パターン MT4用。リペイントなし、遅延なし。 - インジケーター「PINBARパターン」は、プライスアクション取引に非常に強力なインジケーターです。 - インジケーターはチャート上のピンバーを検出します。 - 強気のピンバー - チャート上に青い矢印シグナルを表示します(画像参照)。 - 弱気のピンバー - チャート上に赤い矢印シグナルを表示します(画像参照)。 - PC、モバイル、メールアラート機能付き。 - インジケーター「PINBARパターン」は、サポート/レジスタンスレベルと組み合わせるのに最適です。 高品質のトレーディングロボットとインジケーターをご覧になるにはここをクリックしてください! これは、このMQL5ウェブサイトでのみ提供されるオリジナル製品です。
VR Cub
Vladimir Pastushak
VR Cub は、質の高いエントリーポイントを獲得するためのインジケーターです。このインジケーターは、数学的計算を容易にし、ポジションへのエントリーポイントの検索を簡素化するために開発されました。このインジケーターが作成されたトレーディング戦略は、長年にわたってその有効性が証明されてきました。取引戦略のシンプルさはその大きな利点であり、初心者のトレーダーでもうまく取引することができます。 VR Cub はポジション開始ポイントとテイクプロフィットとストップロスのターゲットレベルを計算し、効率と使いやすさを大幅に向上させます。取引の簡単なルールを理解するには、以下の戦略を使用した取引のスクリーンショットを見てください。 設定、設定ファイル、デモ版、説明書、問題解決方法は、以下から入手できます。 [ブログ] レビューを読んだり書いたりすることができます。 [リンク] のバージョン [MetaTrader 5] エントリーポイントの計算ルール ポジションをオープンする エントリーポイントを計算するには、VR Cub ツールを最後の高値から最後の安値までストレッチする必要があります。 最初
Spirit mt4
Alena Snigireva
5 (1)
Spirit mt4 is an indicator that works without flashing, the signals are triggered after the arrow at the beginning of the next candle Includes several indicators for overbought and oversold levels. Works with any currency pair: EUR/USD, AUD/USD and others. After the purchase, send me a private message and I will send you the settings that I use for this indicator. Suitable for trading cryptocurrencies. I like to trade cryptocurrency more, so I use it more there. It can also be used for bi
Distinctive is a forex trending arrow indicator for identifying potential entry points. I like it, first of all, because it has a simple mechanism of work, adaptation to all time periods and trading tactics. Created on the basis of a regression channel with filters. Plotting the Lawrence indicator signals on a price function chart using a mathematical approach. How it works - when the price breaks out in the overbought / oversold zone (channel levels), a buy or sell signal is generated. Everyt
MetaTrader 5 version available here : https://www.mql5.com/en/market/product/24882 FFx Basket Scanner is a global tool scanning all pairs and all timeframes over up to five indicators among the 16 available. You will clearly see which currencies to avoid trading and which ones to focus on. Once a currency goes into an extreme zone (e.g. 20/80%), you can trade the whole basket with great confidence. Another way to use it is to look at two currencies (weak vs strong) to find the best single pairs
このプロダクトを購入した人は以下も購入しています
Miraculous Indicator – ガン・スクエア・オブ・ナインに基づく100%非リペイントのFXおよびバイナリーツール この動画では、FXおよびバイナリーオプションのトレーダー向けに特別に開発された、非常に正確で強力な取引ツールである Miraculous Indicator を紹介しています。このインジケーターがユニークなのは、伝説的な ガン・スクエア・オブ・ナイン と ガンの振動の法則 に基づいている点で、現代の取引で利用できる最も正確な予測ツールの一つとなっています。 Miraculous Indicatorは 完全に非リペイント であり、ローソク足が確定した後にシグナルが変化したり消えたりすることはありません。つまり、見たものがそのまま利用できます。これにより、トレーダーは自信を持ってエントリーおよびエグジットを行うための信頼性と一貫性のある根拠を得ることができます。 主な特徴: ガン・スクエア・オブ・ナインとガン理論に基づいて構築 100%非リペイントのシグナルシステム すべての時間枠(M1、M5、H1、H4、日足、週足)で機能 FXおよびバイナリーオプション取引
Precautions for subscribing to indicator This indicator only supports the computer version of MT4 Does not support MT5, mobile phones, tablets The indicator only shows the day's entry arrow The previous history arrow will not be displayed (Live broadcast is for demonstration) The indicator is a trading aid Is not a EA automatic trading No copy trading function The indicator only indicates the entry position No exit (target profit)  The entry stop loss point is set at 30-50 PIPS Or the front hi
Pulse Scalping Line - an indicator for identifying potential pivot points. Based on this indicator, you can build an effective Martingale system. According to our statistics, the indicator gives a maximum of 4 erroneous pivot points in a series. On average, these are 2 pivot points. That is, the indicator shows a reversal, it is erroneous. This means that the second signal of the indicator will be highly accurate. Based on this information, you can build a trading system based on the Martingale
El indicador "MR BEAST ALERTAS DE LIQUIDEZ" es una herramienta avanzada diseñada para proporcionar señales y alertas sobre la liquidez del mercado basándose en una serie de indicadores técnicos y análisis de tendencias. Ideal para traders que buscan oportunidades de trading en función de la dinámica de precios y los niveles de volatilidad, este indicador ofrece una visualización clara y detallada en la ventana del gráfico de MetaTrader. Características Principales: Canal ATR Adaptativo: Calcula
Rtc ML Ai | Predictor CORE MACHINE LEARNING ENGINE Adaptive ML Market Predictor – Multi-Bar Trend & Candle Forecast What This Indicator Does This indicator is a  real-time market prediction engine  designed to analyze price behavior and estimate  future market tendencies . Unlike conventional indicators, this system  does not rely on static parameters or historical curve-fitting , but adapts its internal state dynamically during live market operation. Instead of using static rules, the indic
PairMaster Buy Sell Arrow Indicator for MT4 Trade Reversals Like a Pro — Catch Every Swing Point with Precision The PairMaster Buy Sell Arrow Indicator is a powerful MetaTrader 4 tool built to identify high-probability swing trading opportunities . Designed for traders who value accuracy, clarity, and simplicity, PairMaster detects key market turning points and plots intuitive buy and sell arrows directly on your chart. Key Features Accurate Swing Point Detection – Automatically identifies ma
BinaryIndicator is a highly accurate indicator for trading binary options. It shows excellent results in scalping. This indicator is based in multifactor analysis of trend indicators, as well as confirmation oscillators, which in the end gives an increased accuracy of signals. Advantages of the indicator Increased accuracy of signals. Excellent results when trading binary options with a short expiration time from M30 to M1 . It works on any timeframes. Works with any trade symbols. Parameters
FFx Engulfing Setup Alerter gives trade suggestions with Entry, Target 1, Target 2 and StopLoss. Below are the different options available: Entry suggestion - pips to be added over the break for the entry 3 different options to calculate the SL - by pips, by ATR multiplier or at the pattern High/Low 3 different options to calculate the 2 TPs - by pips, by ATR multiplier or at Risk/Reward Offset the dashboard - any place on the chart Remove the suggestion once the price reached the SL line Lines
FFx InsideBar Setup Alerter gives trade suggestions with Entry, Target 1, Target 2 and StopLoss. Below are the different options available: Entry suggestion - pips to be added over the break for the entry Minimum candle size - to avoid too close buy/sell entry suggestions 3 different options to calculate the SL - by pips, by ATR multiplier or at the pattern High/Low 3 different options to calculate the 2 TPs - by pips, by ATR multiplier or at Risk/Reward Offset the dashboard - any place on the c
FFx OutsideBar Setup Alerter gives trade suggestions with Entry, Target 1, Target 2 and StopLoss. Below are the different options available: Entry suggestion - pips to be added over the break for the entry. 3 different options to calculate the SL - by pips, by ATR multiplier or at the pattern High/Low. 3 different options to calculate the 2 TPs - by pips, by ATR multiplier or at Risk/Reward. Offset the dashboard - any place on the chart. Remove the suggestion once the price reached the SL line.
FFx PinBar Setup Alerter gives trade suggestions with Entry, Target 1, Target 2 and StopLoss. Below are the different options available: Entry suggestion - pips to be added over the break for the entry Minimum candle size - to avoid too small candles 3 different options to calculate the SL - by pips, by ATR multiplier or at the pattern High/Low 3 different options to calculate the 2 TPs - by pips, by ATR multiplier or at Risk/Reward Offset the dashboard - any place on the chart Remove the sugges
Automatic, live & interactive picture of all trendlines. Assign push, email and sound alerts to the lines of your choice and be informed about price rollback, breakout, rollback after breakout, number of rollbacks, line expiration by double breakout. Correct, drag or delete the lines and interactively tune the line system. https://youtu.be/EJUo9pYiHFA . Chart examples https: //www.mql5.com/en/users/efficientforex Price Interaction Events All events are effective immediately and only after one
The purpose of this new version of the MT4 standard indicator provided in your platform is to display in a sub-window multiple timeframes of the same indicator with its divergences. See the example shown in the picture below. But the display isn't like a simple MTF indicator. This is the real display of the indicator on its timeframe. Here's the options available in the FFx divergences indicator: Select the timeframes to be displayed (M1 to Monthly) Define the width (number of bars) for each tim
The purpose of this new version of the MT4 standard indicator provided in your platform is to display in a sub-window multiple timeframes of the same indicator with its divergences. See the example shown in the picture below. But the display isn't like a simple MTF indicator. This is the real display of the indicator on its timeframe. Here's the options available in the FFx divergences indicator: Select the timeframes to be displayed (M1 to Monthly). Define the width (number of bars) for each ti
The FFx Dashboard MTF alerter will show you on a single chart all the timeframes (M1 to Monthly) with their own status for the indicator. 2 Alert Options: Single timeframe: each selected timeframe alert separately when a signal occurs Multi timeframes: all selected timeframes must agree for an alert to be triggered Both options have an input to select the timeframes to be used for the alert(s). How to Understand the Status: Green/Red square: histogram above/below 0 line Green square + Red bord
The FFx Dashboard MTF alerter will show you on a single chart all the timeframes (M1 to Monthly) with their own status for the indicator. 2 Alert Options: Single timeframe: each selected timeframe alert separately when a signal occurs Multi timeframes: all selected timeframes must agree for an alert to be triggered Both options have an input to select the timeframes to be used for the alert(s). How to understand the status: Green/Red square: RSI above/below 50 line Green square + Red border: R
The FFx Dashboard MTF alerter will show you on a single chart all the timeframes (M1 to Monthly) with their own status for the indicator. 2 Alert Options: Single timeframe: each selected timeframe alert separately when a signal occurs Multi timeframes: all selected timeframes must agree for an alert to be triggered Both options have an input to select the timeframes to be used for the alert(s). How to understand the status: Green/Red square: Stoch above/below 50 line Green square + Red border:
The FFx Dashboard MTF alerter will show you on a single chart all the timeframes (M1 to Monthly) with their own status for the indicator. 2 Alert Options: Single timeframe: each selected timeframe alert separately when a signal occurs Multi timeframes: all selected timeframes must agree for an alert to be triggered Both options have an input to select the timeframes to be used for the alert(s). How to understand the status: Green/Red square: Price above/below Cloud (Kumo) Green square + Red bo
The FFx Dashboard MTF alerter will show you on a single chart all the timeframes (M1 to Monthly) with their own status for the indicator. 2 Alert Options: Single timeframe: each selected timeframe alert separately when a signal occurs Multi timeframes: all selected timeframes must agree for an alert to be triggered Both options have an input to select the timeframes to be used for the alert(s). How to understand the status: Green/Red square: MA pointing Up/Down Green square + Red border: MA po
The FFx Dashboard MTF alerter will show you on a single chart all the timeframes (M1 to Monthly) with their own status for the indicator. 2 Alert Options: Single timeframe: each selected timeframe alert separately when a signal occurs. Multi timeframes: all selected timeframes must agree for an alert to be triggered. Both options have an input to select the timeframes to be used for the alert(s). How to understand the status: Green square: Price above PSAR Red square: Price below PSAR Options
The FFx Dashboard MTF alerter will show you on a single chart all the timeframes (M1 to Monthly) with their own status for the indicator. 2 Alert Options: Single timeframe: each selected timeframe alert separately when a signal occurs Multi timeframes: all selected timeframes must agree for an alert to be triggered Both options have an input to select the timeframes to be used for the alert(s). How to understand the status: Green/Red square: CCI above/below levels (ie. 100/-100) Grey square: C
The FFx Dashboard MTF alerter will show you on a single chart all the timeframes (M1 to Monthly) with their own status for the indicator. 2 Alert Options: Single timeframe: each selected timeframe alert separately when a signal occurs Multi timeframes: all selected timeframes must agree for an alert to be triggered Both options have an input to select the timeframes to be used for the alert(s). How to understand the status: Green/Red square: ADX above level Grey square: ADX below level Red bor
The FFx Dashboard MTF alerter will show you on a single chart all the timeframes (M1 to Monthly) with their own status. 2 Alert Options: Single timeframe: each selected timeframe alert separately when a signal occurs Multi timeframes: all selected timeframes must agree for an alert to be triggered Both options have an input to select the timeframes to be used for the alert(s). How to understand the status: Green/Red square: bullish/bearish candle Options available in the FFx Dashboard Alerter
The [GRAFF] III manual trading system is based on multiple MetaTrader (MT4) indicators. Together, the entire PACK of GRAFF III indicators makes an advanced trading tool. The system consists of over 20 different custom-built indicators which have been carefully selected and tested in the long term to produce strong and efficient trading signals. The particular indicators are based on different mathematical formulas, so the entire system is calibrated to remove false signals from its own indicator
FFx Universal Strength Meter PRO is more than a basic strength meter. Instead of limiting the calculation to price, it can be based on any of the 19 integrated strength modes + 9 timeframes. With the FFx USM, you are able to define any period for any combination of timeframes. For example, you can set the dashboard for the last 10 candles for M15-H1-H4… Full flexibility! Very easy to interpret... It gives a great idea about which currency is weak and which is strong, so you can find the best pai
A simplistic indicator informing a user on RSI divergence by sending messages to mobile device and email. The indicator draws 2 vertical lines, marking two RSI extrema that formed the divergence. You get the alert, open the charts and make a decision. The indicator does not show past divergences, thus when you attach it to a chart for the first time you see nothing. Graphics and alerts will appear as soon as divergences do. Drop it in Tester to see how it works. Parameters: RSIPeriod - number of
Pan PrizMA CD Phase is an analogue of the МetaТrader 5 indicator , and is an option based on the Pan PrizMA indicator. Details . Averaging by a quadric-quartic polynomial increases the smoothness of lines, adds momentum and rhythm. Extrapolation by the sinusoid function near a constant allows adjusting the delay or lead of signals. The value of the phase - wave status parameter (which is close in meaning to the trigonometric phase or the angle of the radius-vector rotation in the trigonometric p
作者のその他のプロダクト
HFT Fast M1 Gold Scalper V8 EA
Martin Alejandro Bamonte
2.33 (3)
超最適化バージョン – MT4 HFT FAST M1 GOLD SCALPER V8.2 (MT4バージョン)は、これまでで最も強力で、安定性が高く、洗練されたリリースです。 HFTは高頻度スキャルピングEAであり、ゴールド(XAUUSD)のM1タイムフレームのみで取引を行います。毎日多数の取引を実行し、 非常に現実的なロットサイズ でスキャルピング戦略を実現します。そのため、専用のスキャルピング口座(RAWまたはECN)が必要です。 ICMarkets のRAW口座が特に推奨されており、低スプレッドかつ他社よりもスリッページが少ないのが特長です。 安定したインターネット接続またはVPSが必要です。 ご注意ください:ターミナルが停止すると、 FAST M1 は口座の制御を失います 。 公式チャンネル:  https://www.mql5.com/en/channels/binaryforexea 主な改善点 エントリーロジックの改善 EAは主要トレンド方向のみでエントリーします。逆張りは一切行いません。 勝率の向上 内部ロジックが調整され、トレードの成功率が上昇しました。 口
HFT Fast M1 Gold Scalper MT5 EA
Martin Alejandro Bamonte
2.11 (9)
HFT AI FAST SCALPER V10.1 これまでで最も先進的なバージョンのEAです。 AIによる意思決定 、 マルチAI投票 、 ダイナミックな取引ロジック を完全に統合して再構築されました。 このEAは XAUUSD(ゴールド) のM1専用として設計されていただけでなく、現在は BTCUSD と ETHUSD も完全にサポートし、高頻度エントリー、スマートなリスク管理、そして高い適応性を備えています。 OpenRouter接続の無料AI と高度なフィルターを組み合わせ、市場のあらゆる状況で精密なトレードを実現します。 インタラクティブマニュアル V10.1 とプリセット: https://www.mql5.com/en/market/product/143202/comments 公開チャンネル ライブシグナル付き):   https://www.mql5.com/en/channels/binaryforexea V10.1 の主なアップグレード: BTCUSD と ETHUSD の完全統合 V10.1では、EAはゴールド(XAUUSD)に限定されなくなりま
NextCandlePredictor インジケーター NextCandlePredictorは、再描画しない、色が変わらない、動かない、消えない、遅延がないアラート付きのシグナルインジケーターです。あらゆるタイムフレームで次のキャンドルまたはその次のキャンドルの方向を識別するのに役立ちます。ニューヨーク、ロンドン、またはその両方の重なり合う高ボラティリティ市場に特にお勧めです。 主な特徴: タイムフレームの汎用性: M1からH1以上のあらゆるタイムフレームで迅速かつ正確なシグナルを提供します。 明確な買い/売りシグナル: ADXのDI+とDI-ラインを使用して明確な買いと売りのシグナルを生成し、最良のトレード判断を下せるようにします。 直感的な視覚化: シグナルはチャート上に緑色(買い)と赤色(売り)の矢印で直接表示され、迅速かつ簡単に読み取れます。 カスタマイズ可能な設定: 分析するバーの数とアラートオプションを好みとトレード戦略に応じて調整できます。使用するTFに応じた提案表を以下で確認してください。 即時およびオプションのキャンドル終了時アラート: デフォルトでは、ADX条件が
Candle Probability Scalper 使用ガイド このインジケーターはスキャルピングを簡単かつ100%直感的にします。 Candle Probability Scalper は、 リアルタイム で現在のローソク足における買い手と売り手の強さのパーセンテージを一目で表示します。 パーセンテージは各ティックごとに更新されるため、秒ごとに買い手と売り手が何をしているのかを知ることができ、遅延はありません。これにより、各勢力の強さを判断または確認し、価格の動向を予測するのに大いに役立ちます。 以下は使用方法のガイドです: 1. M1での買い手と売り手のパーセンテージを確認し、他の時間枠(M5、M15)で確認する: M1での買い手のパーセンテージが60%以上 で、M5およびM15でもM1と一致して60%以上である場合、 買い の良いシグナルがあります。 M1での売り手のパーセンテージが60%以上 で、M5およびM15でもM1と一致して60%以上である場合、 売り の良いシグナルがあります。 これにより、勢いが一時的ではなく、方向性が堅固であることが確認されます。 非常にシンプ
Aurum Apex Mt4 EA
Martin Alejandro Bamonte
5 (2)
今すぐ コメント タブからAurum Apexのデモバージョンをダウンロードして、ご自身のブローカーでのパフォーマンスを評価できます! の説明 Aurum Apex EAは、MT4プラットフォーム向けに設計された強力な100%自動化された取引ツールです。リアルタイムで市場を分析し、さまざまな取引の機会を検出します。 すべてのレベルのトレーダーに適したAurum Apex EAは、リスクパラメータを介して調整可能な3つのリスクモードを提供します: リスク = 0.1(低リスク): 金の動きに慣れていない新規トレーダーに最適です。この設定では、驚きを最小限に抑えながら信頼を築きます。 リスク = 0.2(中リスク): 金取引に精通した経験豊富なトレーダーにお勧めです。利益の可能性とドローダウンの間で最適なバランスを実現します。 リスク = 0.3(高リスク): 1日数時間しかロボットを操作しない上級トレーダー向けです。この設定は、EAを3〜4時間後に無効にする人に適しています。USDやBTCの重要なニュースイベント中は注意が必要です。 ECNまたはゼロスプレッド口座で最低$1000から始
「Scalping Signal No Repaint No Lag」は、どのチャートにドラッグしても、テンプレートや他のインジケーターをロードする必要なく、必要なすべてのインジケーターを自動的にロードする市場で唯一のインジケーターです。提供された画像とまったく同じようにチャートを自動的に設定します。このインジケーターはリペイントや遅延のないシグナルを保証し、すべての通貨ペアおよび時間枠(TF)でのスキャルピング戦略に最適です。 機能 インジケーターの自動ロード :インジケーターを任意のチャートにドラッグすると、追加の必要なインジケーターがすべて自動的にロードされ、設定された好みに応じてチャートが設定されます。ただし、設定からパラメータを変更することもできます。 チャートの可視化 :日本のローソク足や特定の色を使用して、視覚化を改善するためにチャートのプロパティを調整します。背景やローソク足の色は必要に応じて変更できます。 シグナル生成 :2つの移動平均線の差およびRSIとそのEMAのクロスオーバーを使用して、買いと売りのシグナルを生成し、チャートに矢印で表示します。 トレンドの可視化
Clear Breakout
Martin Alejandro Bamonte
5 (2)
「Breakout Buy-Sell」インジケーターは、異なる市場セッション(東京、ロンドン、ニューヨーク)での価格ブレイクアウトに基づいて、潜在的な売買機会を識別し、強調するために設計されています。このインジケーターは、トレーダーが買いゾーンと売りゾーン、および利益確定(TP)とストップロス(SL)レベルを明確に視覚化するのに役立ちます。 使用戦略 インジケーターは以下のように使用できます: 初期設定 :市場セッションを選択し、GMTオフセットを調整します。 市場の視覚化 :各セッションの開始時に描かれるブレイクアウトボックスを観察します。これらのボックスは期間の高値と安値を示します。 売買シグナル :ボックスの高値を超えた場合は買いシグナルと見なされます。安値を下回った場合は売りシグナルと見なされます。 リスク管理 :TP1、TP2、TP3、およびSLレベルを使用してポジションを管理します。TPレベルは異なる利益目標のために設計されており、SLは不利な動きに対する保護を保証します。 応用戦略 このインジケーターを最大限に活用するために、以下の戦略が推奨されます: ロンドンセッション
主な特徴: M15タイムフレームでGBPUSDに最適化: GBPUSDペア専用に設計およびテストされています。 推奨最低口座残高: 低いドローダウンを確保するために、最低$1000の口座残高が必要です。 スプレッドの互換性: 利益を最大化するために、低スプレッドまたはECN口座での使用が最適です。 リスク管理: エクスポネンシャルロット機能を1.0に設定することで無効にするオプションを含み、取引ニーズに応じて調整可能です。 カスタマイズ可能なパラメータ: 調整可能なパラメータの範囲を提供し、ユーザーがEAを自分の取引スタイルとリスク許容度に合わせて調整できるようにします。 GBPUSD Pip Hunter EAのパラメータ説明 MM(マネーマネジメントの切り替え) 説明: マネーマネジメント機能を有効または無効にするための切り替え。 オプション: いいえ: マネーマネジメントを無効にします。 はい: マネーマネジメントを有効にします。 MMType 説明: 使用するマネーマネジメントの種類を指定します。 オプション: いいえ: マネーマネジメントを無効にします。 はい: マネーマネジ
MTFMA(マルチタイムフレーム移動平均)インジケーターは、異なる時間枠で複数の移動平均(MA)を使用して、メインチャートとは別のウィンドウで買いと売りのシグナル(リペイントしない)を提供します。これは、短時間枠でのスキャルピングや長時間枠での長期取引の両方に適しており、多用途で解釈が簡単です。 なぜマルチフレームなのか? マルチフレームという用語は、インジケーターが複数の時間枠のデータを使用および組み合わせる能力を指します。MTFMAは、4つのカスタマイズ可能な移動平均(MA)に基づいてシグナルを計算して表示します。各MAは、異なる期間、計算方法、および価格タイプに調整できるため、トレーダーは1つのチャートで短期および長期のトレンドの組み合わせを見ることができます。 重要なポイント: 多用途性:分から月まで、あらゆる時間枠で使用可能。スキャルピングから長期取引まで適しています。 リペイントしない:シグナル(上矢印または下矢印)が生成されると、その色は変わらず、トレーダーが生成されたシグナルに基づいて取引判断を行うことができます。 簡単な解釈:買いと売りのシグナルは、下部インジケーター
「MultiSymbol & TF Chart Integrated」インジケーターは、迅速に包括的な市場ビューを提供するために設計されており、好みの時間枠で最大60の通貨ペアを単一のチャートで監視すること(複数モード)や、すべての時間枠で取引しているペアを表示すること(シンプルモード)を可能にします。 主な利点: 完全監視: 単一のチャートで希望するすべてのペアを一目でリアルタイムで監視できます。 時間節約: チャート間の切り替えを避け、各ペアの動きをリアルタイムで確認できます。 トレンド分析: トレンドフォローのトレーダーに最適で、意思決定前にトレンドを確認するために上位の時間枠を見ることができます。 極端なカスタマイズ: インジケーターのすべての側面を特定のニーズに合わせて調整します。 極端なカスタマイズ: 高度に設定可能なインジケーターパラメーター: シンボルと時間枠: 最大60の異なるシンボルを設定できます。 各シンボルには独自の時間枠を持つことができます(例:M1、M5、M15、M30、H1、H4、D1、W1、MN1)。 表示モード: シンプルモード: 特定の時間枠で単一
異なる通貨ペアやタイムフレームを監視するために複数のチャートを切り替えるのに疲れましたか? Pairs and TF Changer インディケーターがあなたのトレード体験を革新します! すべての戦略インディケーターを読み込んだら、 Pairs and TF Changer をチャートに追加します。必要に応じて、その位置、色、または表示する列数を調整できます! 主な特徴: シームレスな統合: このインディケーターを簡単にトレーディング戦略に統合できます。 ワンクリックで、すべての通貨ペアとタイムフレームを単一のチャートで取引できます。 追加のチャートを切り替えたり開いたりする必要がなくなります。 高度にカスタマイズ可能: チャート上の任意の位置にその位置を調整します(上、下、左、右)。 ボタンの1行または10行を表示するように設定できます。 トレーディングテーマに合わせて色をカスタマイズできます。 チャートを清潔で整然と保つためにボタンを透明にします。 ユニバーサルな互換性: すべての種類のインディケーターと戦略に対応しています。 外為、金属、米国株、指数、石油、先物、暗号通貨など、す
GoTrend Multi-Timeframe インディケーター "GoTrend Multi-Timeframe" インディケーターは、異なる時間枠で通貨ペアの全体的および特定のトレンドを迅速かつ効率的に評価するためのトレーダーにとって必須のツールです。 このインディケーターは、トレーダーが市場の方向性を一目で明確かつ包括的に把握し、意思決定を最適化し、取引戦略の効果を高めることを可能にします。 主な特徴: マルチタイムフレーム分析: このインディケーターは、M5、M15、M30、H1、H4、D1の6つの異なる時間枠の詳細な分析を提供し、トレーダーが各期間のトレンドを理解できるようにします。 統合されたテクニカル指標: インディケーターは、RSI、SAR、MA、MACD、およびADXの5つの強力なテクニカル指標を使用して、各時間枠でのトレンド方向を決定します。 明確で直感的な視覚化: 信号は、直感的なシンボルと色でメインチャートの選択したコーナーに表示されます。これにより、トレーダーは一目で市場の状況を評価できます。 組み合わせ信号: 各指標の個別の信号に加えて、"GoTrend M
Gold Vertex EA
Martin Alejandro Bamonte
Gold Vertex EA is a reliable and stable option for those looking to automate their trading in the gold market. With a robust system based on one of the most effective indicators and a solid trend-following strategy, Gold Vertex EA is a powerful tool for traders who want precise, worry-free trading. Requirements Platform : MetaTrader 4 Supported Instruments : Specifically developed and configured for Gold (XAUUSD) Recommended Account Type : ECN or low spread Minimum Deposit Recommended : $100 Tim
Inferno Signals EA
Martin Alejandro Bamonte
Inferno Signals EA は、市場の大きな動きを利用するために設計されており、安定した M30 タイムフレームで動作します。 これは、少額の資金で取引を開始したい人に最適で、ペアごとにわずか 100 ドルから始めることができ、自動的な資金管理機能を備えています。これには、動的なロット調整とストップロス(SL)などの安全レベルが含まれます。 低いドローダウンと、最良のチャンスを捉えることに焦点を当てた戦略により、Inferno Signals EA は投資の安全性を損なうことなく収益を最大化することを目指しています。この EA は過剰な取引を避け、特定のゾーンでのみ取引を開き、強いトレンドの継続と可能な反転ポイントの両方を検出します。価格が最適なエリアにあるとき、Inferno Signals EA は行動し、一貫して取引を行いますが、明確なチャンスがない場合は一時停止します。 EA の操作方法: EA は Buy Stop と Sell Stop などの保留中の注文を使用し、それらは必要に応じて BUY または SELL の取引に変換され、常に安全なストップロス(SL)で保
The MarketPrice Indicator is designed to provide a quick, one-glance visualization of the trend direction for a currency pair across all time frames (Time Frames), streamlining decision-making. MarketPrice Indicator is based on daily levels and trading signals derived from moving average crossovers and market strength according to various technical indicators. It comes fully configured, though you can, of course, modify any parameters as desired. Indicator Logic The indicator uses a combination
Last 50 Pips
Martin Alejandro Bamonte
Last 50 Pips インジケーターは、最近の価格動向に基づいて買いと売りのチャンスを素早く特定するために設計されています。直近のローソク足の価格変動を測定し、価格が方向を変える可能性がある瞬間を黄色で強調表示します。 買いシグナル: インジケーターが 赤 から 黄色 に変わったとき、 買い ポジションを開く必要があります。これは、下降トレンドから上昇トレンドへの転換を示唆します。簡単さを確認するために画像をご覧ください。 売りシグナル: インジケーターが 緑 から 黄色 に変わったとき、 売り ポジションを開く必要があります。これは、上昇トレンドから下降トレンドへの転換を示唆します。 アラート: インジケーターはまた、音声、メール、またはプッシュ通知を通じてリアルタイムアラートを受け取るオプションを含んでおり、ユーザーがどのデバイスからでも迅速にチャートの新しいシグナルに反応できるようにします。 ご質問があれば、お気軽にご連絡ください :)
毎日、市場の開始時に、 Flashpoints Breakout は前日のデータ(高値、安値、終値)を使用してピボット、サポート、レジスタンスレベルを確認し、2つのブレイクアウトレベル(強気と弱気)を計算します。 このようにして、朝一番に新しいエントリーレベルが準備され、Take Profit (TP) と Stop Loss (SL) の値も提供されるため、追加の計算なしで買いのストップ注文や売りのストップ注文を設定できます。 Flashpoints Breakout を使用すると、毎日1または2の買いのストップ注文と1または2の売りのストップ注文を設定し、期待されるブレイクアウトレベルに基づいて機会を逃さないようにできます。 上部のデータパネルを確認し、注文を設定します — 買い注文が1または2、売り注文が1または2です。パネルには、正確なエントリー値、SL、TPが表示され、チャートにはこれらの値に対応する線も表示されます(画像を参照してください)。 1. 買い操作 (BUY): エントリー 1 "BUY" ==> BUYエリア内: 注文 1: BUYエリア内でBUY STOP。
BUYSELLMAGIC is a non-repainting signal-type trading indicator designed to precisely detect entry points in the market.  Features Reliable and permanent signals : BUYSELLMAGIC signals are final once the candle closes, ensuring they will not be modified or removed from the chart. This gives you the confidence of working with an indicator that keeps its signals stable and trustworthy. Comprehensive alerts : In addition to signals on the chart, you’ll receive notifications via email, pop-up alerts
Automatic Fibonacci Pivots automatically calculates pivot levels and support/resistance based on Fibonacci, clearly showing key reference points that indicate potential reversal or trend continuation zones, as well as buy and sell areas . Designed for traders seeking clarity on charts without having to recalculate and manually place Fibonacci levels each time. Once set up on your computer, it will send an alert to your phone when a potential buy/sell signal is issued, allowing you to trade direc
M1 Easy Scalper
Martin Alejandro Bamonte
4 (3)
M1 EASY SCALPER is a scalping indicator specifically designed for the 1-minute (M1) timeframe, compatible with any currency pair or instrument available on your MT4 terminal. Of course, it can also be used on any other timeframe, but it works exceptionally well on M1 (which is challenging!) for scalping. Note: if you're going to scalp, make sure you have an account suitable for it. Do not use Cent or Standard accounts as they have too much spread! (use ECN, RAW, or Zero Spread accounts) Robustn
Trade Insights Display is the ideal companion for traders who want to operate with clarity and precision. This indicator provides real-time access to critical account data, such as: Balance Equity Margin Spread Swap Remaining time for the current candle . These data points are essential, regardless of the strategy or other indicators you use. Having this indicator always visible allows you to quickly assess your account status, the swap for each pair (helping you avoid high-cost trades), and the
EuroGeddon EA
Martin Alejandro Bamonte
EUROGEDDON EA – 卓越した安定性とリスク管理 EUROGEDDON EA は、 自動適応型インテリジェンス を搭載した全自動のトレーディングロボットで、小規模なアカウントでも安定的に成長できるよう設計されています。 資金の管理とリスクの制御に焦点を当て、あなたの口座をしっかりと守ります。 0.01ロットあたり200ドルという極めて低いリスク設定により、 低ドローダウンでの運用 を実現し、 試してみる価値のあるパフォーマンス を発揮します。 ぜひデモ版をダウンロードして、ご自身で体験してみてください。 バックテストだけに頼らず、私のチャンネルにあるデモアカウントで実際の動きをご確認ください。 経済指標発表中も安定稼働 高インパクトのファンダメンタル要因があっても、EAのロジックは動じません。 重要なニュース中でも、安定して稼働し続けます。 自動適応型インテリジェンス (これがニュース時にも強い理由です) あらかじめ設定されたエントリー間隔やTP(利確ポイント)は、通常時にはそのまま使用されますが、 ボラティリティの急変 を検知すると、リアルタイ
ZeroLag TrendCandle — リペイントなしのリアルタイムローソク足カラーリング&アラートシステム ZeroLag TrendCandle は、高度な Williams Percent Range(WPR)インジケーターの分析に基づく、 リペイントしないリアルタイムトレンド検出ツール です。トレンドの変化、モメンタムの変動、反転の可能性を動的な色分けシステムで視覚化します。 画像に示すように、チャートは直感的かつ見やすく設計されており、トレーダーは現在のマーケットの方向性を瞬時に把握できます。一目で優勢なモメンタムとその強さを識別できます。 主な機能: リペイントなし リペイントなし、 バックペイントなし 、 シグナルが消えることなし 、 リアルタイム取引中の誤アラートなし — 詳細な技術的説明は以下をご覧ください。    チャートに表示された情報はそのまま残ります。 リアルタイム検出(ゼロ遅延) シグナルは現在のローソク足の確定後、即座に生成されます。遅延や再計算はありません。常に確定した価格アクションに基づいて反応できます。 すべての銘柄・時間足に
Candle Fusion Pro — パターン認識 + トレンドフィルター + モメンタムフィルター(リペイントなし) 強力なローソク足パターンを検出し、リアルタイムのトレンドとモメンタム分析でその強さを確認しましょう。 Candle Fusion Pro は、 価格アクションの精度 、トレンド構造、 多層的な確認 を重視するトレーダーのための究極のビジュアルツールです。 主な機能 パターンベースのエントリー :10種類以上の高度な日本のローソク足パターンを検出します: 流れ星(レベル2、3、4) 強気/弱気の包み足(エンゴルフィング) モーニングスター/イブニングスター 十字線およびその派生形 ハンマー(レベル2、3、4) 差し込み線/黒い雲のカバー リペイントなし・遅延なし :矢印やパターンラベルはローソク足が確定した後にのみ表示されます。 見たままが真実です 。 リアルタイム確認 : トレンドフィルター (時間足に応じて自動調整) RSI強度ラベル :色で状態を表示(緑 <30、橙、赤 >70) ADXフィルター :トレンドの継続またはレンジを検出(しきい値は25): 強
ClearView Trend Finder — どれだけ明確か、見えますか? チャートがノイズでいっぱいだと感じたことはありませんか?インジケーターが多すぎて、信号が交差し、分析が逆に難しくなることは? ClearView Trend Finder は視覚的な混乱を完全に排除し、本当に重要なこと、つまり 明確なトレンド に集中できるようにします。 このシステムは、チャートを一切リペイントせず変更もされない、クリーンで正確なビューに変換します。 各ローソク足は、市場の支配的な方向だけを表示するようにフィルタリングされています。これはただのローソク足ではありません。ノイズを取り除き、実際のトレンドを際立たせるために特別に設計されています。チャートの右上には、現在の主要トレンドが上昇中( UPTREND )なのか下降中( DOWNTREND )なのかが明確に表示され、解釈の必要はありません。 ご覧の通り、非常にシンプルです: 迷いなし、解釈不要、混乱なし 。インジケーター内部では複雑な計算が行われていますが、ユーザーは明快で直感的なチャートでトレードできます。 初心者トレーダーに最適
ARIA Connector EA
Martin Alejandro Bamonte
2.17 (30)
Aria Connector EA – V4 (学習マシン + XGBoost学習モデル +112個の有料・無料AI + 投票システム + 外部・編集可能プロンプト) 市場のほとんどのEAが「AI」や「ニューラルネットワーク」を使用していると主張しながら、実際には基本的なスクリプトのみを実行している中、 Aria Connector EA V4 は真のAI駆動トレーディングの意味を再定義します。 これは理論ではなく、マーケティングの誇大宣伝でもありません。あなたのMetaTrader 5プラットフォームと112の実際のAIモデルとの直接的で検証可能な接続であり、次世代XGBoostエンジン、編集可能プロンプト、マルチAI投票システムと組み合わされています。 初日から、Ariaは透明で進化するエコシステムとして設計されました:最初は直接GPT接続、次に自動化、そして戦略監査。 現在、V4において、Ariaは真の学習マシンとなります 。市場状況に適応し、リアルタイムで戦略を最適化し、外部の編集可能プロンプトでその知能を完全にカスタマイズできます。 60,000以上のライブ取引分析 、
Ai FGS EA
Martin Alejandro Bamonte
1 (1)
This EA is a private edition developed for traders who are part of our advanced testing and support program. It offers early access to selected configurations and system updates that will later be integrated into the main public release. Only users who have previously communicated with our team and received confirmation should proceed with the purchase. The EA operates using our latest optimization logic and is intended for professional traders who understand the importance of running control
フィルタ:
レビューなし
レビューに返信