YouTube'dan Mağaza ile ilgili eğitici videoları izleyin
Bir alım-satım robotu veya gösterge nasıl satın alınır?
Uzman Danışmanınızı
sanal sunucuda çalıştırın
sanal sunucuda çalıştırın
Satın almadan önce göstergeyi/alım-satım robotunu test edin
Mağazada kazanç sağlamak ister misiniz?
Satış için bir ürün nasıl sunulur?
MetaTrader 5 için Uzman Danışmanlar ve göstergeler - 50

Infinite Storm EA is a safe and fully automated expert advisor that analyzes market trend and price movements and thanks to that is able achieve high rate of winning trades. Every order has StopLoss (either real or virtual) and EA has implemented advanced filtering functions together with spread and slippage protections. This EA does NOT use any of the dangerous strategies like Martingale, Grid or Arbitrage. This EA is fully customizable by user. This EA is not limited by trading pair or time
Multi-Timeframe EMA Trend Detector Pro Advanced EMA trend analysis tool with crossing detection and trend strength confirmation across 5 timeframes. The Multi-Timeframe EMA Trend Detector Pro is a comprehensive indicator built for traders who rely on trend-based strategies. It analyzes Exponential Moving Averages (EMAs) of 50, 100, and 200 across five key timeframes (M15, M30, H1, H4, and Daily) to identify reliable trends, trend reversals, and consolidation periods. Key Features Multi-Timefram
FREE
Trade donchian breakouts with complete freedom. This EA can trade any breakout period, any timeframe, with pending or market orders- as desired- and implements many other useful features for the exigent trader, like customizable trading sessions and week days, a martingale mode and inverse martingale mode. [ Installation Guide | Update Guide | Troubleshooting | FAQ | All Products ] Easy to use and supervise Customizable trading direction Customizable donchian breakout period It can trade using
FREE
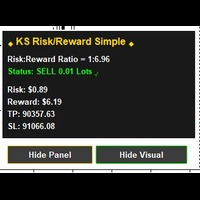
RR Ratio KS Simple Calculator Indicator Overview The RR Ratio KS Simple Calculator Indicator is a free, lightweight tool for MetaTrader 5 that automatically visualizes risk-reward (RR) ratios on your chart. Designed for manual traders and automated systems (EAs), it detects open positions with defined stop-loss (SL) and take-profit (TP) levels, then overlays clear visual zones to show potential risk and reward areas, including precise dollar amounts. This helps traders quickly assess trade setup
FREE

Raymond Cloudy Day Indicator for MT5 – Pivot-Based Reversal and Trend Levels Raymond Cloudy Day Indicator is a pivot-based level indicator for MetaTrader 5 (MT5). It was developed by Ngo The Hung based on Raymond’s original idea and is designed to give a structured view of potential reversal zones, trend extensions and support/resistance levels directly on the chart. The default settings are optimised for XAUUSD on the H1 timeframe, but the indicator can be tested and adjusted for other symbols
FREE

Several assets in several markets have the behavior of using specific numbers as Force Numbers, where support, resistance and price thrust is created. Let this indicator draw those levels of support and resistance for you. You can also stack it to show different level of Prices! This technique is being used by Tape Readers and Order Flow traders all over the world for a long time. Give it a try. Challenge yourself to study new ways of Price Action!
SETTINGS
What Price reference to use in the c
FREE

WallStreet Scavenger: Akıllı Ticaret Otomasyonu The WallStreet Scavenger ile ticaretinizi yükseltin. Piyasa fırsatlarını hassasiyet ve kontrolle yakalamak için uzmanlıkla hazırlanmış bir Uzman Danışman (EA). Bu EA, her seviyeden yatırımcı için sorunsuz otomasyonu sağlam risk yönetimiyle harmanlayarak tutarlı sonuçlar sunmak için sofistike, zaman içinde test edilmiş bir stratejiden yararlanır. Temel Özellikler: Akıllı Ticaret Girişleri: Piyasa akışına uygun girişler sağlayarak en iyi ticaret anl
FREE
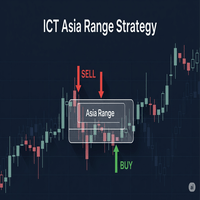
CT Asia Range EA: Trade the "Judas Swing" Like a Pro Are you tired of setting your bias correctly, only to be stopped out by a sudden, manipulative spike before the market moves in your intended direction? Do you see the market constantly engineering liquidity grabs above the Asian session high, only to reverse moments later? It's time to stop being the victim of stop hunts. The ICT Asia Range EA is meticulously engineered to turn this common market manipulation into your most reliable trading s
FREE

SPECIAL INTRODUCTORY PRICE!! Bollinger Reversal Pro (MT5) is a professional, fully-customisable Expert Advisor that targets reversal setups at the outer Bollinger Bands , filtered by RSI and ADX to avoid weak, choppy signals. It’s simple to run in the MetaTrader 5 Strategy Tester, so you can backtest, optimise, and find parameters that suit any symbol and timeframe. Packed with features ATR-based SL & TP – Adapts to volatility; no more one-size-fits-all levels. Currency or % risk – Set a fixed c

Bitcoin Rocket Pro AI Robot EA is a highly advanced automated trading system for MetaTrader 5, specifically developed for intraday trading on the BTCUSD pair. It integrates a powerful combination of Elliott Wave theory, harmonic pattern detection, artificial intelligence, and machine learning algorithms to deliver accurate trade signals and intelligent position management. At the core of Bitcoin Rocket Pro AI is its multi-layered analysis system. The EA uses Elliott Wave principles to map the na

IMPORTANT : When testing the EA or running it live, make sure to set "Activate MNG Martingale" to "True"
Hello & Welcome To MNG
MNG is a martingale EA that allows you to configure a lot of features that I'll detail below.
But first, I'd like to insist on the fact that a martingale EA is never safe, no matter if it has a good track record for 5+ years, if it shows incredible backtest results, if it's marketed as the best EA or whatever its price is ($30,000 or $50). A martingale EA might blow
FREE
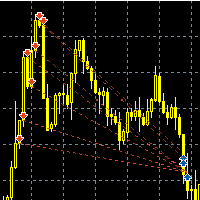
Название советника : Survivor (есть расширенная версия: https://www.mql5.com/ru/market/product/36530 ) Валютные пары : USDJPY, EURUSD, GBPUSD, AUDUSD, GBPJPY, XAUUSD, EURCHF Рекомендованная валютная пара : USDJPY Таймфрейм : М5 Время торговли : круглосуточно Описание : Трендовый советник с возможностью мартингейла и построением сетки ордеров. В советнике используются три группы аналогичных сигналов для открытия, закрытия и дополнительных сделок. При наличии тренда(определяется МА) ловится отс
FREE
Moving averages are very often used for analyzing currency pairs and trading. This Expert Advisor can analyze many moving averages at once and trade based on this. When the required number of moving averages signal a purchase, the adviser makes a purchase, if the indicators signal a sale, the advisor sells. Also, there is filtering spurious signals at low volatility based on the ADX indicator. In the settings of the adviser, you can set the required number of sliding ones, their period (the init
RSI + Grid Distance Strategy with 200 EMA Filter Overview The RSI + Grid Distance Strategy integrates momentum and mean-reversion principles within a structured grid trading framework. By combining the Relative Strength Index (RSI) with dynamic grid levels and a 200-period Exponential Moving Average (EMA) filter, the system seeks to optimize trade timing, trend alignment, and overall position efficiency. Core Logic 1. RSI Signal Generation
The algorithm utilizes a 17-period RSI , identifying b

The Bull DCA SP500 Signal – WinWiFi Robot Series (Indices, Energy & Forex) Overview: Elevate your trading precision with the latest indicator from the WinWiFi Robot Series . Designed specifically for high-volatility markets like Global Indices, Energy, and Forex, "The Bull DCA SP500 Signal" helps you filter out market noise and capture major trends on the H4 timeframe . Whether you are scalping for a breakout or swing trading for long trends, this tool provides clear visual signals to simplify
FREE

The indicator shows the current timeframe and symbol name. It is also possible to turn on the indication of time until the end of the current bar. In the settings, you can specify: - the location of the indicator in relation to the terminal window, top left, top right, bottom left and bottom right - a row of text display arrangements so that the inscriptions do not overlap each other - color - font - font size.
FREE

Alert Indicator for exponential moving average cross blue arrow for buy alert , fast ema 14 crosses above 50 pink arrow for sell alert , fast ema 14 crosses below 50 Default 14 ema fast & 50 ema slow add these indicators to chart Full Alerts , push, email, phone inputs for moving average lengths and alarm on off settings Please contact for help of an indicator alert suggestion
FREE

Chart Replay Pro enables one to manually place trades in Strategy Tester . Set your starting balance, choose your lot size, and trade historical charts exactly as if they were live. Jump through price action, take simulated trades, and sharpen your entries and exits inside the Strategy Tester with zero risk. Fast, intuitive, and built for traders who want real practice instead of wishful thinking.
FREE

DoubleOB, EUR / USD M5 ticareti yapmak için tasarlanmış otomatik bir EA'dır. Gelişmiş risk yönetimi ile Emir Blokları, dinamik çıkışlar ve takip eden durdurmalar kullanır. Güvenli ve tutarlı scalping için idealdir. Optimizasyon ve VPS ile uyumludur.
EUR/USD (M5) için optimize edilmiştir Son derece özelleştirilebilir parametreler Emir Blokları ve FVG tespiti Pivot noktaları ile Dinamik TP/SL yönetimi Otomatik İz Durdurma ve Eşitlik Saatlik oturum filtreleme Yerleşik günlük risk yönetimi
Araçl
FREE
Ultra-short-term trading assistant
One-click quick trading(Preset types orders)
base lot: minimum lot placed
Market buy/sell: base lot * level1 times
Spread free buy/sell: base lot * level2 times
Custom distance buy/sell limit: base lot * level3 times
Shortcut key: Q - Market buy W - Bid price linked to buy limit E - Specify the distance to hang the buy limit R - Close buy order A - Sell at market price S - Ask price linked to sell limit D - Specify the distance to hang the sale F - Cl

EMTB GOLD REAPER – Advanced Multi-Filter Gold Trading EA Experience the Precision of a Professional Gold Trading System. Designed for XAUUSD. Built for Results. Forget guesswork and emotional trading. The EMTB GOLD REAPER is a high-precision, multi-timeframe Expert Advisor engineered exclusively for the gold market (XAUUSD) . It combines robust candlestick logic with a multi-layered, configurable filter system to identify high-probability opportunities and manage risk with institutio
FREE

BBMA by RWBTradeLab is a clean chart-plotting indicator for MetaTrader 5 that combines Bollinger Bands , Linear Weighted Moving Averages (LWMA) on High/Low , and an EMA on Close to help traders read market structure visually. What it plots Bollinger Bands (Upper / Basis / Lower) LWMA on Low : 5 & 10 periods LWMA on High : 5 & 10 periods EMA on Close : default 50 periods Key features Plot-only indicator (no alerts, no trade execution) Non-repainting calculations (standard indicator plotting) Opti
FREE
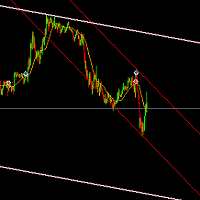
The indicator based on the trading channel in the MT5 trading terminal is a tool that automatically builds a channel formed by the peaks of the price chart in an upward and downward sequence. This indicator helps traders identify support and resistance levels, market trends, as well as set stop-loss and take-profit levels for optimal trade management. This version of the indicator is equipped with a basic trading logic, which can be disabled in the settings and used as an indicator for your tra
FREE

This is a simple RSI indicator, but unlike the original one, it sends alerts when volume falls below the upper level or rises above the lower level, so you never miss a trading opportunity. Combined with support and resistance levels, it can provide strong entry opportunities into the market. I recommend keeping the levels as they are, i.e. 75 above and 25 below Check out my signal " PipStorm Invest ", save it to your favorites and come back from time to time to check it again :)
FREE

Vantage FX Matrix Basic is a specialized market analysis dashboard designed for the MetaTrader 4 platform. It allows traders to monitor the relative strength and momentum of major global currencies in real-time. This edition is optimized for traders focusing on the four most liquid currencies: USD, GBP, JPY, and AUD . The dashboard combines multi-timeframe analysis with a proprietary RSI-based algorithm to identify potential trend continuations and reversals without switching charts. Functiona
FREE

Hetzer News Trading, önemli haber bültenleri sırasında çalışmak üzere özel olarak tasarlanmış akıllı bir ticaret robotudur. Önemli ekonomik ve finansal verilerin yayınlandığı zamanlarda piyasaya giriş yapmak için belirli zaman aralıkları ayarlayarak, işlemlerinizi önceden planlamanızı sağlar. Hetzer News Trading'in Başlıca Avantajları: Esnek Konfigürasyon: Haber takvimine göre ticaret programınızı önceden ayarlayabilirsiniz. Örneğin, eğer yarın saat 16:00 ve 17:00’de önemli haberlerin yayınlana
FREE

MFI Divergence is a technical indicator that detects regular bullish and bearish divergences between price and the Money Flow Index (MFI) at swing highs and lows. It highlights potential reversal points by drawing clean green (bullish) and red (bearish) arrows directly on the chart. The indicator uses configurable swing detection, customizable MFI period, and an optional MFI threshold filter to show signals only in oversold/overbought zones. Alerts are triggered only once per bar on candle close
FREE

Alım, kâr alma (Take Profit) ve zarar durdurma (Stop Loss) seviyelerini grafik üzerine kolayca çizerek işlem sinyallerini analiz edin ve takip edin. Temel Özellikler Giriş, TP1, TP2, TP3 ve SL değerlerini kolayca girin Sinyal zamanını göstermek için isteğe bağlı dikey çizgi Her çizgi için özelleştirilebilir etiketler ve renkler Sinyalin doğruluğunu ve risk/ödül oranını görsel olarak değerlendirin Tüm semboller ve zaman dilimleri ile uyumludur Yeniden çizim yok, gecikme yok — net ve sabit çi
FREE
Range Identifier v3 User Guide 1. Overview The Range Identifier v3 is a technical analysis tool designed to automatically detect and visualize periods of market consolidation, commonly known as ranges. this MQL5 version brings the same powerful logic to the MetaTrader 5 platform. The primary function of this indicator is to draw a channel around recent highs and lows during periods of low volatility. When the price breaks out of this channel, the indicator provides an alert, helping traders iden
FREE

The Daily Highs and Lows Indicator is a versatile tool that combines support and resistance levels with real-time market dynamics. By incorporating previous daily highs and lows, it provides valuable insights into market psychology and identifies potential areas of price reversals or breakouts. With its ability to adapt to changing market conditions and customizable options, traders can stay ahead of trends and make informed decisions. This indicator is suitable for various trading styles and ti
FREE

Support Resistance Indicator The "Support Resistance" indicator is a versatile tool designed to help traders identify key support and resistance levels based on an underlying algorithm. These levels indicate price points where an asset historically experiences buying (support) or selling (resistance) pressure. The indicator allows traders to visualize these levels on their charts, making it easier to make informed decisions. All Products | Contact PARAMETERS: Timeframe :
Users can select the
FREE

SQUID'E BIRAKIN...
GRID'İNİZİ KONTROL EDİN!!
Squid Grid, Bay Squid işini hallederken kullanıcının sadece "Başlat"a tıklayıp arkanıza yaslanıp rahatlamasını sağlayan, kullanımı çok basit bir grid yatırımcı sistemidir!
Strateji, fiyat X puan hareket ettiğinde bir pozisyonun açılacağı kullanıcı tanımlı bir nokta mesafesi sistemine dayanmaktadır.
Koşullu mantık geçerli kalırken birden fazla pozisyon açılmaya devam edecektir. Pozisyon sayısı özelleştirilebilir.
Geri çekilme yüzdesine dayalı ve

The AUDUSD Linear Regression Range Reversion (H1) is an algorithmic trading strategy for MetaTrader, tested on AUDUSD using the H1 timeframe from January 2, 2015, to August 22, 2025. There is no need to set up parameters, all settings are already optimized and fine-tuned.
Recommended broker RoboForex because of EET timezone.
You can find the strategy source code for StrategyQuant at the link: https://quantmonitor.net/audusd-linear-regression-range-reversion-h1/
Key details are:
Main Chart:
FREE

Mi Easy Order MT5 es un programa diseñado para facilitar y optimizar la ejecución de operaciones de compra y venta en los mercados financieros, proporcionando al trader una herramienta práctica, precisa y confiable para la gestión del riesgo. Su objetivo principal es simplificar el proceso de entrada al mercado, eliminando cálculos manuales y reduciendo errores comunes que suelen producirse al momento de definir el tamaño de la posición. El sistema permite al usuario ingresar como parámetro el n
FREE

MSX Hybrid HeikenAshi EA — Lite Version Product Description MSX DSHA Simple Free EA is a free educational Expert Advisor designed to demonstrate the basic working principles of the Double Smoothed Heikin Ashi (DSHA) core engine . This EA is released as a learning and demonstration tool , showing how DSHA candle patterns can be used to generate: Buy Entry Buy Exit Sell Entry Sell Exit based strictly on closed candle analysis , without repainting or advanced trade management. How the DSHA C
FREE

Shadow Mark Scanner Your Edge in Candle Range Theory – Automate Advanced Price Action Setups Introduction - Make sure you know those strategies and backtested them before using this scanner - Use at your own risk Shadow Mark Scanner is a cutting-edge MetaTrader 5 indicator that automatically identifies advanced price action setups using candle range theory . This powerful scanner detects high-probability patterns like Previous Candle Range (PCR) breakouts and Engulfing Sweeping Candles (also kn
FREE

Pivot Points Classic – L’indicatore essenziale per ogni trader tecnico Questo indicatore disegna automaticamente i livelli di Pivot Point più utilizzati dai trader professionisti, con supporto completo a 4 metodi di calcolo: Metodi supportati :
• Traditional
• Fibonacci
• Woodie
• Camarilla Caratteristiche principali :
Calcolo su timeframe superiore (multi-timeframe)
Visualizzazione chiara dei livelli P, R1, R2, R3, S1, S2, S3
Etichette dinamiche con nome e valore del livello
Colori per
FREE

News Radar Pro transforms MT5’s built-in economic calendar into a live, on-chart trading tool. View upcoming macroeconomic events directly on your chart with impact-based filtering, countdown timers, and intelligent alerts, all in your chosen timezone. No external websites, APIs, or data feeds required. How It Works Economic Calendar Integration
Access MT5’s global economic events database directly on your chart. Event Filtering
Filter economic events by impact level (High, Medium, Low) and cu
FREE

SuperTrend TV-Style replicates the classic SuperTrend indicator from TradingView, now available for MetaTrader. It uses ATR-based volatility to detect trend direction and plot dynamic buy/sell zones on the chart. Green line: uptrend Red line: downtrend Arrows: buy/sell signals at trend shifts Customizable source price (HL2, HLC3, etc.) and ATR method Simple, fast, and familiar - ideal for traders switching from TradingView or looking for a clean trend-following tool.
FREE

AllTF Trend Bias Indicator is a professional tool to visualize market bias, designed mainly for 1-minute charts. The colors are not trading signals by themselves, but a visual compass to guide your decision-making: HiddenEdge release model
All HiddenEdge tools follow the same structured release plan.
Each indicator is released initially for free to collect feedback.
After reaching a stable user base, it moves to a fixed paid tier.
Some utilities remain permanently free as part of the Hidde
FREE

TANIN POLYLINE MT5 is the ultimate drawing assistant for Price Action traders. If you love the flexibility of the Polyline tool on TradingView, this indicator brings that exact experience to your MetaTrader 5 terminal.
Designed by Tanin Coder , this tool allows you to map out market structures, waves, and trends with speed and precision. A professional, fast, and convenient Polyline drawing tool inspired by TradingView. Supports Magnetic Snap, Straight Lines, and Auto Price Labels. RECOMMENDE
FREE
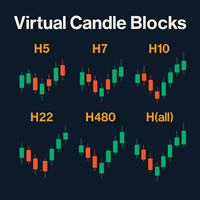
Sanal Mum Blokları – Piyasayı sınırsız görselleştirin Sanal Mum Blokları (Virtual Candle Blocks), MetaTrader 5 için, platformda doğal olarak bulunmayanlar da dahil olmak üzere, istediğiniz herhangi bir özel zaman diliminde mumlar oluşturmanıza ve görselleştirmenize olanak tanıyan gelişmiş bir göstergedir. Başlıca Özellikler: Özel Zaman Dilimleri: Temel mumları istediğiniz sürenin blokları halinde gruplayarak (ör. 5 saat, 14 saat, 28 saat, 72 saat vb.) yeni bir sanal mum oluşturun. Bu sayede Trad
FREE

The Investment Castle Chances indicator will show signals on the chart for entering a buy or sell trade. There are 2 types of signals for each direction as follows: Buy / Sell (Orange colored candlesticks) Strong Buy (Green colored candlesticks) / Strong Sell (Red colored candlesticks) You may place a buy trade once you see the Buy arrow or vise versa, or you might prefer to wait for a further confirmation “Strong Buy” / “Strong Sell”. This indicator works best with the high time frames H1,
FREE

A Renko Tick chart based on continuously adjusting percentage.
Live Renko bricks formed by tick data
Adjustable brick width expert for indicator attached Scalp with a Renko, get weird.
The settings can and will break the script if you turn them up too high. Turning off outline mode will not look as nice, but can potentially allow for a larger number of bricks.
FREE

EuroGuard EA – The Ultimate Trading Solution Introducing EuroGuard EA , a state-of-the-art trading tool designed by professional traders with over 7 years of experience in the forex market. This Expert Advisor leverages a unique and adaptive algorithm that excels in navigating through all market conditions, from extreme volatility to stable trends. EuroGuard EA has been tested rigorously in various scenarios and has consistently delivered impressive results. Its innovative design and unma
FREE
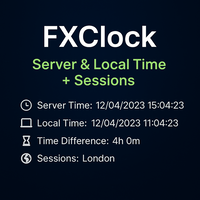
FXClock – Professional Clock Indicator for Traders Important Reminder:
If you find this tool helpful, please support the work by leaving a comment or rating.
Your feedback motivates further development!
The FXClock indicator is a practical and simple tool that displays time directly on your trading platform, allowing you to track multiple key pieces of information at the same time. It is specially designed to help traders synchronize their trading with market hours and global sessions. Key F
FREE

Fair Value Gap Sweep is a unique and powerful indicator that draws fair value gaps on your chart and alerts you when a gap has been swept by the price. A fair value gap is a price gap that occurs when the market opens at a different level than the previous close, creating an imbalance between buyers and sellers. A gap sweep is when the price moves back to fill the gap, indicating a change in market sentiment and a potential trading opportunity.
Fair Value Gap Sweep indicator has the following
FREE

Bu ücretsiz aracı beğendiyseniz lütfen 5 yıldızlı bir derecelendirme bırakın! Çok teşekkür ederim :) "Risk Yönetimi Asistanı" Uzman Danışman Koleksiyonu, çeşitli piyasa koşullarında riski etkili bir şekilde yöneterek işlem stratejilerini geliştirmek için tasarlanmış kapsamlı bir araç paketidir. Bu koleksiyon, üç temel bileşenden oluşur: ortalama alma, değiştirme ve korunma uzman danışmanları, her biri farklı işlem senaryolarına göre uyarlanmış farklı avantajlar sunar.
Bu EA, piyasadaki standar
FREE

Product: Phantom Shadow Reversal Engine Version: 3.0 (Elite Edition) Developer: Trade With Thangam
THE ULTIMATE SCALPING TOOL FOR XAUUSD & MAJOR PAIRS
The Phantom Shadow Reversal Engine is not just another indicator; it is a complete trading system designed for precision scalping and day trading.
Instead of relying on lagging signals, this system uses a "Proprietary Shadow Engine" that analyzes Market
FREE

Stochastic RSI makes a stochastic calculation on the RSI indicator. The Relative Strength Index (RSI) is a well known momentum oscillator that measures the speed and change of price movements, developed by J. Welles Wilder.
Features Find overbought and oversold situations. Sound alert when overbought/oversold level is reached. Get email and/or push notification alerts when a signal is detected. The indicator is non-repainting. Returns buffer values for %K and %D to be used as part of an EA. (se
FREE
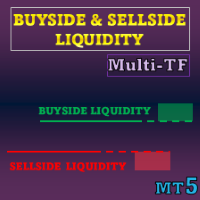
Özel teklif : TÜM ARAÇLAR , her biri yalnızca $35 ! Yeni araçlar $30 olacaktır ve ilk hafta veya ilk 3 satın alma için geçerlidir! MQL5’te Trading Tools Kanalı : en son haberlerim için MQL5 kanalıma katılın Bu gösterge likidite seviyelerini ve likidite bölgelerini ICT kavramlarına dayalı olarak görselleştirir; tek yönlü fiyat kaymalarını vurgulamak için Liquidity Voids gösterilir. Odak, bekleyen veya zararı durdur emirlerinin kümelenmeye meyilli olduğu yerler ve fiyat b

Free Session High Low Indicator for MetaTrader 5.
This indicator displays the High and Low levels
of a selected trading session.
Features:
Calculates session High and Low levels
Uses closed candles only (non-repainting)
Clean and simple visual display
Suitable for manual trading
Free version limitations:
- Single session
- No alerts
- No breakout logic
This free indicator is provided for educational purposes.
If you need:
Alerts
Multiple sessions
Breakout strategy
Expert Adv
FREE

Bu araç, ekonomik haberleri doğrudan grafik üzerinde gösterir. Yaklaşan olayları, yayınlanma sürelerini, önemlerini gösterir ve bildirim gönderir.
Kimler İçin:
Ekonomik haberleri takip eden yatırımcılar için
Haberlere göre işlem yapanlar için
Zamanında uyarı almak isteyen yatırımcılar için
Grafik üzerinde basit ve sezgisel bir takvime ihtiyaç duyan kullanıcılar için
Temel Özellikler Haber Paneli - Grafikte en yakın ekonomik olayı gösterir
Para Birimi Filtresi - Yalnızca işlem yaptığınız
FREE

Light Venus - Adaptive Grid Profit Maximizer *Users are encouraged to share their set files that have performed well in the comments section. Why Choose Light Venus? Master the Grid Strategy : Harness the power of grid trading, where orders are strategically placed at calculated intervals. This method allows you to profit from market fluctuations without being glued to your screen. Profit with Precision : Define your profit goals, and let Light Venus handle the rest. Its intelligent system clo
FREE

Elevate your trading with Kumo Cloud MT5 EA , a sophisticated automated trading solution built for MetaTrader 5. This EA harnesses the power of the Ichimoku Cloud (Kumo) and the momentum-confirming Awesome Oscillator to identify and trade high-probability breakout opportunities. Note: The program uses a rare signal generation logic that is double confirmed, using the Kumo Cloudstrategy. Make sure you understand the strategy! Backtest it in strategy tester on any currency pair of your choice and
FREE

This is the automatic realization of multi single and open position EA, welcome to use. It has passed many historical data tests before it was put on the shelves. The following is EA's principle of multiple orders and closing positions: 1. Through the golden fork generated by the two moving averages, multiple orders can be automatically bought. The cycles of the two moving averages can be set by themselves. The default value of the small cycle moving average is 5, and the default value of the l
FREE

Market Sessionsync** is a cutting-edge trading session indicator designed to enhance your trading experience by visually breaking down the market's daily rhythm. With a compact window overlaid on your chart, this indicator provides a split-second understanding of the current trading session through: Basic setup: Set Difference between your local time and your broker time , set DST(Daylight Saving Time) ON or OFF , set timescale sync you want to use (Local, Broker, CET) - A vertical time marker
FREE

Note: If the EA gives negative results in backtest of your desired chart, then just reverse the direction of the order from the settings and Enjoy your profit.
(DO NOT BUY THIS EA IF YOU CANNOT LOAD YOUR ACCOUNT WITH 1000USD MINIMUM)
AeroFVG Pro is a cutting-edge Fair Value Gap (FVG) trading Expert Advisor designed to give traders an institutional trading edge. It combines Smart Money Concepts (SMC) with advanced algorithmic logic to detect and trade high-probability market inefficiencies.
Wi
FREE

Koala Trend Line Upgraded To Version 1.2 Last Upgrade Improvement : New Parameter Added that allow user to connect trend line to 2nd or 3th or Xth highest or lowest point.
My Request :
**Dear Customers Please Release Your Review On Koala Trend Line, And Let Me Improve By Your Feed Backs.
Join Koala Trading Solution Channel in mql5 community to find out the latest news about all koala products, join link is below : https://www.mql5.com/en/channels/koalatradingsolution
WHAT ABOUT OTHER FREE
FREE
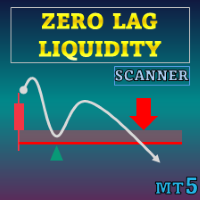
Özel teklif : ALL TOOLS , her biri sadece $35 ! Yeni araçlar ilk hafta veya ilk 3 satın alma için $30 olacaktır! MQL5’te Trading Tools Kanalı : Benden gelen en son haberleri almak için MQL5 kanalıma katılın Zero Lag Liquidity , daha düşük zaman dilimindeki fitil profillerinden ve yüksek hacimli fitillerden likidite bölgeleri çizer. Her anormal mum için gösterge, fitil içinde bir hacim histogramı oluşturur, yerel bir Kontrol Noktasını (POC) bulur ve bu fiyatı bir seviye olarak gösteri

Gold Pro SMC Big Player EA MT5 - Note This EA Can also be used on Indices such as US30, NASDAQ, FR40, DAX, UK, BTCUSD, Metals and Currencies. Write Separately to me for set files after purchase. Set file for Backtesting/forward testing is attached in Comment Section- Must Use it on XAUUSD/Gold in M30 time. The Gold Pro SMC Big Player EA MT5 is a next-generation trading system built on Smart Money Concepts (SMC) and institutional order flow logic .
It identifies high-probability zones where inst

The Squeeze Octopus 101: Gold XAUUSD EURUSD GBPUSD Pairs - Zone Scalper The Squeeze Octopus 101 is a high-frequency, multi-Momentum Expert Advisor (EA) designed for MetaTrader 5. New vision for 2026 market It utilizes a sophisticated "Squeeze" logic by layering momentum, trend strength, and moving averages to identify high-probability entry points. Why Squeeze Octopus 101: Loss Suspension: If the account equity drops below the Closeall threshold, it liquidates all positions and pauses trad

Arrow Strategy Builder — kullanıcının grafiğe yerleştirdiği yukarı/aşağı okları hatırlayan ve aynı koşullar tekrarlandığında alım-satım sinyalleri üreten bir Uzman Danışmandır (EA). Hem yeni başlayanlar hem de deneyimli yatırımcılar için uygundur; sezgisel bir arayüz ve her türlü finansal enstrümanda otomatik işlem için işlevsellik sunar. Metatraider 5 için çoklu para birimi ticaret danışmanının tam teşekküllü bir versiyonu burada .
Ana Özellikler Kolay strateji oluşturma: Giriş noktalarını iş
FREE
XMaster XHMaster Formula MT5 Indicator – No Repaint Strategy The XMaster / XHMaster Formula Indicator for MetaTrader 5 (MT5) is an upgraded version of the popular MT4 tool, designed to detect trend direction, momentum shifts, and high-probability reversal zones. With enhanced optimization for the MT5 engine, the indicator delivers stable No Repaint signals and performs efficiently on multiple asset classes including Forex, Gold, Cryptocurrencies, and Indices. The MT5 version integrates improved
FREE

TransitTrendlines this is a automatically trendline drawer, it draw both horizontal and diagonal trendlines. The horizontal trendlines are the pivot points of the day timeframe and the diagonal trendlines are based on the current time frames. You can adjust the diagonal trendlines by increasing the number of bars to draw the diagonal trendline and can also adjust the steepness. Note that the Horizontal trendlines are based on the day pivot points not currant time frame. Join mql5 transitbk98 cha
FREE
HEDGING ACCOUNTS ONLY!!! Double Trouble RSI uses 2 Moving averages to define trend then opens trades based on RSI over bought or over sold conditions. It also has a time filter to define trading times. Default settings are for 5 minute timeframe. This EA is highly configurable and can be optimized to be used on most instruments and currencies, including DAX and S&P 500
The money management section is also highly configurable and does not make use of any risky strategies like martingale etc..
FREE

Envelopes RSI Zone Scalper MT5 EA Unleash your trading edge with the Envelopes RSI Zone Scalper MT5 EA , an Expert Advisor for MetaTrader 5, engineered to thrive in any market—forex, commodities, stocks, or indices. This dynamic EA combines the precision of Envelopes and RSI indicators with a zone-based scalping strategy, offering traders a versatile tool to capitalize on price movements across diverse instruments. Whether you’re scalping quick profits or navigating trending markets, this EA del
FREE

Trading information panel with risk calculator, order management, fractal trend indicator, and customizable keyboard shortcuts for quick trading. Features: Real-time trading information display (spread, ATR, swap, price levels, etc.) Integrated risk calculator with three modes (lot size, money risk, point distance) Quick order management with keyboard shortcuts (buy, sell, close, half close) Multi-timeframe fractal trend indicator (shows price position relative to fractal high/low) Adjustable pa
FREE
The Smart FVG Statistics Indicator is a powerful MetaTrader 5 tool designed to automatically identify, track, and analyze Fair Value Gaps (FVGs) on your charts. Love it? Hate it? Let me know in a review! Feature requests and ideas for new tools are highly appreciated. :)
Try "The AUDCAD Trader":
https://www.mql5.com/en/market/product/151841
Key Features Advanced Fair Value Gap Detection Automatic Identification : Automatically scans for both bullish and bearish FVGs across specified histo
FREE
Volumized OrderBlocks MTF - Multi-Timeframe Volumetric Order Block Indicator
OVERVIEW
Volumized OrderBlocks MTF is an advanced Multi-Timeframe Order Block indicator that automatically detects, displays, and merges Order Blocks from up to 3 different timeframes on a single chart. Built with institutional Smart Money Concepts (SMC) method
FREE
MetaTrader mağazasının neden alım-satım stratejileri ve teknik göstergeler satmak için en iyi platform olduğunu biliyor musunuz? Reklam veya yazılım korumasına gerek yok, ödeme sorunları yok. Her şey MetaTrader mağazasında sağlanmaktadır.
Alım-satım fırsatlarını kaçırıyorsunuz:
- Ücretsiz alım-satım uygulamaları
- İşlem kopyalama için 8.000'den fazla sinyal
- Finansal piyasaları keşfetmek için ekonomik haberler
Kayıt
Giriş yap
Gizlilik ve Veri Koruma Politikasını ve MQL5.com Kullanım Şartlarını kabul edersiniz
Hesabınız yoksa, lütfen kaydolun
MQL5.com web sitesine giriş yapmak için çerezlerin kullanımına izin vermelisiniz.
Lütfen tarayıcınızda gerekli ayarı etkinleştirin, aksi takdirde giriş yapamazsınız.