 MetaTrader 5
 Experts
 지표
지표 라이브러리
라이브러리 유틸리티
유틸리티 위젯
위젯 규칙
규칙MetaTrader 5용 Expert Advisor 및 지표 - 50
 트레이딩 로봇과 지표를 사용하여 외환 거래를 더 수익성 있게 만들 수 있습니다. 트레이딩용 로봇을 사용하면 개점 및 폐점 거래를 자동화할 수 있으며, 지표는 시장 행동을 보다 정확하게 예측할 수 있습니다.
이 페이지에는 MetaTrader 5 응용 프로그램의 카탈로그가 나와 있습니다.
트레이딩 로봇과 지표를 사용하여 외환 거래를 더 수익성 있게 만들 수 있습니다. 트레이딩용 로봇을 사용하면 개점 및 폐점 거래를 자동화할 수 있으며, 지표는 시장 행동을 보다 정확하게 예측할 수 있습니다.
이 페이지에는 MetaTrader 5 응용 프로그램의 카탈로그가 나와 있습니다. 
오프닝 갭 EA는 주가 개장 시 갭을 거래하는 데 특히 적합합니다. 일반적으로 주식은 하락하는 것보다 상승하는 것이 더 크기 때문에 매수 포지션만 개설됩니다. 거래는 거래 시간 종료 직전에 이루어지며 개장 직후 다음날 마감됩니다. 여기서 발생한 격차는 이익으로 간주됩니다. NVDA를 이용한 백테스트에서는 좋은 수익이 발생했습니다. 이 EA는 귀하의 EA 포트폴리오에 좋은 추가 요소입니다.
EA의 장점:
- 마틴게일 없음, 그리드 시스템 없음
- 모든 거래는 SL로 보호됩니다
- 최소 100원의 적은 자본금으로도 거래가 가능합니다.
- NVDA 타임프레임 M1으로 테스트되었습니다. 그러나 다른 자산도 사용할 수 있습니다.
M1 시간대의 거래 창을 확인하여 거래 시간이 끝나는 시점을 확인하는 것이 중요합니다. 설정의 "거래 시간"에서 이 시간을 1분 일찍 설정할 수 있습니다.
예는 다음과 같습니다. https://www.mql5.com/de/marke
FREE

Historical Similarity Matcher Indicator (HI.SI.MA)
Try it free today — demo version now available! https://www.mql5.com/en/market/product/167114
Overview
The Historical Similarity Matcher is a technical analysis indicator for MetaTrader 5. It scans historical price data to find segments that show statistical similarity to a user-selected reference period on the chart.

KDJ Indicator for MT5 The KDJ Indicator for MT5 is a professional-grade momentum and trend analysis tool designed to help traders identify trend reversals , overbought/oversold conditions , and entry or exit opportunities with high accuracy. Originally developed as an enhancement of the Stochastic Oscillator , the KDJ adds a powerful J-line that reacts faster to price movement, giving traders earlier warnings of potential reversals. Key Features Three-Line System (K, D, J):
The K and D lines r
FREE

Prism Winner EA - Multi-Strategy Expert Advisor Prism Winner EA combines four proven trading strategies with flexible execution modes. Trade single positions with stop losses or use advanced grid strategies. The system includes comprehensive risk management and professional filtering. Key Features Four Trading Strategies RSI Mean Reversion: High-precision trades based on overbought/oversold conditions. Bollinger Bands Classic: Statistical captures of price extremes. Support/Resistance Bounc
FREE

VR 컬러 레벨은 추세선, 직사각형, 텍스트 등의 요소를 사용하여 기술적 분석을 적용하는 사람들에게 편리한 도구입니다. 차트에 직접 텍스트를 추가하고 스크린샷을 찍는 것이 가능합니다. 설정, 세트 파일, 데모 버전, 지침, 문제 해결 등은 다음에서 얻을 수 있습니다. [블로그]
다음에서 리뷰를 읽거나 작성할 수 있습니다. [링크]
버전 [MetaTrader 4] 표시기 작업은 한 번의 클릭 으로 수행됩니다. 이렇게 하려면 선이 있는 버튼을 클릭하세요. 그러면 커서 아래에 추세선이 나타납니다. 그런 다음 커서를 움직여 선 위치 를 선택하고 다시 클릭하여 수정하면 됩니다. 표시기 의 특징은 스타일과 색상의 모든 변경 사항이 자동으로 저장되고 나중에 새로 생성된 모든 그래픽 개체에 적용된다는 것입니다. 이 지표에는 서로 다른 스타일의 추세선을 설정하기 위한 두 개의 독립 버튼, 서로 다른 스타일의 두 개의 독립 직사각형, 자체 스타일이 있는 하나의 텍스트 필드 및 스크린샷 생성용 버튼
FREE
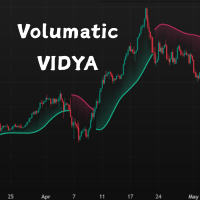
This is a custom VIDYA-based trend-following indicator for MetaTrader 5 (MT5), enhanced with ATR-band logic to adapt to market volatility. It provides dynamic trend zones and intelligent direction switching to support better trading decisions.
Unlike traditional moving averages, this indicator uses a momentum-adjusted VIDYA (Variable Index Dynamic Average) and combines it with ATR-based bands to detect trend shifts with greater precision. Features
Volatility-Adaptive Trend Logic – Uses ATR ban
FREE

초 단위 멀티 타임프레임 차트 (v3.0) 는 MetaTrader 5용 인디케이터로, 사용자 지정 초, 분 또는 시간 기반 타임프레임의 가격 움직임을 현재 활성 차트에 직접 표시합니다. 이제 차트에서 여러 사용자 지정 타임프레임 차트를 동시에 관리할 수 있는 대화형 온차트 컨트롤 패널도 제공합니다.
주요 기능 1. 사용자 지정 타임프레임 계산 가격 데이터를 사용자 지정 초, 분 또는 시간 기반 타임프레임으로 집계합니다. 설정 가능한 조회 범위를 통해 계산에 사용할 기본 타임프레임의 봉 개수를 지정할 수 있습니다. 2. 여러 차트 동시 실행 원하는 개수만큼 독립적인 사용자 지정 타임프레임 차트를 동시에 실행할 수 있으며, 각 차트는 별도의 설정 가능한 슬롯에서 관리됩니다. 각 슬롯에는 고유한 타임프레임, 차트 유형, 색상 및 표시 여부 설정이 제공됩니다. 각 슬롯은 활성 차트 창 또는 별도의 서브윈도우에 표시할 수 있습니다. 3. 차트 유형 선택 각 슬롯에서 표준 및 Heiken
FREE

SKY WALKER EA – The Silent Breakout Hunter for USDJPY
Precision • Discipline • Emotion-Free Trading Sky Walker EA is a professional-grade Time Range Breakout Expert Advisor , built specifically for USDJPY traders who believe in clean logic, controlled risk, and rule-based execution. This is not a martingale
This is not a grid
This is not a random scalper Sky Walker EA trades like a sniper — waits patiently, measures the range, confirms conditions, and executes with precision. CORE STRATEGY LOG
FREE

Multi RSI Dashboard RSI 기반 다중 심볼 스캐너. 최대 12개 종목을 모든 시간대에서 동시에 모니터링 — 차트 위 하나의 패널에서 모두 확인. 대상 사용자 RSI를 사용하며 수십 개의 차트를 전환하는 것에 지친 트레이더를 위한 도구입니다. 패널은 시장의 전체 그림을 한눈에 보여줍니다. 작동 방식 차트에 표가 나타납니다: 세로축에 종목, 가로축에 시간대. 각 셀은 RSI 값을 표시하고 구역에 따라 색상이 지정됩니다: 초록 — 과매도 구역. 색이 밝을수록 구역 깊이에 있음. 빨강 — 과매수 구역. 색의 강도가 신호 강도를 반영. 회색 — 중립 구역, 대기 중. 같은 종목의 여러 시간대가 같은 방향을 보일 때 — 분석의 순간입니다. 패널 기능 Canvas로 그려집니다 — 깜박임 없음. 색상 테마: Dark, Medium, Light. 글꼴 크기 조정 가능. 마우스로 드래그 가능. 종목 이름 클릭 — 해당 종목으로 즉시 차트 전환. 다중 복사본 한 차트에서 여러 복사본 실
FREE

English Eazy Grid — an automated grid recovery system for gold (XAUUSD). The expert manages a full trade cycle on its own: it opens a position, adds planned grid entries while the market moves against the basket, and closes the whole basket together at a money profit target. Position sizing, grid spacing and lot limits are all under your control. Features Fully automatic — no manual intervention needed once attached Basket closes on a money target in your deposit currency Lot cap so a singl
FREE

Market Seer VP Indicator - A Comprehensive Overview
The Market Seer VP Indicator represents a sophisticated fusion of six distinct trading methodologies, each carefully selected to address different aspects of market analysis. When combined, these components create a holistic trading framework that systematically addresses the three fundamental questions every trader must answer: Where is the market going? When should I enter? Where should I place my stops and targets?
The Smart Money vs Reta
FREE

" Outro " is an expert in automated " multi-symbol " trading that requires the trader to test on the pair of his choice and modify the entries according to his convenience. This Expert Advisor has been designed with non-optimized inputs, and uses a Martingale system for risk management. It is very important to read the blog post before you start. Enter to the private group . Outro uses two main indicators, Relative Strength Index and Stochastic Oscillator , for input decision making
FREE
Chart Link allows you to control multiple charts from one chart or multiple charts from multiple charts. Features 1. Synchronised Scrolling : Scrolling the master chart also scrolls all linked sub charts to the same position. Sub charts inherit offset and auto-scroll settings from the master chart. 2. Synchronised Timeframe : Switching the master chart timeframe also switches all linked sub charts. 3. Synchronised Symbol : Switching the master chart symbol also switches all
FREE

EA Performance Monitor MetaTrader 5용 유틸리티로, 열려 있는 모든 차트에서 활성 Expert Advisor를 자동으로 감지하고, 각 EA를 거래 데이터와 매핑하며, 단일 패널에서 드로다운, 손익, 승률 및 오픈 포지션 지표를 실시간으로 표시합니다. EA Performance Monitor는 MetaTrader 5용 자동 모니터링 유틸리티입니다. 설정 가능한 간격으로 열려 있는 모든 차트를 스캔하고, 매직 넘버와 심볼로 실행 중인 각 Expert Advisor를 식별하며, 차트의 구조화된 패널에 성과 데이터를 표시합니다. 이 도구는 종료된 거래 내역과 실시간 부동 포지션을 모두 추적하여 단일 연결 지점에서 계정의 모든 EA 활동을 통합적으로 볼 수 있습니다. 개요 초기화 시 유틸리티는 연결된 시점부터 계정의 거래 내역을 읽습니다. 활성 매직 넘버를 찾아 모든 오픈 포지션을 스캔하고, 각각을 Expert Advisor가 실행 중인 해당 차트에 매핑합니다.
FREE

Spots EA — Candlestick Patterns, Fully Automated
Spots EA turns the Spots indicator into a fully automated trading robot, trading the classic candlestick patterns — engulfing, hanging man, doji and more. It was built with one goal in mind: dependable automation with low drawdown. Ready-to-use set files are included.
What it does for you Pattern-based automation: trades classic candlestick signals automatically. Built for low drawdown: designed around steady, controlled trading. Set files inclu
FREE

각 기간에서 거래량이 가장 큰 캔들을 찾아 실전 레벨로 바꿔 줍니다. 거래량이 있던 곳 — 바로 그곳에 레벨이 있습니다. • 모든 기간(일, 주 또는 선택한 타임프레임)마다 거래량이 가장 높은 캔들을 찾아 그 High, Low, Mid를 레벨로 그립니다. • 레벨은 기간 경계에서 끝내거나 레이(ray)로 오른쪽으로 연장할 수 있습니다. • 캔들 타임프레임은 패널에서 클릭 한 번으로 전환. • 거래량 라벨에는 레벨을 결정한 캔들의 실제 거래량이 표시됩니다. • 멀티 타임프레임: 여러 기간의 최대 거래량 레벨을 동시에 추적. • 레벨 터치 알림(기본값은 꺼짐). 차트 위 컨트롤 패널: 타임프레임 선택과 설정 창이 있는 드래그 가능한 패널 — 11개 인터페이스 언어, 다크/라이트 테마, 18색 팔레트, 30–300% 패널 크기 조절. 모든 설정은 자동 저장됩니다. 사용 중 문제나 버그를 발견하시면 언제든지 연락해 주세요. 신속하게 수정해 드리겠습니다. 그리고 리뷰도 남겨 주시면 큰 힘이
FREE

GoldEdge ATR Price Border GoldEdge ATR Price Border is a free utility indicator designed to display dynamic ATR-based price borders directly on the chart. It helps traders visualize structured price zones, market expansion levels, and the central equilibrium line in a simple and clean format. This indicator is especially useful for traders who want to better understand market volatility and price positioning. It is also an important companion indicator for selected GoldEdge trading systems. Back
FREE

The TMA Centered Bands Indicator for MT5 draws bands on the chart and shows the overall price trend. It displays three bands - the lower and upper boundaries of the channel and the median. The bands are made up of moving averages, and each of them has an MA period. The name TMA comes from triangular moving averages, as the indicator draws triangular bands. The price will fluctuate between these ranges whenever the trend changes direction, thus creating entry and exit points. How to trade
FREE

Trading Session Zones Alert is a free visual session indicator for MetaTrader 5. It highlights the major trading sessions directly on the chart so traders can quickly see how price moved during each session and where session ranges overlap.
The indicator draws clear session zones and time labels for: - Sydney - Tokyo - Frankfurt - London - New York
Each session can display its own colored zone, label, and optional high/low lines. The session labels show the active time window on the chart, ma
FREE

이 제품을 사용하면 더 이상 타사 계산기를 사용하여 거래량을 계산하고 차트에 수동으로 입력할 필요가 없습니다. 리스크 리워드 유틸리티는 차트에서 직접 거래를 계산합니다. 이 패널은 거래를 표시하고 입력하는 데 사용됩니다. 진입선, 손절매선, 이익실현선을 거래 위치로 드래그하면 패널에 거래량, 현금 기준 리스크 및 잔액 대비 리스크 비율, 예상 수익, 리스크 리워드 비율이 즉시 표시됩니다. 진입 버튼을 클릭하면 유틸리티가 이러한 레벨을 사용하여 주문을 전송하며, 진입선 위치에 따라 시장가 주문 또는 지정가 주문 유형이 선택됩니다. 유용한 링크: 기타 개발 사항 - 링크 , MT4 버전 - 링크 선행 값은 리스크 또는 거래량 중 하나일 수 있습니다. 패널의 레이블을 클릭하여 둘 사이를 전환할 수 있습니다. 리스크가 지정된 경우 거래량은 손절매선까지의 거리에 따라 계산됩니다. 선을 더 이동하면 로트 크기는 작아지지만 리스크 금액은 동일하게 유지됩니다. 거래량이 지정된 경우 패널에는 해당
FREE

This SMT (Smart Money Technique) divergence indicator identifies discrepancies in price movement between two different trading symbols, helping traders detect potential market reversals. This tool compares the price action of two correlated assets, such as two currency pairs or indices, to spot divergences where one asset's price moves in the opposite direction of the other. For example, while one symbol may be making higher highs, the other might be making lower highs, signaling a divergence. T
FREE

Grebenka - помощник для разметки графика.
Функционал: 1. позволяет непрерывно рисовать линии ZigZag в ручном режиме, используя клики мышкой. 2. позволяет включать режим, при котором любая трендовая линия с которой в данный момент проводится манипуляция, выравнивается по горизонтали.
Горячие клавиши: [Z] - включение/выключение режима рисования линий ZigZag вручную [X] - включение/выключение режима горизонтальной трендовой линии [C] - быстрая смена цвета линий ZigZag [Del] - стандартная клавиш
FREE

Top Line Chart is a powerful trading tool designed to provide clear and accurate market trend analysis. It helps traders identify price direction, momentum, and potential market opportunities. With an easy-to-understand chart interface, traders can quickly monitor changing market conditions. Top Line Chart is built to support smarter decisions through simple, focused, and effective visual analysis.
FREE

This expert advisor implements the original Dennis and Eckhardt trading system, commonly known as The Turtle Trader. It trades exactly like the original turtles did, and can be used by experienced traders to capture trends in up or down markets. [ Installation Guide | Update Guide | Troubleshooting | FAQ | All Products ] Easy to use and supervise Fully configurable strategy settings Fully configurable trading settings Works for ECN/Non-ECN brokers and 2-3-4-5 digit symbols Works for CFDs and for
FREE

Ultimate — The Complete Investment Castle EA
Ultimate is the all-in-one Investment Castle Expert Advisor: a full strategy toolbox in a single robot, with an on-chart dashboard, TP line and profit/loss labels. Pick from multiple built-in strategies and tune it to exactly how you want to trade.
What it does for you Many strategies in one: trade on indicator signals, opposite entries and more — your choice. On-chart dashboard: TP line and P/L labels keep you informed (they are off by default to s
FREE

Smart Stop Scanner – 실제 시장 구조 기반의 멀티자산 스톱로스 분석 시스템 개요
Smart Stop Scanner는 여러 시장에서 스톱로스 구조를 전문적으로 모니터링하기 위해 설계된 강력한 도구입니다. 실제 시장 구조, 핵심 브레이크아웃, 가격 행동 로직을 기반으로 가장 의미 있는 스톱 영역을 자동으로 감지하며, 고해상도(DPI 지원)의 깔끔하고 일관된 패널에 모든 정보를 표시합니다. 포렉스(FOREX), 금, 지수, 금속, 암호화폐 등 다양한 자산군을 지원합니다.
스톱 레벨 계산 방식
이 시스템은 기존의 인디케이터 공식을 사용하지 않습니다. 대신 브레이크아웃, 더 높은 고점, 더 낮은 저점 과 같은 실제 시장 구조 이벤트를 분석합니다. 스톱 레벨은 이러한 구조적 지점에서 직접 생성되므로 시장의 실제 움직임과 자연스럽게 일치하며, 더 신뢰도 높은 스톱 시스템을 제공합니다.
주요 기능 • 고정밀 멀티자산 호환성
포렉스, 금속, 금, 지수, 암호화폐 등 다양한

MA Lizard M5 - High Precision Gold XAUUSD M5 Momentum Scalping EA with MACD and RSI Alignment Overview MA Lizard M5 is an automated trading robot built on a MACD and RSI momentum scalping strategy for XAUUSD Gold on the M5 timeframe. It detects short term price acceleration and enters high probability trades with strict risk management. Key Features Zero Martingale Zero Grid Zero Averaging Down: Strictly limits open exposure to 1 position at a time, eliminating account blowout risks. Triple

**추측이 아니라, 책이 가르치는 방식대로 파동을 트레이딩하세요.**
이 지표는 가격 구조를 읽어 엘리엇 임펄스(1-2-3-4-5)와 조정(A-B-C)을 자동으로 라벨링 하고, 다음 파동이 향할 가능성이 높은 방향과 책이 제시하는 매매 지점을 보여줍니다. A.J. 프로스트와 로버트 프렉터의 『엘리엇 파동 원리 — 시장 행동의 열쇠』에 직접 기반하며 원전에 충실합니다. 네 가지 불가침 파동 규칙을 100% 적용하므로, 유효한 엘리엇이 아닌 카운트는 결코 그려지지 않습니다.
**차트에서 보이는 것** - **완성된 파동** — 완성된 임펄스 1-2-3-4-5(및 A-B-C 조정)를 깔끔한 라벨 선분으로 표시. - **다음에 예상되는 것** — 다음 파동의 투영선을 음영 처리된 **피보나치 목표 구간** 으로 그려, 가격이 “향해야 할” 방향을 항상 알 수 있습니다. - **책에 기반한 매매 셋업** — 매수/매도 **진입** , **손절** , 두 개의 **익절** 가격을

이 표시기는 거래자의 요구 사항에 따라 차트를 더 깔끔하게 만들기 위해 활성화/비활성화할 수 있는 최대 6개 레벨을 표시합니다.
이 6단계는 높음과 낮음의 2세트로 구성되어 있습니다.
각 세트에 대해 다른 시간대를 선택할 수 있습니다.
가격이 일일, 주간 또는 월간 고가에 도달할 때 일반적으로 5분과 같은 더 작은 시간 프레임에서 거부를 나타내는 것으로 간주되므로 이전 고가 반전 전략을 기반으로 합니다.
특징 :
- 단일 차트에서 최대 6개의 시간대 고저를 추적합니다.
- 이 수준, 메일, 푸시 또는 터미널 알림에 대한 알림을 설정합니다. 가격이 이러한 수준에 도달하면 즉시 알림을 받게 됩니다.
- 선 스타일, 너비, 색상 등을 포함한 레벨 스타일 사용자 정의
- Shift : 2일차 또는 3일차의 High Low를 추적하거나 조사하고 싶으십니까? 두 번째 막대의 높음 낮음에 대해 2로, 세 번째 막대의 높음 낮음에 대해 3으로 이동을 설정할 수 있습니다.
MetaTrader 5의 초 차트
지표를 사용하면 MetaTrader 5 터미널에서 초 단위의 기간으로 차트를 생성할 수 있습니다. 그러한 차트의 기간은 분이나 시간이 아닌 초 단위로 설정됩니다. 따라서 M1보다 짧은 기간으로 차트를 생성할 수 있습니다. 예를 들어, S15는 15초의 기간을 갖는 기간입니다. 결과 차트에 지표, 전문가 자문 및 스크립트를 적용할 수 있습니다.
일반 차트와 마찬가지로 작업할 수 있는 완전한 기능의 차트를 얻을 수 있습니다.
초 단위의 기간은 실시간뿐만 아니라 기존 틱 데이터베이스로 인해 기록에도 구축됩니다. 따라서 언제든지 기록이 이미 축적된 기간을 초 단위로 열 수 있습니다.
동시에 데이터는 지연 없이 기본 차트와 동시에 업데이트됩니다.
S1, S2, S3, S4, S5, S6, S10, S12, S15, S20, S30 등의 기간을 초 단위로 선택할 수 있습니다. 또한 원하는 값을 설정할 수도 있습니다.

Professional Renko Chart MT5 Professional Renko Chart MT5는 MetaTrader 5용 깔끔한 렌코 차트 지표로, 별도의 지표 창에 렌코 브릭을 표시하도록 설계되었습니다. 또한 선택적으로 메인 가격 차트 위에 렌코 박스를 직접 시각화할 수 있습니다. 이 지표는 MetaTrader 5 안에서 익숙한 렌코 차트 스타일을 사용하고 싶은 트레이더를 위해 제작되었습니다. TradingView와 같은 인기 있는 최신 차트 플랫폼에서 제공되는 렌코 차트 시각화와 유사한 방식으로, 일반적인 시간 기반 캔들을 렌코 브릭으로 변환하고 그 결과를 단순하고 명확하며 실용적인 형식으로 표시합니다. 여러 개의 일반 차트 캔들이 하나의 렌코 브릭을 만들 수 있습니다. Professional Renko Chart MT5는 메인 가격 차트 위에 렌코 박스를 표시할 수도 있으며, 각 렌코 브릭을 형성하는 데 사용된 일반 캔들의 개수도 보여줄 수 있습니다. 이 지표는 Exp

Reversal Pattern Signals V2 — Pin Bar & Engulfing with Automatic S/R Filter
Most pattern indicators flag pin bars and engulfing candles everywhere on the chart, and most of those signals are just noise.
Reversal Pattern Signals V2 only shows the signals that matter. The indicator automatically calculates support and resistance zones (based on fractals / recent swing highs-lows), and only displays a signal when a pin bar or engulfing forms exactly on one of these zones.
Features:
• Pin bar an
FREE

Accurate Buy Sell Pro System is a clean and reliable swing-based indicator designed to identify trend reversals and entry zones with high precision. The algorithm follows the original “Accurate Swing Trading System” concept from TradingView (by ceyhun) and has been fully re-engineered for MetaTrader 5. 1:1 match with TradingView behavior
Works on all symbols and timeframes
Clean non-repainting signals when used after candle close
Visual BUY/SELL arrows + colored dynamic trendline
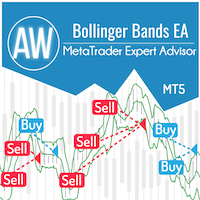
표준 볼린저 밴드 표시기의 신호를 기반으로 하는 완전 자동화된 거래 로봇. EA에는 자동 로트 계산 기능과 지능형 추적 시스템이 내장되어 있습니다. 시장이 반대 방향으로 움직일 때 보류 중인 주문의 평균 시스템이 적용됩니다. MT4 version -> HERE 장점:
완전 자동화 시스템 사용자 정의 가능한 지표 매개변수 자동 로트 계산 내장 직관적인 설정 승수 설정 내장형 후행 시스템 전략:
표시기의 주요 아이디어는 평균선에서 급격한 편차를 감지하는 것이며 반환 순간에 표시기는 평균값으로 돌아가라는 신호를 줄 것입니다. 표시기는 세 줄로 표시됩니다. 중간 선은 이동 평균입니다. 상단 및 하단 라인은 특정 수의 편차(예: 2)만큼 이동한 중간 라인이며, 편차의 크기는 변동성에 의해 규제됩니다. 밴드의 너비는 변동성에 따라 조정되며 가장 안정적인 기간 동안 너비가 감소합니다. 볼린저 밴드는 95%가 있어야 하는 회랑을 만듭니다. 가격과 5%만이 그 이상 권장 기간은
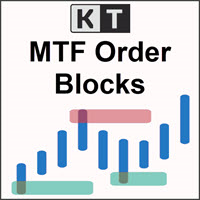
KT MTF Order Blocks는 현재 차트 주기와 추가로 선택한 최대 두 개의 주기에서 강세 및 약세 오더 블록 영역을 하나의 차트에 자동으로 표시합니다. 차트를 계속 전환하지 않아도 서로 다른 주기의 영역이 현재 가격과 어떤 위치 관계에 있는지 확인할 수 있습니다. 각 영역은 색상 구간으로 표시되고 원래 주기가 라벨로 나타납니다. 가까운 하위 주기 영역과 범위가 더 넓은 상위 주기 영역을 쉽게 구분할 수 있습니다. 차트의 영역 읽기 지표는 오더 블록 감지 조건이 충족된 영역을 표시합니다. 가격이 다시 돌아오면 평소 사용하는 확인 방법과 함께 반응, 연속 움직임 또는 돌파를 관찰할 수 있는 명확한 범위가 됩니다. 강세 오더 블록 은 가격 아래 또는 주변의 수요 영역으로 표시됩니다. 약세 오더 블록 은 가격 위 또는 주변의 공급 영역으로 표시됩니다. 선택 가능한 50% 선 은 각 영역의 중간 지점을 표시하고 라벨은 해당 주기를 보여 줍니다. 영역 색상, 라벨 및 중간선은 차트에

News Stopper MT5는 MetaTrader 5 전용으로 설계된 전문 유틸리티로, 중요한 뉴스 이벤트 전에 자동으로 거래를 종료하여 귀하의 거래를 보호하는 것을 목표로 합니다. 이 도구는 수동 거래자와 자동 거래 시스템 모두에 적합하며, 뉴스 발표로 인한 시장 변동성 동안 귀하의 포트폴리오를 안전하게 유지합니다. News Stopper MT5를 사용하면 경제 이벤트에 사전 대응하여 거래를 효과적으로 관리하고, 갑작스러운 시장 변동에 대비하여 자본을 보호할 수 있습니다. 귀하의 거래 전략에 맞춘 다양한 설정을 구성함으로써, 중요한 거래 순간 동안 위험을 최소화하면서 의사 결정 과정을 향상시킬 수 있습니다. MQL 제품 설치 가이드 | 구매한 MQL 제품 업데이트(MT4/MT5) | 일반 문제 해결 가이드 | 지표 설정 / 가이드 주요 기능 팝업 알림: 신호 이벤트에서 MetaTrader 알림 팝업을 발생시켜 거래 설정을 놓치지 않도록 합니다. 푸시 알림: 이동 중 모니터링을 위
Main: Not martingale, not a grid, working on all symbols; a good rational algorithm; Work of two indicators: RSI (from older timeframe - it works as a signal filter) and RSI (from junior timeframe - it works as a signal) ; There is a good money management system (there are several type for trailing stop loss); EA can work on closed candles, and on current candles; Quickly optimized (the work is maximally accelerated). Current sets after optimization are in comments.
If you want to do optimizati

Product Overview TD Sequential Pro is a TD Sequential main chart indicator designed specifically for both MT4 and MT5 platforms, deeply developed based on the classic Tom DeMark Sequential theory. By statistically analyzing the comparison relationship between 9 consecutive bars' closing prices and their 4 preceding bars, this indicator precisely identifies market momentum exhaustion points. It helps traders capture high-probability reversal opportunities at trend ends, while providing compr
FREE

This indicator plots the volume profile by Price on the chart
There are 5 ways to view it:
By Total Volume Traded (Premium Version); Volume Ticks(Forex) Separated by Buyers and Sellers (Premium Version); Buyers Only (Premium Version); Sellers Only (Premium Version); Business balance (Buyers - Sellers) (Premium Version); .
It is possible to select how many days the profiles will be calculated.( Premium Version)
On the current day it recalculates the histogram data for each new candlestick.
FREE
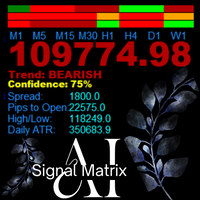
AanIsnaini Signal Matrix MT5 Multi-Timeframe Confidence Signal Dashboard The Free Version of AanIsnaini Signal Matrix MT5 Pro AanIsnaini Signal Matrix MT5 is a powerful all-in-one indicator that analyzes market direction and confidence levels across multiple timeframes — allowing traders to see the overall bias of the market at a single glance. It combines signals from Price Action , Support–Resistance , and several proven technical tools (MACD, ADX, RSI, MA slope, ATR, and Volume Ratio), then
FREE

Overview The SMC indicator is a versatile tool that helps traders automate chart analysis using price action. Its main goal is to identify where large institutions place orders (liquidity) to find optimal entry/exit points.
Core Features Market Structure: Automatically labels BOS (Breakout Structure) and CHoCH (Change of Character) in real time for both internal and main swing waves.
Supply & Demand Zones: Identifies bullish and bearish Order Blocks.
Liquidity & Price Gaps: Identifies equal
FREE

MTF Moving Average Pro — 멀티 타임프레임 이동평균선 대시보드 차트를 전환할 필요 없이 모든 타임프레임의 트렌드를 한눈에 파악하세요. MTF Moving Average Pro는 M1부터 W1까지 최대 8개의 타임프레임 이동평균선(MA)을 현재 차트에 동시에 표시하며, 깔끔하고 상호작용이 가능한 대시보드를 제공합니다. 차트를 일일이 전환하거나 창을 여러 개 열 필요 없이, 단기·중기·장기 트렌드가 일치하는지 즉시 확인할 수 있습니다. M1/M5 스캘핑부터 H4/D1 스윙 트레이딩까지, 혹은 단순히 진입을 위한 빠른 멀티 타임프레임 트렌드 필터가 필요한 경우, 이 지표 하나로 8개의 차트를 동시에 보고 있는 것과 같은 완벽한 통찰력을 제공합니다. 멀티 타임프레임 분석이 중요한 이유 경험 많은 트레이더들은 상위 타임프레임의 트렌드 방향으로 매매하는 것이 훨씬 높은 확률을 제공한다는 점에 동의합니다. 기존의 방식은 하나의 종목을 분석하기 위해 8개의 차트를 계속 전환해야
FREE
Linear Regression Trending indicator analyzes price trends by plotting a linear regression channel based on user-defined parameters such as source (for example, close prices), channel length, and deviation multiplier.
How It Works: - The indicator calculates a linear regression line over the specified length, forming a channel with upper and lower boundaries offset by the deviation value. - It detects price breaks from the channel and optionally displays broken channel lines (in a customizable
FREE

SmartCoon EA - Advanced RSI Grid Trading System with News Filter Visit our site to join our telegram channel and discover other set files!
Description :
SmartCoon Grid EA is a sophisticated automated trading system that combines RSI-based entry signals with a dynamic grid strategy. The EA features an advanced news filter and flexible lot sizing options to help manage risk effectively.
Usage Recommendations: Pairs EURUSD Timeframe M5 Account type Raw or Standard Minimum capital 100$ Minim
FREE

GoldTrendCorrectionRunner는 XAUUSD 거래를 위한 자동화된 전문가 자문 프로그램으로, 구조화된 추세 및 추동 단계만을 거래합니다.
이 EA는 조정 기반 접근 방식을 따릅니다:
진행 중인 움직임에 바로 진입하기보다는, 시스템은 시장 조정을 기다린 후 추세 지속이 확인된 후에야 포지션을 개설합니다. 이를 통해 과도하게 확장된 시장 단계에서 흔히 발생하는 진입 오류를 방지합니다.
거래 논리
더 높은 시간대의 EMA 구조를 통한 추세 편향
ADX 필터를 통한 최소 추세 강도
M15 조정 및 추세 방향 재돌파 후 진입
뉴 바 로직 (틱 기반 진입 없음)
스탑로스 & 리스크
스탑로스는 가장 강한 M15 조정점(스윙 하이/스윙 로우)에 배치
고정 포인트 SL이 아닌 시장 기반
거래당 USD 기준 엄격한 손실 제한
→ 스탑 로스에서 최대 손실을 초과하지 않도록 랏 크기를 계산
→ 최소 랏 크기로 인해 불가능할 경우 거래를 시작하지 않음
거래 관리
러너
FREE

## Описание
Индикатор SSL Hybrid является точной реализацией одноименного индикатора с платформы TradingView (автор: Mihkel00). Адаптирован для MetaTrader 5.
Индикатор относится к классу трендовых и предназначен для следования за ценой. Он объединяет в себе три уровня сигнальных линий SSL (Semaphore Signal Level), что позволяет не только определить направление тренда, но и находить точки входа, продолжения и выхода.
### Основное назначение
- Торговля по тренду на дневных и 4-часовых графика
FREE

Volume Bubble Pro 는 MetaTrader 5를 위한 고급 시각화 도구로, 거래량을 가격 차트에 직접 표시합니다. 화면 하단의 별도 히스토그램에 의존하는 대신, 이 지표는 동적 원(버블)을 통해 해당 캔들의 거래량 강도를 직접 보여줍니다. 왜 Volume Bubble Pro인가요? 표준 거래량 표시는 단순히 절대적인 수치만 보여주기 때문에 문맥이 결여되는 경우가 많습니다. Volume Bubble Pro는 현재 거래량을 이전 기간의 평균과 통계적으로 비교합니다. 이를 통해 트레이더는 거래량 급증이 유의미한 시장 참여를 나타내는지, 아니면 단순한 일반 노이즈인지 즉시 파악할 수 있습니다. 주요 특징: 지능형 배치 시스템: 가독성을 극대화하기 위해 매수 신호(녹색)는 캔들 아래에, 매도 신호(빨간색)는 캔들 위에 배치됩니다. 이는 현재 가격 움직임이 가려지는 것을 방지합니다. 앵커 시각화: 각 버블은 가는 선(앵커)을 통해 해당 캔들에 단단히 연결됩니다. 따라서 급격한 시장

Smart Market Flow Detector (SMFD) v4.0 — Professional Edition Four Algorithms. One Signal. Zero Repainting. Smart Market Flow Detector combines four analytical engines into a single indicator that identifies institutional order flow patterns across all timeframes. Every signal is generated on closed bars only — what you see in back-testing is what you get live. What It Does SMFD scores every bar on two axes: Smart Money Flow (institutional accumulation/distribution) and Dumb Money Flow (retail
FREE
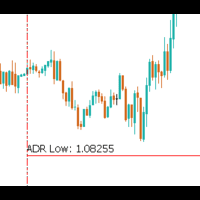
The Average Daily Range (ADR) is a powerful tool for traders, especially those focused on intraday and scalping strategies. It provides valuable insights into the expected price movement for the day and how price action is behaving relative to historical trends. The ADR indicator shows the following key information: Today's ADR : The typical range of price movement for the current trading day, based on historical data. 3x Today's ADR : Three times the current ADR, showing potential price moveme
FREE

This is an MQL5 custom indicator for MetaTrader 5 called "Swing Highs and Lows Detector"
What it does
The indicator identifies and labels **market structure swing points** on a price chart:
HH (Higher High) – A new swing high that's higher than the previous swing high (bullish signal, colored lime green) HL (Higher Low) – A new swing low that's higher than the previous swing low (bullish signal, colored lime green) LH (Lower High) – A new swing high that's lower than the previous swing hig
FREE
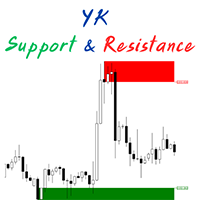
The " YK Find Support And Resistance " indicator is a technical analysis tool used to identify key support and resistance levels on a price chart. Its features and functions are as follows:
1. Displays support and resistance levels using arrow lines and colored bands, with resistance in red and support in green.
2. Can be adjusted to calculate and display results from a specified timeframe using the forced_tf variable. If set to 0, it will use the current timeframe of the chart.
3. Uses th
FREE

This EA is specifically designed for trading USOil on brokers that offer a positive long swap , providing an advantage for both trading and long-term investment. The recommended minimum capital is $1,000–$1,500 (Available for Cent Account Also). However, before using the EA, it is important to review your broker’s USOil contract size in order to set an appropriate lot size.
For example, if the contract size is 1,000 , the user should consider setting a lot size of 0.01 . The re
FREE

GoldStorm Pro는 골드 시장(XAUUSD)의 독특한 변동성을 다루기 위해 특별히 설계된 전문가급 자동 매매 솔루션입니다. 계좌를 무제한 위험에 노출시키는 표준 그리드(Grid) 또는 마틴게일 시스템과 달리, GoldStorm Pro는 정교한 "프랙탈 브레이크아웃(Fractal Breakout)" 엔진과 추세 추종 아키텍처를 결합하여 H1 타임프레임에서 높은 확률의 진입 시점을 식별합니다.
v1.30 버전의 핵심 철학은 "정밀함을 통한 안전(Safety through Precision)"입니다. 50 기간 이동 평균(Moving Average) 추세 필터를 통합함으로써, EA는 시장의 지배적인 모멘텀과 일치할 때만 거래를 실행하도록 보장합니다. 이는 역추세 매매나 "떨어지는 칼날 잡기(catching falling knives)"와 같은 위험한 진입 확률을 크게 줄여줍니다.
### 운영 로직 및 전략 분석 GoldStorm Pro는 단일 진입 방법에 의존하지 않습니다.

One SuperTrend, tuned for patience. Nothing to configure. GTI Buy/Sell marks the bar where the dominant trend turns — and stays quiet the rest of the time. No parameters, no dashboard, no second-guessing. Attach it and read it. What it does A single SuperTrend band built on a 100-period Wilder ATR at 3× width, tracking the median price. That band is deliberately wide. Price has to do something structural to break it, so the indicator ignores the noise that shakes out faster settings. When it fin
FREE

지표는 차트에 중요한 기술 수준을 표시합니다. 이 수준은 가격 움직임에 대한 지지 또는 저항 역할을 합니다.
가장 중요한 수준은 100 점과 50 점의 배수입니다. 25포인트의 배수로 레벨을 표시할 수도 있습니다.
가격이 수준에 도달하면 경고 또는 푸시 알림이 표시됩니다.
MT4용 버전 https://www.mql5.com/ko/market/product/69486 설정 Show Levels 100 pips - 100핍의 배수로 레벨 표시 Show Levels 50 pips - 50핍의 배수로 레벨 표시 Show Levels 25 pips - 25핍의 배수로 레벨 표시 Color Levels 100 pips - 100핍으로 나눌 수 있는 수준의 선 색상 Color Levels 50 pips - 50핍으로 나눌 수 있는 수준의 선 색상 Color Levels 25 pips - 25핍으로 나눌 수 있는 레벨의 선 색상 Send Alert - 알림 보내기 Send Push - 푸시
FREE

Calmer chart context, kept practical Northstar Flow Candles MT5 is a chart-window indicator that presents Heikin Ashi candles with a five-state trend context. It is designed for traders who want a quieter view of price while keeping the native chart available as an optional reference. Visual-only indicator: Northstar Flow Candles MT5 does not place trades and does not send popup, push, or email notifications. What appears on the chart Five candle states: strong bullish, bullish, balanced, bearis
FREE

"Inside Bar PA" is a technical indicator for the MetaTrader 5 platform, designed to automatically detect the Inside Bar pattern on the chart. An Inside Bar is a candle whose high and low are completely within the range of the previous candle (mother bar). This pattern often signals market consolidation and can precede a strong price movement.
Features:
• Automatic detection of all Inside Bars on the chart • Visual marking with arrows: green up arrow for bullish Inside Bars (close >= open), gr
FREE

The Linear Regression Channel is a powerful technical analysis tool that helps visually identify the prevailing trend and potential price zones. Essentially, the indicator performs two main functions: It draws a trendline through the center of price action over a specified period. This line is calculated using the linear regression method, which results in the best possible "line of best fit" for the price data. From this center line, the indicator plots two parallel lines above and below, creat
FREE

The jcoworld OTE EA is an automated trading bot for MetaTrader 5 built on Smart Money Concepts (SMC) . It accurately identifies market impulse moves and automatically enters trades within the Optimal Trade Entry (OTE) zone (61.8% – 79.0% Fibonacci) as soon as a confirmation candle closes. Optimized for: XAUEUR, XAUUSD, and Major Forex Pairs Features: Automatic risk management, dynamic lot sizing & automated Stop Loss/Take Profit. Try for free: This demo version is 100% free! Pricing Plans for Fu
FREE

VIX GOLDEN BREAKOUT EA Built with Vix Algo Builder, the free automated Expert Advisor builder created by a team of developers from Vix Algo Trading, this EA has proved to be the ultimate range breakout EA for XAUUSD. This EA is free because it was builtfor FREE but it is a high grade perfomance EA.
CLICK HERE TO VIEW SIGNAL
This Range breaout Expert advisor uses a Stop Order based range breakout coupled with a High Timeframe Filter (H4 EMA 50). The EA places stop orders in the direction of
FREE

Short description
USDJPY grid EA with EMA trend filter and adjustable risk settings. Overview
This Expert Advisor runs on USDJPY (H1) and uses a grid-based structure with optional EMA trend filtering. It opens trades based on price action relative to the EMA and adds entries at fixed pip distances. The system exits all trades when a cumulative target is reached. Risk tools include max grid depth, hard stop-loss, ATR-based stop, and trailing. Designed for careful testing and adjustment. No DLL
FREE

Sentinel is a multi-symbol price action Expert Advisor. It follows one idea shared by classic trading books: careful risk management protects the account, not a single entry signal. Sentinel automates a price action workflow and applies consistent risk control on every trade. It is a tool for disciplined execution. How it trades It opens trades only in the direction of the higher timeframe trend, at support and resistance or at a Fibonacci pull-back area, and confirms them with candlestick patt
FREE

Here our more valuable tools
SMC Trend Trading , Easy SMC Trading , Institutional SMC Architect Volume Analysis Tools , Volume flow Profile , Market volume profile , FVG with Volume , Liquidity Heatmap Profile , Volume Spread Analysis
A professional spike pattern indicator built for synthetic traders who scalp and swing Crash 500/300/1000 with precision.
This indicator: Detects powerful 3-candle spike formations (Spike → Pullback → Spike) Automatically draws a clean box a
FREE

The Period separators indicator separates time periods, specified by user.
It supports all timeframes, greater or aliquot to current timeframe. In case of the incorect timeframe, the indicator modifies it to closest correct value. Additional bonus - the separation of non-standard time periods - MOON, MOON/2, MOON/4 (moon phases). The separators are plotted using the indicator's buffers. The indicator uses one graphic object for information about the progress and current bar properties. The graph
FREE
Layer Master: Professional Grid Trading Tool for MT5 Transform your grid trading with Layer Master - the most intuitive and powerful order management toolkit designed specifically for professional traders. MT4 Version: https://www.mql5.com/en/market/product/79133
FREE - 7 Day Trial Version available. Please contact me to get your Free trial! Master Grid Trading with Precision
Layer Master revolutionizes how you place and manage grid trades. With our visual interface, you can: Deploy hun

Introduction to Harmonic Pattern Scenario Planner
The present state of Forex market can go through many different possible price paths to reach its future destination. Future is dynamic. Therefore, planning your trade with possible future scenario is an important step for your success. To meet such a powerful concept, we introduce the Harmonic Pattern Scenario Planner, the first predictive Harmonic Pattern Tool in the world among its kind.
Main Features Predicting future patterns for scenario

The strategy is based on the Alligator technical indicator, described by Bill Williams in "Trading Chaos".
The system is based on three moving averages (Lips, Teeth and Jaw lines), and oscillators, calculated using the difference between them. The trading signals are generated after crossover of the Alligator lines, depending on trend, determined by order of these lines. In the case of upward trend the Lips line (with minimal period) is the highest, the next is the Teeth line, and the lowest is
FREE

Point Directions MT5 – 가격 변동 중 포인트 지지선과 저항선을 표시하는 지표입니다. 화살표는 지정된 방향으로 가격이 반등할 때를 나타냅니다.
화살표는 다시 그려지지 않으며 현재 캔들을 기준으로 형성됩니다. 모든 시간대와 거래 상품에서 작동합니다. 여러 유형의 알림을 사용할 수 있습니다.
모든 차트에 대한 신호를 사용자 정의할 수 있는 고급 설정이 있으며, 추세 및 조정 거래에 맞게 구성할 수 있습니다.
화살표를 표시하려면 두 가지 유형의 이동 평균선과 화살표 강도 수준을 사용할 수 있습니다. 자세한 설정은 입력 매개변수에 설명되어 있습니다.
사용 관련 문의는 비공개 메시지를 보내주세요.
입력 매개변수
Method MA – 화살표 생성에 이동 평균을 사용할지 선택합니다(표준 또는 가속). Accelerated MA period/Standard MA period – 이동 평균 기간(5~500)을 변경합니다. Ma Metod – 이동 평균 방식을 변경합니다. Ma

Pulsar Terminal 은 Astralys LLC 의 상표인 Pulsar Technologies 의 제품입니다.
Pulsar Terminal은 MetaTrader 5용 유틸리티 애드온입니다. Expert Advisor 를 통해 MetaTrader 5 계정에 연결되는 동반 애플리케이션 내에서 실행 도구와 결합된 비주얼 인터페이스 입니다. 표준 MT5 패널보다 더 고급 비주얼 인터페이스와 워크플로우를 제공하기 위해 동반 애플리케이션을 사용하여 도구의 기능을 극대화합니다. Pulsar Terminal은 독립형 애플리케이션이 아니며 작동하려면 MetaTrader 5가 필요합니다. EA는 Pulsar Terminal 동반 애플리케이션과 localhost를 통해서만 통신합니다. 동반 애플리케이션 설치 프로그램은 설치 가이드(MQL5 블로그 게시물)를 통해 구매자에게 제공됩니다.
인터페이스를 통해 주문 실행, 리스크 관리, 거래 통계 확인, 그리고 MetaTrader 5에 연결된 동반
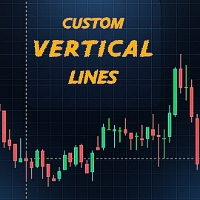
이 지표는 하루 중 원하는 시간에 자동으로 세로선을 그리며, 선택적으로 해당 시점의 시가를 기준으로 가로선을 추가할 수 있습니다. 트레이더가 시장 세션, 전략별 시간 또는 일일 주요 구간을 표시하는 데 유용합니다. 특징: 하루에 최대 2개의 사용자 지정 가능한 세로선 을 표시. 선택한 시간의 시가에서 가로선을 추가 할 수 있는 옵션. 선의 색상, 스타일 및 두께 완전 사용자 지정 가능. 가볍고 빠르며 차트를 느리게 하지 않음. 모든 심볼 및 타임프레임 에서 작동. 세로선 1개만 원한다면 , 두 번째 시간 입력을 비워 두세요. 아예 선을 보고 싶지 않다면 , 두 입력을 모두 비워 두세요. 사용 방법: 지표를 차트에 추가하세요. 입력 설정에서 원하는 시간을 설정하세요 (예: 07:00, 14:30). 선의 스타일, 색상, 두께를 조정하세요. 선택적으로 어떤 시간이 가로선을 생성할지 결정하세요. 선을 줄이거나 표시하지 않으려면 입력을 비워 두세요. 이 도구는 거래 세션, 전략 또는 일일
FREE
MetaTrader 마켓은 거래 로봇과 기술 지표들의 독특한 스토어입니다.
MQL5.community 사용자 메모를 읽어보셔서 트레이더들에게 제공하는 고유한 서비스(거래 시그널 복사, 프리랜서가 개발한 맞춤형 애플리케이션, 결제 시스템 및 MQL5 클라우드 네트워크를 통한 자동 결제)에 대해 자세히 알아보십시오.
