 MetaTrader 5
 Uzmanlar
 Göstergeler
 Kütüphaneler
 Yardımcı programlar
 Widget'lar
 Kurallar
YouTube'dan Mağaza ile ilgili öğretici videoları izleyin
Bir alım-satım robotu veya gösterge nasıl satın alınır?
Uzman Danışmanınızı
sanal sunucuda çalıştırın
sanal sunucuda çalıştırın
Satın almadan önce göstergeyi/alım-satım robotunu test edin
Mağazada kazanç sağlamak ister misiniz?
Satış için bir ürün nasıl sunulur?
MetaTrader 4 için Uzman Danışmanlar ve Göstergeler - 86
 Alım-satım robotları piyasalarda otomatik olarak işlem yapar, göstergeler ise fiyatları analiz etmek ve fiyat değişikliklerindeki kalıpları belirlemek için kullanılır.
Bu alım-satım uygulamalarıyla, MetaTrader 4'te daha bilinçli alım-satım işlemleri gerçekleştirecek ve daha fazla alım-satım fırsatı yakalayacaksınız.

FOREXTROIDS USES THE TREND WAVE INDICATOR AND IT CAN IDENTIFY THE BEGINNING AND THE END OF A NEW WAVE TREND MOVEMENT.
AS AN OSCILLATOR, THE INDICATOR IDENTIFIES THE OVERBOUGHT AND OVERSOLD ZONES.
IT WORKS GREAT TO CATCH THE SHORT TERM PRICE REVERSALS AND USES A MARTINGALE STRATEGY TO CLOSE ALL TRADES IN PROFIT.
USE DEFAULT SETTINGS ON H1 OR HIGHER TIME FRAME ON ANY PAIR FOR MORE ACCURATE TRADES
WHY THIS EA :
Smart entries calculated by 4 great strategies The EA can be run on even a $20000
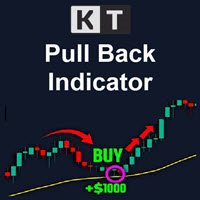
KT Pull Back Arrows, RSI (Göreceli Güç Endeksi) kullanarak aşırı alım ve aşırı satım bölgeleri içindeki uygun geri çekilme giriş alanlarını belirler ve oklarla gösterir. Bu gösterge, RSI eşiklerini kullanarak geri çekilme işlemleri için uygun zamanları etkili bir şekilde tespit eder. Trend takibi, Forex piyasasında genellikle en kârlı strateji olarak kabul edilir. Bu, dalgayı yakalamak, akıntıya karşı gitmek yerine onunla birlikte gitmek ve piyasa ivmesini kendi lehine kullanmak anlamına gelir.

Introducing Emerald Dragon: Your Gateway to Trading Success Are you tired of navigating the treacherous waters of the forex markets, always on the lookout for opportunities? The trading world can be relentless, leaving you yearning for a reliable companion. Look no further. Allow me to introduce you to Emerald Dragon, a formidable trading algorithm designed to extinguish your trading woes and ignite your success. Emerald Dragon is not just another algorithm; it's your trusty partner in the dyna

Graph's roller-coaster
MT Roller Coaster :
Inspired by the graph's roller-coaster-like movement, this tool uses color bands to signal trends effectively.
The band colors simplify order decisions:
Downtrend: Bands 2 and 3 turn red, signaling sell opportunities.
Uptrend: Bands 2 and 3 appear sky blue, suggesting buy orders.
Sideways: Alternating band colors allow both buy and sell trades, suitable for scalping strategies.
Major trend entries are identified at the outer bands, with corr
KT Momentum Histogram, bir varlığın momentumu hakkında görsel bilgi sunarak trendin gücü ve olası yönü konusunda yatırımcılara yardımcı olur. Gösterge, piyasa momentumu temelinde hesaplanır ve çalışır.
Momentum Histogram nedir
Momentum, bir varlığın fiyatının veya hacminin ivme hızıdır; fiyatın belirli bir sürede ne kadar hızlı hareket ettiğini ölçer. Pozitif momentum fiyat artışını, negatif momentum fiyat düşüşünü işaret eder. Momentum histogramı, sıfır çizgisi etrafında salınan dikey çubukla

The KT Buy Sell Volume is a powerful tool traders use to gauge the strength and weakness of price movements. In the whirlwind of the Forex market, traders aim to identify and ride the waves of a bullish or bearish trend that exudes strength and potential. However, recognizing these trends necessitates a method, metric, or indicator to quantify their strength. One crucial factor that traders examine for this purpose is volume. Volume refers to the number of shares or contracts traded in a securit

VANGLUTIO USES THE TREND WAVE INDICATOR AND IT CAN IDENTIFY THE BEGINNING AND THE END OF A NEW WAVE TREND MOVEMENT.
AS AN OSCILLATOR, THE INDICATOR IDENTIFIES THE OVERBOUGHT AND OVERSOLD ZONES.
IT WORKS GREAT TO CATCH THE SHORT TERM PRICE REVERSALS AND USES A MARTINGALE STRATEGY TO CLOSE ALL TRADES IN PROFIT.
USE DEFAULT SETTINGS ON H1 OR HIGHER TIME FRAME ON ANY PAIR FOR MORE ACCURATE TRADES
WHY THIS EA :
Smart entries calculated by 5 great strategies The EA can be run on even a $20000 ac

Attraverso l'indicatore Savius Zone potrai finalmente: Definire delle zone oggettive da attenzionare Ridurre la discrezionalità Filtrare i tuoi pattern operativi Avvalerti di un metodo comprovato Qui di seguito alcune funzioni dell'indicatore Savius Zone: Zone Buy & Sell L’indicatore fornisce delle zone buy e sell ogni giorno dopo l’apertura del mercato cash sui seguenti mercati: DAX, S&P500, Nasdaq, Russel2000, Dow Jones
Occasioni giornaliere Savius Zone fornisce occasioni di trading tutti i

DISCLAIMER : THIS EXPERT ADVISOR IS BUILT DEPEND ON NEW AND ADVANCE PRICEACTION. DONT BACK TEST IT IN THE TIME PERIOD BEFORE 2021 . Introducing our MT4 EA:
Designed with advanced algorithms and utilizing deep learning technology, our Expert Advisor (EA) is crafted to assist you in the intricate world of forex trading. The system analyzes market behaviors and conducts transactions based on specific criteria, empowering you to engage with market trends more effectively. With the backing of
"Sinyal histogram ölçekleyici" göstergesi, yeniden çizim veya gecikme olmadan histogram ve sinyaller biçiminde genel bir göstergedir. "Sinyal histogramı ölçekleyici" göstergesi, grafikte trend boyunca en iyi giriş noktalarını gösterir. Filtre olarak diğer trend göstergeleriyle birlikte kullanılması daha iyidir. Gösterge, M5 zaman diliminde iyi sonuçlar verir. Sinyal, mum kapandıktan sonra üretilir ve yeşil ve kırmızı daireler şeklinde görünür. "Sinyal histogram ölçekleyici" göstergesi, saf haliy

VANDORA FX USES THE TREND WAVE INDICATOR AND IT CAN IDENTIFY THE BEGINNING AND THE END OF A NEW WAVE TREND MOVEMENT.
AS AN OSCILLATOR, THE INDICATOR IDENTIFIES THE OVERBOUGHT AND OVERSOLD ZONES.
IT WORKS GREAT TO CATCH THE SHORT TERM PRICE REVERSALS AND USES A MARTINGALE STRATEGY TO CLOSE ALL TRADES IN PROFIT.
USE DEFAULT SETTINGS ON H1 OR HIGHER TIME FRAME ON ANY PAIR FOR MORE ACCURATE TRADES
WHY THIS EA :
Smart entries calculated by 5 great strategies The EA can be run on even a $20000 a

Introducing our MT5 EA: Designed with advanced algorithms and utilizing deep learning technology, our Expert Advisor (EA) is crafted to assist you in the intricate world of forex trading. The system analyzes market behaviors and conducts transactions based on specific criteria, empowering you to engage with market trends more effectively. With the backing of nearly a decade of data, the EA employs deep learning to examine past market conditions, aiming to provide enhanced decision-making. Recom

In the ever-evolving world of Forex trading, understanding the different trading sessions is paramount to making informed trading decisions. Each trading session brings its own unique characteristics, opportunities, and challenges, and recognizing these can greatly enhance your trading strategies. Whether you're a novice or a seasoned trader, the Forex market's three main trading sessions – Asian, London, and New York – are crucial milestones that dictate market behavior and potential trade set

GOLD /USD (XAU/USD) Travel 22 EA is a Result of 5 Years of (Experience, Testing and Developing). Also This EA Based on Special Coding Algorithm of Take Profit and Treating Trades. Combine of a Custom Indicators is used to Take Trades at Strong Points Only. Trading is With Trend and Only Safe Positions.
Currency pair : GOLD/USD (XAU/USD) H1 OR M1 Timeframe
If you want a few but guaranteed deals use H1 Timeframe.
If you want more deals during the day use M1 Timeframe.
If you see unsat

The Trends Trg indicator determines the prevailing trend. They help to analyze the market at the selected time interval. Easy to set up and works on all pairs and all time frames. Trend indicators make it possible to classify the direction of price movement by determining its strength. Solving this problem helps investors enter the market on time and get a good return.
It is extremely important for any trader to correctly determine the direction and strength of the trend movement. Unfortunatel

The Cyber Trend indicator analyzes the price action and if there is a temporary weakness in the trend, you can notice it from the indicator readings, as in the case of a pronounced change in trend direction. Entering the market is not difficult, but staying in it is much more difficult. Keeping up with the trend will become much easier with the Cyber Trend indicator! This indicator allows you to analyze historical data and, based on them, display instructions to the trader for further actions.
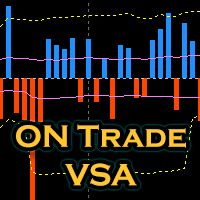
Tanıtıyoruz: "ON Trade VSA" - Hacim ve Dağılım Analizi için Ultimate Araç! Gücünü, hacim ve dağılım analizinin (VSA) öncü göstergesi "ON Trade VSA" ile keşfedin. VSA, piyasa gücünü değerlendirmek, trendleri tanımlamak ve bilinçli kararlar almak için trader'lar tarafından kullanılan güçlü bir metodolojidir. Şimdi "ON Trade VSA"yı, ticaret cephaneliğinizde vazgeçilmez bir araç haline getiren temel özelliklere göz atalım: Çok Renkli Hacim Mumları : Ortalama harekete dayalı olarak farklı renkler ata
This indicator will give you entries as result of scalping strategy that will be applied on 14 symbols in same time and you are able to be notified with this entries
Note : This indicator for scalping on 5 minutes timeframe only .
How to use it :
1-Open chart and adjust settings (edit symbols names as your platform names , activate the alert system if you need it . 2-Wait for any signal you have it from this scanner you will have it as alert and as notification and you will see it on board
Introducing the ON Trade Melad Pattern Indicator: Enhance Your Trading Strategy with Breakout Patterns
Discover the power of the ON Trade Melad Pattern Indicator—an intuitive tool designed to elevate your trading decisions by detecting and highlighting breakout patterns on your charts. This indicator is your key to identifying crucial breakout points and potential trend shifts with simplicity and precision.
Key Features:
Breakout Pattern Detection: The ON Trade Melad Pattern Indicator focuse

Hikkake Japon Şamdan Deseni, grafikte oluşan Hikkake Fiyat Hareket Desenlerini belirlemek ve tespit etmek üzere tasarlanmış özel bir göstergedir. Bu desenler, genellikle potansiyel ticaret fırsatlarına yol açan bir iç çubukta sahte bir dışarı çıkma kavramına dayanır. Göstergenin temel işlevi, grafiğin son beş şamdanını analiz etmek ve bu şamdanların Hikkake deseninin özelliklerini sergileyip sergilemediğini belirlemektir. Bu desen onaylandığında, gösterge deseni oluşturan şamdanların etrafına bi

Güçlü Fiyat Hareketi Desenlerini Algılayan Teknik Gösterge: Pin Bar, Inside Bar ve Outside Bar Giriş: Teknik analizin alanında, fiyat hareketi desenleri potansiyel piyasa hareketlerinin önemli göstergeleri olarak işlev görür. Grafiklerde sağlam fiyat hareketi desenlerini tanımlamanın kolaylaştırıldığı sofistike bir teknik gösterge geliştirdik. Göstergemiz, üç temel deseni tanıma konusunda uzmanlaşmıştır: Pin Bar, Inside Bar ve Outside Bar. Ana Desenlerin Algılanması: Pin Bar: Pin Bar deseni, piy
Shepherd Numeroloji Seviye Göstergesi ile ticarette devrim yaratan bir yaklaşımı keşfedin. Bu yenilikçi araç, geleneksel ticaret tekniklerini antik numeroloji bilgisiyle birleştirerek grafiklerinizdeki önemli destek ve direnç seviyelerini belirlemenize yardımcı olur. Dokuzun karesi yöntemini kullanarak bu gösterge, piyasa mekanizmalarına farklı bir bakış açısı sunar ve daha bilinçli ticaret kararları almanıza olanak tanır. Ana Özellikler ve Avantajlar: Numeroloji ve Dokuzun Karesi: Shepherd Nume

The SuperTrend AI indicator is a novel take on bridging the gap between the K-means clustering machine learning method & technical indicators. In this case, we apply K-Means clustering to the famous SuperTrend indicator. USAGE Users can interpret the SuperTrend AI trailing stop similarly to the regular SuperTrend indicator. Using higher minimum/maximum factors will return longer-term signals. (image 1) The displayed performance metrics displayed on each signal allow for a deeper interpretat

MT4 için Astronomi Göstergesini Tanıtıyoruz: En İleri Göksel Ticaret Arkadaşınız Ticaret deneyiminizi göksel seviyelere yükseltmeye hazır mısınız? MT4 için devrim niteliğindeki Astronomi Göstergemizi arayın. Bu yenilikçi araç karmaşık algoritmaları kullanarak eşsiz astronomik içgörüler ve hassas hesaplamalar sunmak için geleneksel ticaret göstergelerini aşmaktadır. Bilgi Evreni Parmaklarınızın Ucunda: Göksel verilerin hazinelerini açığa çıkaran kapsamlı bir paneli gözlemleyin. Gezegenlerin geo/h
Trend Rider AI is the name of my EA. It operates based on trends, entering trades according to a preset price range until a set profit is reached, at which point it closes all positions.
Live Signal: https://www.mql5.com/en/signals/2179495
Recommended : ・Initial Deposit: 2000$ ・Currency: USDCHF,EURUSD,GBPUSD,USDJPY,AUDCHF,....
Key Parameters for Configuration: ・StepPrice = 10; The distance between two orders is 10 pips. ・ProfitThreshold = 1; When the total profit of either Buy or Sell orders

Golden Bull USES THE TREND WAVE INDICATOR AND IT CAN IDENTIFY THE BEGINNING AND THE END OF A NEW WAVE TREND MOVEMENT. AS AN OSCILLATOR, THE INDICATOR IDENTIFIES THE OVERBOUGHT AND OVERSOLD ZONES. IT WORKS GREAT TO CATCH THE SHORT TERM PRICE REVERSALS AND USES A MARTINGALE STRATEGY TO CLOSE ALL TRADES IN PROFIT. USE DEFAULT SETTINGS ON H1 OR HIGHER TIME FRAME ON ANY PAIR FOR MORE ACCURATE TRADES
WHY THIS EA : Smart entries calculated by 5 great strategies The EA can be run on even a $20000 accou

This is diamond! Contact me to send you instruction and add you in group.
Diamond Pattern is based on Read The Market(RTM) concepts. The purpose of this model is to face the big players of the market (financial institutions and banks), As you know in financial markets, big traders try to fool small traders, but RTM prevent traders from getting trapped. This style is formed in terms of price candles and presented according to market supply and demand areas and no price oscillator is used in it.

This EA Optimize for EURUSD H1 With Balance start 1,000 /0.1 Lot Strategy : 1.Used EMA 200 Confirm trend 2.Scan Price action with DOJI 3.Confrim position open order with Stochastic Oscillator EA include 3 money management Mode1 Fix Lot,Fix SL,TP Mode2 Lot Auto exponential ,Fix SL,Fix TP Mode3 Special MM Repeat Order with same logic with Lot martingale Remark : Have Function Closed All , Max order and Cutt loss User can select that you like money management system For my Suggestion is mode
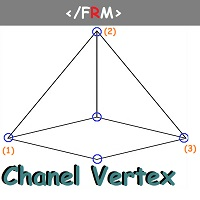
Channel Vertex is a price action pattern formed by price Chanel and a triangle pattern . Price channels basically indicates possible support and resistance zones around a price movement and retracement or breakout at these levels can indicate possible trend continuation or reversal .
Majority of the times price fluctuations forms triangle patterns defined by 3 vertexes , these triangle patterns most times defines a trend continuation. A triangle pattern is a trend continuation pattern that

The " Global Trend Pro Lines " indicator is one of the most important indicators designed to display trading volumes based on the sniper strategy. This indicator provides convenience for daily, medium-term, and long-term traders. The main advantages of the indicator are as follows: Suitable for the sniper strategy: The "Global Trend Pro Lines" indicator is suitable for the sniper strategy and allows traders to identify the best entry and exit points for trading. Displays volumes: The indicator

Deposit from $100.
The expert trades during a small market volatility, at the end of the American session, tracking price levels, and then opens positions
and monitors them until they close with a profit or a small loss. You can limit the number of open positions.
Does not use martingale strategies, averaging positions, waiting out a loss, etc.
All positions are opened with fixed StopLoss, the profit closes on the market itself.
It is possible to use a dynamic lot to increase the volume of
Perhaps you have previously read in technical analysis books about such a concept as "market slope", or "trend slope". Metatrader has such a tool as "trend line by angle". But when working on auto-scaled charts, this tool becomes completely abstract, and as a consequence, useless. The idea of this new parameter, included in the AllAverages_Speed indicator, is to give such a concept as "trend slope" specific numerical values, as well as the further use of the new parameter in work.
Modifica
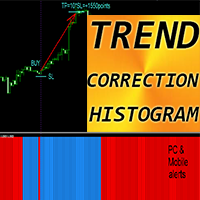
MT4 için Crypto_Forex Göstergesi "Trend Düzeltme Histogramı". - Trend Düzeltme Histogramı 2 renkte olabilir: düşüş eğilimi için kırmızı ve yükseliş eğilimi için mavi. - Aynı renkteki 7 ardışık histogram sütunu yeni bir eğilimin başlangıcı anlamına gelir. - Ana amaç olan kayıpları en aza indirmek ve karı en üst düzeye çıkarmak için tasarlanmış Trend Düzeltme Histogramı göstergesi. - Göstergenin duyarlılığından sorumlu olan "Periyot" parametresine sahiptir. - Dahili Mobil ve PC uyarıları. - Trend
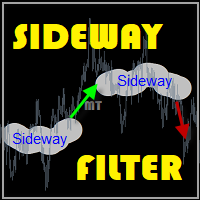
If you know where the sideway,
you will know the trend.
MT Sideway Filter : Built to identify and anticipate sideways market phases. Once detected, expect a transition into a trend, offering profitable opportunities. Ideal for pinpointing both sideways movements and trends. Can be used to enhance the performance of other indicators.
TRADE: Forex TIME FRAME: All Time Frame SYMBOL PAIR: All Symbol
SETTINGS: SIDEWAY FILTER
Period: Put the number period for calculate (1-100) Multiply: Fr

İşlem hacimlerine ilişkin okumaları hesaplayan teknik bir gösterge. Histogram biçiminde, ticaret enstrümanının hareket gücünün birikimini gösterir. Yükseliş ve düşüş yönleri için bağımsız hesaplama sistemlerine sahiptir. Herhangi bir ticaret enstrümanı ve zaman dilimi üzerinde çalışır. Herhangi bir ticaret sistemini tamamlayabilir.
Gösterge değerlerini yeniden çizmez, sinyaller mevcut mum üzerinde görünür.
Kullanımı kolaydır ve grafiği yüklemez, ek parametre hesaplamaları gerektirmez. Değiştiril
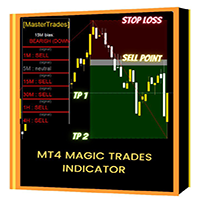
Introducing the "Magic Trades" for MetaTrader 4 – your ultimate tool for precision trading in dynamic markets. This innovative indicator revolutionizes the way you perceive market trends by harnessing the power of advanced analysis to detect subtle changes in character, paving the way for optimal trading opportunities.
The Magic Trades Indicator is designed to empower traders with insightful entry points and well-defined risk management levels. Through its sophisticated algorithm, this indicato

GU Spot is a One Shot One Kill EA. A Scalping EA for GBPUSD . No Martingale, No Averaging, No Grid or other high-risk strategies. Working with up to the best 100 trading signals algorithm from various Trading Systems. The combination of Price Action, High Low, Trend, Range Levels, Pullback / Retracement and Reversal. This is Fully Automatic Trading Robot . High Accuracy Entry Signals and protected by a proper Money Management. A tight Stop Loss with SL:TP ratio 1:3 by default, Trailing an

Drop Trend is a trend indicator for the MetaTrader 4 trading platform. This indicator allows you to find the most probable trend reversal points. You will not find this indicator anywhere else. A simple but effective system for determining the forex trend. From the screenshots you can see for yourself the accuracy of this tool. Works on all currency pairs, stocks, raw materials, cryptocurrencies.
Are you tired of the constant ups and downs? Do not become a victim of unstable market movements,

Best Definition is trend trading. The expert system goes through the whole history for most currency pairs with simple settings. The bot has a very developed internal architecture. Works with pending orders. Can work with trailing stop for pending orders. With trailing stop for real orders. For pending and real ones, you can set separately stop loss and take profit. The bot can also work with virtual top loss and take profit.
The Expert Advisor can be launched on any hourly period, any curre
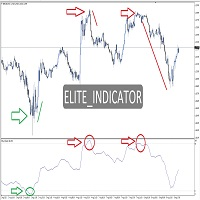
ELT Reversal MT4 (Elite_Indicator) is an indicator for the MetaTrader 4 terminal. . This indicator is based on the Counter-Trend strategy, but also uses Volatility. It is based on showing possible liquidity in the financial market, thus helping traders in their trading. ELT Reversal MT4 (Elite_Indicator) is a visual tool, intuitive, and easy to understand and use.
Recommended time frame for Scalping Trade : M1 M5 M15 Recommended time frame for Swing Trade : M30 upward Better precision:

The Moving Averages'ın kendi botunu temel alan TMA Trend Takip Botu, bu stratejinin kendi youtube kanalında karlı olduğu kanıtlandı. TMA Trend Takip Botu trend bazlı bir ticaret stratejisidir. The Moving Average'ın youtube kanalında tasvir ettiği gibi, bu bot optimize edildiğinde bazı ciddi sonuçlar doğurabiliyor, hatta kendi meydan okuma hesaplarında bile yayınlıyor. Lot büyüklüğünüzü, SL ve TP büyüklüğünüzü, işlem pencerenizi ve EMA döneminizi ayarlayın ve başlamaya hazırsınız! Dosyaları yorum
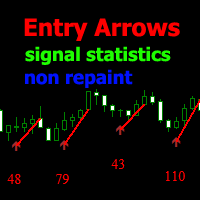
Binary Lines , para birimleri, emtialar, kripto para birimleri, hisse senetleri, endeksler ve herhangi bir finansal araç için teknik bir analiz göstergesidir. İkili opsiyonlar veya Forex ölçeklendirme için kullanılabilir. Giriş ve çıkış noktalarını sabit aralıklarla gösterir ve tüccarlar olası işlemlerin sonuçları hakkında gerekli bilgileri. Giriş noktaları, mumun en başında, MA çizgisi yönünde, süre boyunca oluşturulur. çubuklardaki işlemler manuel olarak ayarlanabilir ve herhangi bir finansal
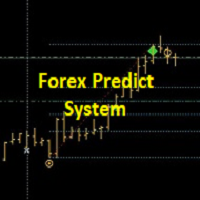
Bu, Breakout ve FIBONACCI seviyelerine dayanan basit bir stratejidir.
Bir kopuşun ardından,
ya piyasa doğrudan 161, 261 ve 423 seviyelerine doğru ilerlemeye devam ediyor
veya %50 seviyesine geri döner (düzeltme olarak da adlandırılır) ve ardından büyük olasılıkla başlangıç yönünde 161, 261 ve 423 seviyelerine doğru harekete devam eder.
Sistemin anahtarı yeşil (YUKARI TREND) veya kırmızı (AŞAĞI TREND) dikdörtgen nesneyle gösterilen kırılma çubuğunun tespitidir.
Kırılma anında fibonacci hede

Description Helps you detect the structure of the market, using different types of Smart Money concepts. This should help you to upgrade your trading strategy in every way. MT5 Version Here Smart Money Features: Color candle to signal the type of structure Shows CHOCH and BOS Equal Lows and Highs Order Blocks Internal and Swings Weak and strongs high and lows Fair Value Gaps High and Lows in daily weekly and monthly timeframes Premium and discount Zones KEY LINKS: How to Install – Frequent

Gumper Options USES THE TREND WAVE INDICATOR AND IT CAN IDENTIFY THE BEGINNING AND THE END OF A NEW WAVE TREND MOVEMENT.
AS AN OSCILLATOR, THE INDICATOR IDENTIFIES THE OVERBOUGHT AND OVERSOLD ZONES.
IT WORKS GREAT TO CATCH THE SHORT TERM PRICE REVERSALS AND USES A MARTINGALE STRATEGY TO CLOSE ALL TRADES IN PROFIT.
USE DEFAULT SETTINGS ON H1 OR HIGHER TIME FRAME ON ANY PAIR FOR MORE ACCURATE TRADES
WHY THIS EA :
Smart entries calculated by 5 great strategies The EA can be run on even a $200

"Para Birimi Gücü" göstergesi, forex piyasasındaki farklı para birimlerinin göreceli gücünü sağlamak amacıyla tasarlanmış güçlü bir araçtır. Her bir para biriminin belirtilen zaman dilimine göre gücünü hesaplayarak ve temsil ederek, bu gösterge, trader'lara potansiyel işlem fırsatlarını tanımlama imkanı sunar, özellikle belirgin ayrışmalar veya kesişmeler gözlendiğinde. Gösterge Ana Özellikleri: 1. Para Birimi Gücü Hesaplama: Gösterge, her bir para biriminin belirtilen zaman dilimine göre gücünü

Rapid Trend is a technical analysis indicator that determines the direction and strength of a trend, and also signals a trend change. Allows you to determine the current trend. With the help of its algorithm, you can quickly understand what kind of trend is currently developing in the market. Rapid Trend can be used along with oscillators as filters. Setting up the Rapid Trend forex indicator allows you to receive more accurate signals for opening positions. Uses only one parameter for settings.

Gann Kare Göstergesi, W.D. Gann tarafından yazılan "Piyasa Tahminleri için Matematiksel Formül" makalesine dayalı güçlü bir piyasa analizi aracıdır. Bu araç, piyasa analizi için matematiksel ve Gann teorilerini kullanarak hassas analizler gerçekleştirir. 144, 90, 52 karelerini ve ayrıca 9 karesini kullanır. Ayrıca, 'ın 9 karesi ve bu kareyle ilişkili kanallar ve yıldız modelleri için yöntemini içerir. Kullanıcı Kılavuzu ve Uygulama: Bu göstergeleri kullanmadan önce, kullanıcı kılavuzunu okumanız

Güçlü Forex göstergemizi sizlere sunuyoruz. Bu gösterge, ticaret stratejinizi geliştirmeniz ve size piyasa trendleri hakkında kesin bilgiler sağlamanız için tasarlanmıştır. Bu yenilikçi araç, mum ölçümlerini ayrıntılı bir şekilde analiz eden ve en iyi hassasiyeti elde etmek için ayarlamalar yapan sofistike bir özel algoritma kullanır. Sonuç? Grafiğinizde stratejik giriş noktalarını gösteren dikkatlice çizilmiş bir ok takımı. Bu göstergenin arkasındaki dahilik, mum desenlerinin gücünden faydalanm

All Cleaned Up Trading - integrated with market volatility scalping trading. Settings for all 28 Currency Pairs and XAUUSD (for 5 Digits pairs) are available in the comments section for immediate use. Thus, there is literally no Symbol that cannot be traded. Download and start your live trading NOW!
The Universal HedgeR Expert - just like The Fibo Reversal Expert is the Expert Advisor built based on the trading strategy of "The Fibo Reversals Indicator". Here too, the E.A. is used with two ot

FxBears Süper Ticaret Göstergesi ile gelişmiş ticaret dünyasına hoş geldiniz. MT4 platformu için özel olarak tasarlanan bu yenilikçi araç, Elliott Waves'in, arz ve talep bölgelerinin ve dahili göstergelerin gücünü birleştirerek yatırımcılara bilinçli ticaret kararları için yüksek kaliteli sinyaller sağlar. %90'ın üzerinde başarı oranına sahip FxBears Super, ticaret stratejinize yeni bir hassasiyet ve karlılık düzeyi getiriyor. Corse'un Yeniden Boyanması ve Yeniden Çizilmesi Yok.
Elliott Dalga

Maximo Momentum USES THE TREND WAVE INDICATOR AND IT CAN IDENTIFY THE BEGINNING AND THE END OF A NEW WAVE TREND MOVEMENT. AS AN OSCILLATOR, THE INDICATOR IDENTIFIES THE OVERBOUGHT AND OVERSOLD ZONES. IT WORKS GREAT TO CATCH THE SHORT TERM PRICE REVERSALS AND USES A MARTINGALE STRATEGY TO CLOSE ALL TRADES IN PROFIT. USE DEFAULT SETTINGS ON H1 OR HIGHER TIME FRAME ON ANY PAIR FOR MORE ACCURATE TRADES WHY THIS EA : Smart entries calculated by 6 great strategies The EA can be run on even a $20000 a
RSI Trend Lines Indicator - Identify Optimal Buying and Selling Opportunities Introduction :
The RSI Trend Lines Indicator is a powerful tool designed to assist traders in identifying optimal buying and selling opportunities based on the Relative Strength Index (RSI) oscillator. This advanced indicator draws trend lines on the RSI chart using multiple points, providing valuable insights into potential market trends and reversals. By leveraging the RSI Trend Lines Indicator, traders can enhance t

Note: After installation, please go to Tools>Options>Expert Advisors and add https://porsaj.com to 'Allow WebRequest for listed URL'. Still Problem?! Please check Internet connection!
Unveiling the Porsaj Scalper: Your Cutting-Edge MetaTrader 4 Utility for Precision Scalping Are you ready to take your forex trading to the next level? Look no further than the revolutionary Porsaj Scalper – a MetaTrader 4 utility designed to empower scalpers with the tools they need to thrive in the fast-pac

for xau/usd marthingale expert adviser.
・The initial lot is carefully selected for both buying and selling. ・When there is a large price movement, or there is a trend, we do not have a new position. ・Nanping also does not have a new positions when there is a trend or there is a sudden change (when it rises or falls). ・Separately setting for buying and selling can use,(for example Nanpin ratio, Nanpin Interval, Nanpin Interval_add,and profit take method.) «two type of profit take method» 1) s

Maximo Bull Skunk USES THE TREND WAVE INDICATOR AND IT CAN IDENTIFY THE BEGINNING AND THE END OF A NEW WAVE TREND MOVEMENT. AS AN OSCILLATOR, THE INDICATOR IDENTIFIES THE OVERBOUGHT AND OVERSOLD ZONES. IT WORKS GREAT TO CATCH THE SHORT TERM PRICE REVERSALS AND USES A MARTINGALE STRATEGY TO CLOSE ALL TRADES IN PROFIT. USE DEFAULT SETTINGS ON H1 OR HIGHER TIME FRAME ON ANY PAIR FOR MORE ACCURATE TRADES WHY THIS EA : Smart entries calculated by 6 great strategies The EA can be run on even a $20000

Gold Whiskers USES THE TREND WAVE INDICATOR AND IT CAN IDENTIFY THE BEGINNING AND THE END OF A NEW WAVE TREND MOVEMENT. AS AN OSCILLATOR, THE INDICATOR IDENTIFIES THE OVERBOUGHT AND OVERSOLD ZONES. IT WORKS GREAT TO CATCH THE SHORT TERM PRICE REVERSALS AND USES A MARTINGALE STRATEGY TO CLOSE ALL TRADES IN PROFIT. USE DEFAULT SETTINGS ON H1 OR HIGHER TIME FRAME ON ANY PAIR FOR MORE ACCURATE TRADES WHY THIS EA : Smart entries calculated by 6 great strategies The EA can be run on even a $20000 acc

ROYAL DUTCH SKUNK USES THE TREND WAVE INDICATOR AND IT CAN IDENTIFY THE BEGINNING AND THE END OF A NEW WAVE TREND MOVEMENT. AS AN OSCILLATOR, THE INDICATOR IDENTIFIES THE OVERBOUGHT AND OVERSOLD ZONES. IT WORKS GREAT TO CATCH THE SHORT TERM PRICE REVERSALS AND USES A MARTINGALE STRATEGY TO CLOSE ALL TRADES IN PROFIT. USE DEFAULT SETTINGS ON H1 OR HIGHER TIME FRAME ON ANY PAIR FOR MORE ACCURATE TRADES WHY THIS EA : Smart entries calculated by 6 great strategies The EA can be run on even a $20000
This is a dashboard indicator that displays the Average Level of each selected currency pairs that filters and gives us a signal for overbought (>=90%) or if price at extreme peak above 90, and/or oversold (<=10%) or if price at extreme peak below 10.
The calculation is using Relative Strength Index default periods (2 & 9) applied to three different higher time frames H4,D1,&W1.
This won't change or altered even if you change symbol or switch to lower time frames or even in monthly and year

Goldmine Ventures USES THE TREND WAVE INDICATOR AND IT CAN IDENTIFY THE BEGINNING AND THE END OF A NEW WAVE TREND MOVEMENT.
AS AN OSCILLATOR, THE INDICATOR IDENTIFIES THE OVERBOUGHT AND OVERSOLD ZONES.
IT WORKS GREAT TO CATCH THE SHORT TERM PRICE REVERSALS AND USES A MARTINGALE STRATEGY TO CLOSE ALL TRADES IN PROFIT.
USE DEFAULT SETTINGS ON M15 OR HIGHER TIME FRAME ON ANY PAIR FOR MORE ACCURATE TRADES
WHY THIS EA :
Smart entries calculated by 5 great strategies The EA can be run on even a

Gold Standard USES THE TREND WAVE INDICATOR AND IT CAN IDENTIFY THE BEGINNING AND THE END OF A NEW WAVE TREND MOVEMENT.
AS AN OSCILLATOR, THE INDICATOR IDENTIFIES THE OVERBOUGHT AND OVERSOLD ZONES.
IT WORKS GREAT TO CATCH THE SHORT TERM PRICE REVERSALS AND USES A MARTINGALE STRATEGY TO CLOSE ALL TRADES IN PROFIT.
USE DEFAULT SETTINGS ON H1 OR HIGHER TIME FRAME ON ANY PAIR FOR MORE ACCURATE TRADES
WHY THIS EA :
Smart entries calculated by 5 great strategies The EA can be run on even a $200

The "No repaint" indicator is designed for analyzing market dynamics and determining potential trading signal moments. The main feature of this indicator is the absence of signal repainting, which contributes to more accurate and reliable forecasting of price movements in the market.
Mechanism of Operation: The "No repaint" indicator uses several types of graphical elements to indicate trading signals: Up and Down Arrows: The indicator marks possible market entry points with up and down arrows

Parabolik EA: Eğilim Odaklı Ticaret Stratejisinin Zirvesi! Temel Özellikler: Optimal Pariteler: XAUUSD Tavsiye Edilen Zaman Dilimleri: 30 dakika ve 1 saat (daha kısa aralıklara uygun şekilde uyarlanabilir) Minimum Sermaye Gereksinimi: $1.000 Parabolik EA: İleri Düzey Eğilim Analiz Araçlarıyla Hassaslıkla Yönlendiriliyor! Daha fazlasını resmi sitemizde keşfedin. Güvenle Piyasa Dalgalarını Yönlendirin! Parabolik EA ile finansal denizlere yolculuk yapın - piyasa zirvelerini ve diplerini kusursuz bi

Anubis Skunk USES THE TREND WAVE INDICATOR AND IT CAN IDENTIFY THE BEGINNING AND THE END OF A NEW WAVE TREND MOVEMENT.
AS AN OSCILLATOR, THE INDICATOR IDENTIFIES THE OVERBOUGHT AND OVERSOLD ZONES.
IT WORKS GREAT TO CATCH THE SHORT TERM PRICE REVERSALS AND USES A MARTINGALE STRATEGY TO CLOSE ALL TRADES IN PROFIT.
USE DEFAULT SETTINGS ON H1 OR HIGHER TIME FRAME ON ANY PAIR FOR MORE ACCURATE TRADES
WHY THIS EA :
Smart entries calculated by 5 great strategies The EA can be run on even a $20000

Global Trend Lines Zo'nalarını Gösteren Gösterge, işlem stratejinizi iyileştirmek için kullanılan birkaç özelliğe sahiptir. Bu gösterge, grafikte alım bölgesini ve satış bölgelerini belirlemenize yardımcı olur. Bu göstergenin temel özellikleri şunlardır:
1. Trend seviyelerini belirleme: Bu gösterge, trend seviyelerini belirlemek için kullanılan algoritmalara sahiptir. Bu, trendin yönünü ve gücünü belirlemenize yardımcı olur.
2. Alım ve satım bölgelerini belirleme: Gösterge, grafikte alım ve s
The trading advisor trades with money management elements, both using the martingale system and using the anti-martingale system, at the user's choice. You can choose the type of money management system in external variables. (Usage options with money management according to Martin or AntiMartin) Opens starting positions on the RSI indicator, after exiting the position on the take profit, increases the lot by the AntiMartin coefficient, again we enter the market on the RSI indicator. With Marti
Giriiş:
"Turning Zone", tüccarlara finansal piyasalardaki potansiyel trend tersine dönüşlerini tespit etmek için güçlü bir araç sağlamak üzere tasarlanmış sofistike ve yenilikçi bir MT4 göstergesidir. Zamana meydan okuyan dirgen analizi konseptini kullanan Turning Zone göstergesi, piyasa duyarlılığının değişmesi muhtemel olan kilit tersine çevirme bölgelerini tanımlayarak tacirlere bilinçli kararlar vermeleri için değerli içgörüler sunar. MT5 Sürümü : WH Turning Zone MT5
İlgili Ürün :
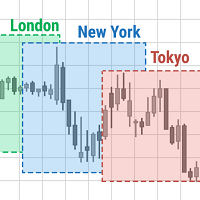
This indicator shows when user set sessions are active and returns various tools + metrics using the closing price within active sessions as an input. Users have the option to change up to 4 session times.
The indicator will increasingly lack accuracy when the chart timeframe is higher than 1 hour.
Settings
Sessions
Enable Session: Allows to enable or disable all associated elements with a specific user set session.
Session Time: Opening and closing times of the user set session in the
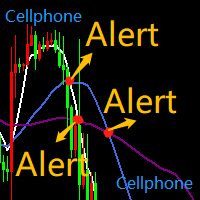
SMA5_SMA10_SMA55三均线系统,均线相互交叉,发送通知到手机 MT4 APP, 同时电脑桌面客户端也会发出警报通知。 注意:这个EA不会帮你下单交易,只会在均线交叉,即关键位置转向的时候给你发出警告,特别是手机通知,方便没时间盯盘的交易员放心出门,同时不会错过关键位置的转向,收到通知,打开手机APP就能处理头寸。是否变动头寸仓位,依然是要由自己判断。 均线的交叉往往意味着趋势的转向和启动,震荡的关键位置,请结合自我经验,以及趋势位置形态,多方位判断操作。 比如: MA5从下往上穿插MA10,则会向手机MT4 APP发出通知,提示多头有启动迹象,若有空单在手提示减仓。 MA5从上往下穿插MA10,则会向手机MT4 APP发出通知,提示空头有启动迹象,若有多单在手提示减仓。 -- MA10从下往上穿插MA55,则会向手机MT4 APP发出通知,提示多头启动,若有空单在手必须清仓,并且开多头。 MA10从上往下穿插MA55,则会向手机MT4 APP发出通知,提示空头启动,若有多单在手必须清仓,并且开空头。 -- MA5穿插MA55同理 -- 预祝:交易之路长虹! SMA5_SMA
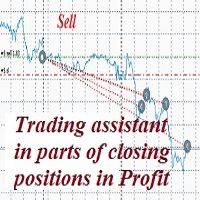
A trader's assistant that closes positions in parts with a simple trail to take the optimal profit size when the price of the symbol moves towards the position (s). Initially, the stop loss is moved to breakeven + (the so-called breakeven greed level) - this is when the price closes the stop-loss position during the reverse movement and as a result some profit will still be received. Further, while maintaining the movement in the direction of the position, it is closed in parts on price rollback
MetaTrader platformunun uygulama mağazası olan MetaTrader Mağazasından bir alım-satım robotunun nasıl satın alınacağını öğrenin.
MQL5.community Ödeme Sistemi, PayPal, banka kartları ve popüler ödeme sistemleri aracılığıyla yapılan işlemleri destekler. Daha iyi bir müşteri deneyimi için satın almadan önce alım-satım robotunu test etmenizi şiddetle tavsiye ederiz.

Alım-satım fırsatlarını kaçırıyorsunuz:
- Ücretsiz alım-satım uygulamaları
- İşlem kopyalama için 8.000'den fazla sinyal
- Finansal piyasaları keşfetmek için ekonomik haberler
Kayıt
Giriş yap
Web sitesi politikasını ve kullanım şartlarını kabul edersiniz
Hesabınız yoksa, lütfen kaydolun