 MetaTrader 5
 Uzmanlar
 Göstergeler
 Kütüphaneler
 Yardımcı programlar
 Widget'lar
 Kurallar
YouTube'dan Mağaza ile ilgili öğretici videoları izleyin
Bir alım-satım robotu veya gösterge nasıl satın alınır?
Uzman Danışmanınızı
sanal sunucuda çalıştırın
sanal sunucuda çalıştırın
Satın almadan önce göstergeyi/alım-satım robotunu test edin
Mağazada kazanç sağlamak ister misiniz?
Satış için bir ürün nasıl sunulur?
MetaTrader 4 için yeni Teknik Göstergeler - 84
 Aşağıda listelenen teknik göstergelerden gelen sinyaller, MetaTrader 4 platformunda işlemler açılması ve kapatılmasında çok önemli bir rol oynar.
Göstergeler, fiyat değişikliklerini tahmin etmeyi amaçlayan, finansal sembol fiyatının matematiksel dönüşümüdür.

Achieving Goal is a trend indicator for the MetaTrader 4 trading platform. This indicator allows you to find the most likely trend reversal points. You will no longer find a copyright indicator like this. A simple but effective system for determining the forex trend. From the screenshots you can see for yourself the accuracy of this tool. It works on all currency pairs, stocks, raw materials, cryptocurrencies.
Are you tired of the constant ups and downs? It is not worth becoming a victim of un

"BUYUK SAVDOGAR" TM has developed this strategy to support all who trade binary options.
This trading system determines the state of imbalance in the market based on volume analysis. The most convenient point for opening a trade is an imbalance situation. The trading system independently allocates an imbalance zone. Issues a warning (alert) in the desired direction.
The terms of trade are very simple. We are waiting for directions. We open a deal on the current timeframe in the direction.
It

OrderCalc opens a window in the chart with the data of your orders:
Position size, stop loss, take profit, profit/loss
Only the positions for this symbol are displayed. If several positions exist, these are totalled and displayed in the last line. If you work with pyramids, you can see at a glance how big the total profit or loss is.
The indicator is invisible at the beginning, only when a position is opened does a window open containing the data for the order. In some cases the content is e
FREE

Signal trend indicator for scalping. Has three different sensitivity options
It detects a trend change and gives signals to open positions.
Has built-in audio and visual trend change alerts. Can send notifications to your phone or email. Allows you to open positions in a timely manner in accordance with the direction of the market. Works on all timeframes, on all currency pairs, metals, indices and cryptocurrencies. Can be used when working with binary options. Distinctive features Does not

Sharp Transition is a new product that allows you to identify the current market phase (uptrend, downtrend or flat). Represents a typical investor strategy that usually indicates a trend change from bearish to bullish. A tool that allows you to determine the direction and strength of a trend. Unlike most indicators, Sharp Transition finds longer trends and gives fewer false signals.
This indicator displays arrows of different colors depending on the current state of the market and thus signals
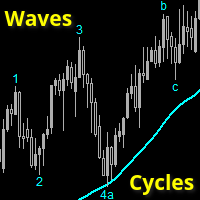
Wave and Cycle counter to give an immediate indication how far the ongoing trend has progressed.
Low numbers: trend has just started, ride the trend. Higher numbers: trend is 'older', watch for reversals
This indicator is 100% compatible with the fantastic TopDog trading strategy.
(I will NOT give any details about this Top Dog strategy)
The trend direction is determined by a SMA value (or any other MA) you can set.
Waves and cycles numbers and letters are derived from a SlowStoch setting.
Wave
Super Magic Signal indicator is designed for signal trading. This indicator generates trend signals.
It uses many algorithms and indicators to generate this signal. It tries to generate a signal from the points with the highest trend potential.
This indicator is a complete trading product. This indicator does not need any additional indicators.
The indicator certainly does not repaint. The point at which the signal is given does not change.
Features and Suggestions Time Frame: H1 W

This is a tool to measure the velocity of the price. It's completely free, you can download and use. "Way: distance of price after one tick." "Speed: price velocity after one tick." p/s: The time for the price to jump 1 tick will not be fixed, you should know this. If Way > 0, the indicator will change color to Green If Way < 0, the indicator will change color to Red || I am a 3D artist and I love math and programming! ||
FREE
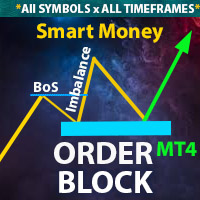
** All Symbols x All Time frames scan just by pressing scanner button ** *** Contact me to send you instruction and add you in "Order Block group" for sharing or seeing experiences with other users. Introduction: The central banks and financial institutions mainly drive the market, Order block is considered a market behavior that indicates accumulation of orders from banks and institutions, then the market tends to make a sharp move(Imbalance) on either side once the order block is completed. O
OB Breakout is alert indicator that identifies when a trend or price move is approaching exhaustion(Supply and Demand) and ready to reverse. It alerts you to changes in market movement which typically occur when a reversal or major pullbacks are about to or have happened. The indicator identifies breakouts and price momentum initially, every time a new high or low is formed near a possible Supply or Demand level point. The indicator draws in a rectangle on Supply or Demand Zones. Once price we

Key Level Key Level is a MetaTrader 4 Indicator that uses a proprietary algorithm based on Price Retracement/Breakout Method to show the Entry-Line on your trading.
Instead, it analyzes data of market and identify entry points and opportunities. (Price Retracement / Price Breakout)
It's also a trading tool that be used to practice and enhance your manual trading skills.
Key Level is an amazing tool for Scalping Trader. It also a trading tool that be used to practice and enhance your manual trad

Momentum Breakout Finder (MoBlast) is an indicator based on Volume to find the when the current pair is making breakout and when market are range bound. Oscillators Indicators like RSI, MACD that works fine for an interval of the market, it fails to generate profitable signals when the market conditions change, and hence it produces wrong signals resulting in big losses. This indicator implements an volume logic algorithm that finds the best breakout of the symbol. When an arrow signal appears
Современный индикатор паттерна Ключевой разворот. Имеет настройки таймфрейма. Можно настроить количество баров для отображения индикатора на графике. Индикатор предпочтительно использовать на часовом таймфрейме и выше, но работает и ниже. Подходит для использования с любой стратегией. Условие отображения: какой таймфрейм указали в настройках, галочку во вкладке отображение ставим там же. Для фильтра можно использовать скользящую среднюю.
Современный индикатор паттернов PinBar по торговой стратегии RAIT. Работает по тренду и без него. Имеет настройки таймфрейма для отображения. Можно настроить количество баров для отображения индикатора на графике. Используется несколько паттернов PinBar. Индикатор предпочтительно использовать на часовом таймфрейме и выше, но работает и ниже . Паттерны: PinBar, InsPinBar, PinInside. Отображаются одной стрелкой.
This Harmony Cross Signal indicator is designed for signal trading. This indicator generates trend signals.
It uses many algorithms and indicators to generate this signal. It tries to generate a signal from the points with the highest trend potential.
This indicator is a complete trading product. This indicator does not need any additional indicators.
The indicator certainly does not repaint. The point at which the signal is given does not change.
Features and Suggestions Time F

The RSI and Moving Average Indicator is a powerful tool for any trader looking to take their technical analysis to the next level. With the RSI as the main indicator, you will have access to a clear and accurate representation of the strength of the current market trend. The addition of the moving average line adds another level of insight, providing a smoothed view of the RSI that helps to identify longer-term trends and potential buying or selling opportunities. Whether you are a day trader, s
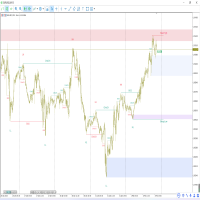
ICT, SMC, SMART MONEY CONCEPTS, SMART MONEY, Smart Money Concept, Support and Resistance, Trend Analysis, Price Action, Market Structure, Order Blocks, BOS/CHoCH, Breaker Blocks , Momentum Shift, Supply&Demand Zone/Order Blocks , Strong Imbalance, HH/LL/HL/LH, Fair Value Gap, FVG, Premium & Discount Zones, Fibonacci Retracement, OTE, Buy Side Liquidity, Sell Side Liquidity, BSL/SSL Taken, Equal Highs & Lows, MTF Dashboard, Multiple Time Frame, BigBar, HTF OB, HTF Market Structure,

Full Fractals — Gürültüsüz Fraktallar
Standart Fractals göstergesi grafiği aşırı yükler : onlarca nokta oluşur ve hangilerinin gerçekten önemli olduğunu anlamak zorlaşır.
Sonuç olarak piyasa yapısı belirsizleşir ve seviyeler manuel olarak belirlenmek zorunda kalır. Full Fractals bu sorunu çözer — yalnızca fiyatın gerçekten tepki verdiği ana noktaları bırakır. Gösterge, Bill Williams’ın klasik fraktal mantığına dayanır ve oluşumdan sonra yeniden çizim yapmaz (repaint etmez). Piyasa yapısını belir
FREE

RSI Divergence MT4'ı tanıtıyoruz, fiyat hareketleri ile RSI (Göreceli Güç Endeksi) arasındaki ilişkiyi analiz ederek trend dönüşlerini belirlemek için tasarlanmış güçlü bir göstergedir. Karar verme süreçlerini geliştirmek isteyen traderlar için mükemmel olan bu araç, sapma desenlerine dayalı potansiyel alım ve satım sinyalleri hakkında içgörüler sunar. Hem boğa hem de ayı sapmalarını tespit etme yeteneği ile RSI Divergence MT4, traderların zayıflayan trendleri fark etmelerini ve çıkış stratejile
FREE

R Hareket Kolaylığı Metatrader 4 forex göstergesi mavi renkli bir EMZ ticaret osilatörüdür. Bir yükseliş ve düşüş ticaret alanı oluşturan osilatör tipi bir forex göstergesidir. Sıfır seviyesinin üzerindeki değerlerin yükseliş, sıfır seviyesinin altındaki değerlerin düşüş olduğu söylenir.
R Ease of Movement osilatörü tek başına iyi sonuçlar vermez, teknik göstergeyi takip eden bir trend ile birlikte işlem görmesi gerekir. İyi forex trend göstergeleri şunları içerir: SMA, EMA, PSAR, Bollinger Ba
UR PulseScalp Hızlı tempolu piyasalarda en üst noktayı arayan kazıyıcılar için kalibre edilmiş bir ticaret göstergesi
UR PulseScalp , hızlı tempolu pazarlarda en üst noktayı arayan kazıyıcılar için son teknoloji bir ticaret çözümüdür. Bu yenilikçi gösterge, son derece doğru ve güvenilir bir sinyal oluşturmak için Volatilite, MoneyFlow ve Relative Strength'in gücünü harmanlayan bilimsel olarak kalibre edilmiş bir formül üzerine kurulmuştur.
UR PulseScalp kullanmanın avantajları:
Konforlu İnt
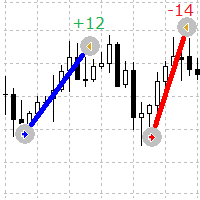
Emirlerin giriş ve çıkış noktalarını grafik üzerinde görsel olarak görmek için basit ama kullanışlı bir gösterge
Bu gösterge, mevcut açık emirleri ve tamamlanmış emirleri sembol üzerinde gösterir.
Gösterge parametreleri
Lines Buy color - satın alma emirleri için hatların rengini belirtir Lines Sell color - satış emirleri için çizgilerin rengini belirtir Lines Width - çizgi genişliğini ayarlar, Düz stil türleri için çalışır Lines style - çizgilerin stilini ayarlar Lines positive profit color
FREE

A ready-made trading strategy for scalping on the M5 period (M5 timeframe), on any currency pair. The trading strategy has been tested and has shown good performance. Every trader, even a beginner, can scalp using this strategy. To start trading, you need to open your Metatrader4 on your PC, download the "Scalping signal indicator" from this page and add it to the chart of the currency pair you want to trade. You need to select M5 timeframe (the indicator will not work on other timeframes witho
UR Vortex
The Probabilistic UR Vortex Formula: An Accurate System for Predictive Market Analysis using Volatility and Standard Deviation Calculations. The UR Vortex indicator is a technical analysis tool that uses volatility and standard deviation calculations to predict potential tops and bottoms in a market. It measures the strength of a trend by calculating the distance between the current price and a moving average, and then standardizing this distance by dividing it by the average true
Contact me after payment to send you the User-Manual PDF File. Harmonic Trading The secret is the Fibonacci. It has been proven in the markets that price always reacts to Fibonacci levels. Fibonacci levels are one of the most important indicators of price changes. Sometimes the sequence of reactions to these levels in the chart make geometric shapes, which are called harmonic patterns. The price creates harmonic patterns with its fluctuation and reaction to Fibonacci levels. Harmonic patterns c
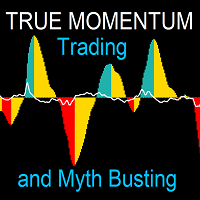
This indicator represents a genuine momentum oscillator according to the true definition of "Momentum", and as realised by the techniques of digital filtering. ( Note : download a complete set of true momentum oscillators here ). A scholarly paper on the subject by the current developer can be found here , but in this description we shall borrow only the minimum of conceptual and mathematical framework needed. In the process, we expose some long-held myths about indicators supposedly measurin
FREE

Candle Timer displays the time remaining until closing the current Bar, and a new bar forms.
Feature simple to use . no lag or delay . customize position, color & font Size . server time not local time.
Inputs
- position * Beside Active Candle ( Default ) * Right Upper * Lift Upper * Right Bottom * Lift Bottom - font size * 14 (Default) - color * SpringGreen (Default)
FREE
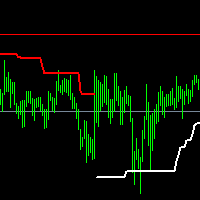
SPT is a trend indicator It is written on the basis of ATR, with clear trend lines indicating the direction in progress, Different traders' understanding of this indicator may form two different purposes Trend-based traders will conduct trend trading when the trend line changes, Respectful shock traders will carry out range trading according to the final support or resistance level marked by this indicator
The index parameters are as follows: Multiplier: multiple of ATR Period: ATR cycle. The s

MACD Color for GOLD Use for looking moving-way of graph and checking will be buy or sell Easy for looking by see the color of trand. Red is down / Blue is up. Can to use it with every time-frame by 1. Long Trade : Use it with time-frame H1 / H4 / Daily 2.Short Trade : Use it with time-frame M5 / M15 / M 30 / H1 and you can see when you will open or close the orders by see this indicator by well by see signal line cut with color line again in opposite. and you can use this indicator for

The True Hero Oscillator indicator is designed for signal trading. This indicator generates trend signals.
It uses many algorithms and indicators to generate this signal. It tries to generate signals from the points with the highest trend potential.
This indicator is a complete trading product. This indicator does not need any additional indicators. This product uses 3 main indicators and many algorithms.
The indicator is never repainted. The point at which the signal is given does not c
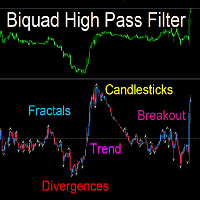
This indicator applies the biquad high pass filter to the price-chart data, and displays the filter output for the OHLC as candlesticks. The candlesticks corresponds to the actual calculations of the filter value during the formation of each price bar (not from all historical highs lows or closes). The shape of the bars therefore corresponds directly to the shape of each price bar. High pass filters are an underappreciated type of oscillator that are seldom used in technical analysis in the st
FREE
AC Pivot Panel – Your Ultimate Pivot Trading Tool The AC Pivot Panel is a powerful yet user-friendly pivot point indicator designed to help traders identify key support and resistance levels with ease. Whether you’re a beginner or an experienced trader, this indicator simplifies pivot trading and enhances your decision-making process. Key Features : Interactive Selection Panel : Easily adjust pivot settings directly on the chart with a compact and intuitive panel. Multiple Pivot Methods : C
FREE
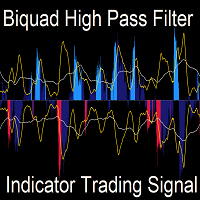
Latest Changes in 1.6 : Added Signal Modes input. Mode 1 : HPF positive go long blue, HPF negative go short red. Mode 2 : slow envelope only, HPF above upper envelope go long blue, HPF below lower envelope go short red. Mode 3 : HPF above both upper envelopes - go long blue, HPF below both lower envelopes go short red. Mode 4 : Go long blue if HPF crosses above upper slow, but fast upper should be below slow upper at the time, exit when HPF crosses below upper fast, reverse logic for short red
FREE
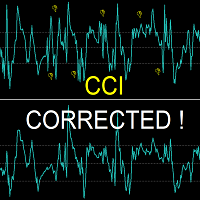
This indicator resolves an unrecognised defect in the Commodity Channel Index Oscillator (CCI). The CCI is based on a high pass filter calculated by subtracting the p-period simple moving average of a price signal (usually typical value) from the price signal itself. Then, the result is divided by the absolute mean deviation of the same period. The frequency response of a signal minus its simple moving average is shown in the first screen shot (in Blue). (see my free indicator : Q n D Frequency
FREE
This is a breakout Indicator for MT4 where you can open trades after a breakout has occurred. This indicator will draw blue boxes on the chart. You simply have to follow price until it breaks out of the box and make sure that the candle had closed above the breakout if its a buy trade and the candle must close below if its a sell trade. An alert will now pop up with suggested price entry and TP of 15 pips default. You can change TP Pis depending on your choice The indicator can trade almost any
MACD (short for M oving A verage C onvergence/ D ivergence) is a popular trading indicator used in technical analysis of securities prices. It is designed to identify changes in the strength, direction, momentum, and duration of a trend in a security's price.
History Gerald Appel created the MACD line in the late 1970s. Thomas Aspray added the histogram feature to Appel's MACD in 1986.
The three major components and their formula 1. The MACD line: First, "PM Colored MACD" employs two Moving

Previous Period High Low . This indicator shows the previous Day, Week, Month and Years High and Low. It's great for price action strategies. : Provides clear and visible breaks in structure. : Easy to see breakout levels. : Easy to see gaps between previous high, low levels after breakouts have occurred. The indicator works on every time frame. Multiple periods can be selected and be seen on the same chart. Every line can be customized to Your liking. Color, style and thickness. Enjoy!
RumahForexID Momentum Scalping Indicator is the best momentum indicator ever created, and why is that? The indicator works on all timeframes and assets, the indicator is made after 6 years of experience in forex. You know many momentum indicators on the internet are unhelpful, and difficult to trade, but RumahForexID Momentum Scalping Indicator is different , The indicator shows wave momentum, when the market is about to trend or consolidate, all that in one simple and clear indicator!
RumahFo
Bu gösterge, yüksek kazançlı sinyal alım satımları oluşturmak için birden fazla gösterge kullanır R Sinyalleri göstergesi, grafikte doğru alış ve satış oklarını basan eksiksiz bir FX ticaret sistemidir.
Gösterge, ana MT4 grafik penceresinde renkli yeşil ve kırmızı oklar olarak görünür.
Alım satım yaparken tek bir gösterge tarafından üretilen sinyalleri kullanmak riskli olabilir. Bunun nedeni, işlem yapmak için yalnızca bir gösterge kullanmanın daha fazla yanlış sinyal verebilmesidir. Bu neden
Bu gösterge, 2 ürünümüz Advanced Currency IMPULSE with ALERT + Currency Strength Exotics 'in süper bir kombinasyonudur.
Tüm zaman dilimleri için çalışır ve 8 ana para birimi artı bir Sembol için grafiksel olarak güç veya zayıflık dürtüsünü gösterir!
Bu Gösterge, Altın, Egzotik Çiftler, Emtialar, Endeksler veya Vadeli İşlemler gibi herhangi bir sembol için para birimi gücü ivmesini göstermek için uzmanlaşmıştır. Türünün ilk örneğidir, Altın, Gümüş, Petrol, DAX, US30, MXN, TRY, CNH vb. içi

Çoğu trader ZigZag’ı yanlış kullanır.
Bu araç piyasayı anlamaya yardımcı olmaz — aksine yanlış sinyaller üretir ve trend algısını bozar.
Valable ZigZag bu sorunu çözer ve fiyat hareketinin gerçek yapısını ile piyasa yönünü gösterir.
Klasik ZigZag’ın sınırlamaları Klasik ZigZag çok fazla harekete tepki verir. Bunun sonucu olarak: küçük geri çekilmeler bile önemli değişimler gibi görünür seviye kırılımları sinyal olarak algılanır ancak devam etmez düzeltme ile gerçek trend dönüşünü ayırt etmek z
FREE
ALL MOVING AVERAGES: Çeşitli Stratejiler için Nihai Özel Gösterge ALL MOVING AVERAGES özel göstergesi, en popüler 31'den fazla hareketli ortalamanın etkileyici bir koleksiyonuna sahip, derinlemesine teknik analiz için vazgeçilmez aracınızdır. Hem deneyimli yatırımcılar hem de yeni başlayanlar için tasarlanan bu gösterge, hareketli ortalamalarınızı çok çeşitli işlem stratejilerine mükemmel şekilde uyarlamanıza olanak tanıyan eşsiz bir esneklik sunar. Dönemler ve farklı fiyat hesaplama türleri dah
FREE
Higher High and Lower Low Scanner MT4 , fiyat hareketi ticaret stratejilerini geliştirmek isteyen MetaTrader 4 kullanıcıları için tasarlanmış gelişmiş bir ticaret göstergesidir. Bu araç, önemli salınım noktalarını ve trend tanımlayıcı desenleri etkili bir şekilde belirlemek için fraktal analizi kullanarak, forex, hisse senetleri ve kripto para birimleri gibi çeşitli piyasalardaki tüccarlar için paha biçilmez bir varlık haline gelmektedir. Bu gösterge, görsel sinyaller aracılığıyla yukarı ve aşağ
FREE

MT4 için R 2EMA Renk göstergesi, 2 EMA'nın geçişine dayalı sağlam alım satım sinyalleri sağlar.
Anahtar noktaları Fiyat iki yeşil EMA'nın üzerine çıkıp kapandığında, bir alım satım sinyali oluşturur. Fiyat iki kırmızı EMA'nın üzerine çıkıp kapandığında, bir satış sinyali oluşturur. R 2EMA Renkli Forex göstergesi, ne zaman alım satım zamanı geldiğini belirlemeyi daha da kolaylaştırır
2 EMA satırı yeşile döndüğünde bir satın alma sinyali oluşur. 2 EMA çizgisi kırmızıya döndüğünde bir satış siny
FREE
R Var Hareketli Ortalama Göstergesi, zorlu trend takipçileri için tasarlanmış bir trend takip göstergesidir.
Hisse senedi tüccarları ve emtia tüccarları arasında oldukça popüler bir forex ticaret göstergesidir ve popülaritesi, kullanıcılarına gerçek para kazanma sinyalleri verme yeteneğinden kaynaklanmaktadır.
Gösterge, bir sienna çizgisi üzerine yerleştirilmiş yeşil ve kırmızı noktalardan oluşur. Yeşil nokta yükseliş sinyalini, kırmızı nokta ise düşüş sinyalini gösteriyor.
Temel Ticaret Sin
FREE

R 3MA Çapraz göstergesi, 3 hareketli ortalamanın kesişmesine dayalı uyarıları olan popüler bir trend göstergesidir; daha hızlı, orta ve daha yavaş hareketli bir ortalamadan oluşur.
Anahtar noktaları Daha hızlı hareket eden ortalama hem orta hem de daha yavaş hareket eden ortalamayı yukarı doğru geçtiğinde bir satın alma uyarısı oluşur.
Daha hızlı hareket eden ortalama hem orta hem de daha yavaş hareket eden ortalamayı aşağıya doğru geçtiğinde bir satış uyarısı oluşur.
Onunla ticaret nasıl ya

R Stoploss Sinyalleri göstergesi, üstel hareketli ortalamayı izleyen bir trendi temel alır.
Bu forex göstergesi, aktivite tablosunda çizilen mavi ve kırmızı çizgiler şeklinde alım satım sinyalleri üretir.
Mavi renkli çizgiler, trendin yukarıya doğru olduğunu gösterir ve bu, döviz çiftini satın almak için bir sinyaldir. Kırmızı renkli çizgiler, trendin aşağı yönlü olduğunu gösterir ve bu, döviz çiftini satma sinyalidir. Bu forex göstergesine önerilen bir stop-loss hattı da dahildir.
Satın alm
UR Gama (Makine Öğrenimi sistemlerinde bulunan benzer hesaplamalarla desteklenir)
UR Gamma, klasik WaveTrend göstergesine yeni ve geliştirilmiş bir bakış açısı sunan son teknoloji bir finansal analiz aracıdır. UR Gamma, gelişmiş Dijital Sinyal İşleme tekniklerini birleştirerek, geleneksel WaveTrend algoritmalarının bazı sınırlamalarını giderir ve fiyat hareketindeki eğilimleri belirlemeye ve ölçmeye yönelik daha doğru, sağlam ve dinamik bir yaklaşım sağlar.
UR Gamma kullanmanın avantajları:

R Wavy Dash göstergesi, fiyat verilerini ticarete giriş ve çıkış için çalışan mükemmel bir trend takip eden sinyaller göstergesine dönüştürür. Ana grafikte renkli bir sinyal çizgisi olarak görünür ve bağımsız bir ticaret aracı olarak kullanılabilir.
R Wavy Dash göstergesi çok güvenilirdir, hafiftir ve ticaret platformunuzu yavaşlatmaz.
Anahtar noktaları Trend sinyali göstergesi Çaylak dostu yeniden boyanmaz Gösterge koleksiyonunuza eklemeye değer Bu gösterge, olası bir trend tersine çevirme o
FREE

Metatrader 4 için R İç Çubuk göstergesi, iç çubuklara dayalı olarak kullanımı kolay fiyat kırılma seviyeleri sağlar.
Saf fiyat hareketi üzerinde çalışır ve hiçbir şekilde yeniden boyamaz ve ana MT4 grafik penceresinde gerçek iç çubuğun üstünde ve altında 2 renkli yatay çizgi şeklinde açılır.
Yeşil yatay çizgi direnç görevi görür ve kırmızı çizgi destek görevi görür.
Uzun ve kısa ticaret fikri Şamdan yeşil iç çubuk çizgisinin üzerinde kapanıyorsa ve genel eğilim yukarı yönlüyse bir satın alma

R Delta RSI göstergesi, hızlı bir RSI (periyot 14) ve yavaş RSI'nin (50 periyodu) bir sinyal seviyesiyle kesişmesine dayalı olarak renkli bir alış ve satış histogramı çizer.
Kırmızı renkli bir histogram, trendin yükselişe geçtiğini gösterir (alış sinyali). Yeşil renkli bir histogram, trendin düşüş eğiliminde olduğunu gösterir (satış sinyali). Gri renkli bir histogram, trendin düz veya aralığa bağlı olduğunu (sinyal yok) gösterir.
Bu forex göstergesi, tek başına veya diğer trend takip gösterge
UR Bantları (Makine Öğrenimi sistemlerinde kullanılan bir Formül ile)
UR Bantları, prensip olarak makine öğrenimi sistemlerinde kullanılanlara benzer olan piyasa oynaklığını içeren bir formül aracılığıyla türetilen bir göstergedir. Piyasa koşullarının bu matematiksel temsili, finansal piyasaların doğasında var olan oynaklığı hesaba katarak, fiyat eğilimlerinin ve dinamiklerinin kesin bir analizini sunar. Volatiliteyi bir değişken olarak dahil eden gösterge, piyasa koşullarının daha doğru ve gü

Metatrader 4 için R Show Ticks göstergesi, ana ticaret penceresinde gerçek zamanlı olarak yukarı/aşağı tikleri gösterir.
Temel Çıkarımlar Beyaz ok bir yükseliştir. Kırmızı ok bir düşüş işaretidir. Gösterge, tercih ettiğiniz herhangi bir döviz çifti ve zaman çerçevesi için çalışır.
Gösterge Özellikleri İşlem Platformu: Metatrader 4 (MT4) için geliştirildi
Döviz çiftleri: Herhangi bir çift için çalışır
Zaman dilimleri: Herhangi bir zaman dilimi için çalışır
Giriş Parametreleri: Giriş sembolü
FREE
Pivot Classic, Woodie, Camarilla, Fibonacci and Demark Floor/Classic Pivot noktaları veya basitçe pivotlar, bir varlığın en yüksek, en düşük ve kapanış değerlerini inceleyerek potansiyel destek/direnç seviyelerini, alım satım aralıklarını, trend dönüşlerini ve piyasa duyarlılığını belirlemek için kullanışlıdırlar. Floor/Classic Pivot Noktaları şu şekilde hesaplanabilir. Pivot Point (P) = (High + Low + Close)/3 S1 = P * 2 - High S2 = P - (High - Low) S3 = Low – 2*(High - P) R1 = P * 2 - Low R2 =
FREE
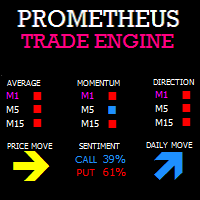
Prometheus Trade Engine is an indicator that combines price action, ratio based indicator with custom indicators& other lagging indicators to create this leading indicator that has a multi-timeframe approach to trading so that you are able to see what other timeframes are doing all in one chart and give you high probability trade setups to assist you to make a prediction on what is MOST likely to happen in the market going foward
Chart Features 1. Reversal Zone
It is the rectangular box on you
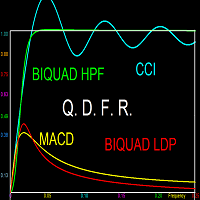
This indicator does not process the price chart data and does not provide trading signals. Instead, it is an application to compute and display the frequency response of many conventional indicators. Moving averages like the SMA, LWMA and EMA, and oscillators like the MACD, CCI, Awsome Osc, all have the form of digital filters. Electronic engineers use a special method to characterise the performance of these filters by studying their frequency response. Two important quantities of the freque
FREE
This Amazing Signal Entry indicator is designed for signal trading. This indicator generates trend signals.
It uses many algorithms and indicators to generate this signal. It tries to generate signals from the points with the highest trend potential.
This indicator is a complete trading product. This indicator does not need any additional indicators.
The indicator is never repainted. The point at which the signal is given does not change. When the signal comes the arrows are put back one

Investment Castle Multi-Timeframe Moving Average — Trends & Pullbacks, One Chart
Unlock the market with the Investment Castle Multi-Timeframe Moving Average. Identify trends and pullbacks across several timeframes on one convenient chart — a must-have for any serious trader who wants the bigger picture without switching charts.
What it does for you Multi-timeframe on one chart: see the moving-average picture across timeframes at a glance. Spot trends and pullbacks: know the direction and where
FREE
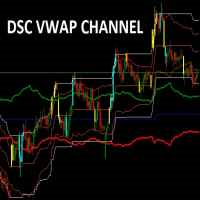
Corretora recomendada para usar esse indicador: https://tinyurl.com/5ftaha7c
Indicador usado para sabermos os pontos de suporte de resistência no gráfico. Funciona em todos ativos e timeframes.
Acerte exatamente os pontos de entradas e saídas das suas operações. SEE OUR RESULTS ON INSTAGRAM: https://www.instagram.com/diogo.cansi/ TELEGRAM GROUP = https://t.me/robosdsc More information by email dscinvestimentos@gmail.com or by Whatsapp 55-991372299
FREE
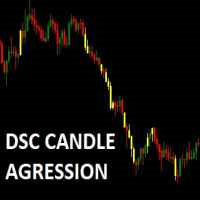
Corretora recomendada para usar esse indicador: https://tinyurl.com/5ftaha7c Indicador que pinta o candle de amarelo em pontos de muita agressão no mercado. Sempre que o mercado for se movimentar o candle irá ficar amarelo. Valido para todos ativos e todos timeframes. SEE OUR RESULTS ON INSTAGRAM: https://www.instagram.com/diogo.cansi/ TELEGRAM GROUP = https://t.me/robosdsc More information by email dscinvestimentos@gmail.com or by Whatsapp 55-991372299
FREE
"STOP GUESSING. START TRADING WITH A CLEARER PLAN."
Clear buy and sell signals, built-in exit guidance, and smarter risk management — all in one simple tool. Get Trend Reverting PRO for FREE with your purchase of DayTradingArrow v1 — at no extra cost!
Hey trader, let’s talk about something we all know too well.
You open your charts, look for a good opportunity, and try to figure out when to enter or exit the market. But with price moving up and down, all that market noise can make even a s

Deviation has a buy and sell input. Figure out the number to trade by. It is according to MACD. Study the values of the past for inputs to trade by. Use in uptrend or downtrend and follow the bigger trend for entry points or reversals. Use other filters or strategies to employ with the indicator for success. - is buy and + is sell. Trade on time frames according to your wish
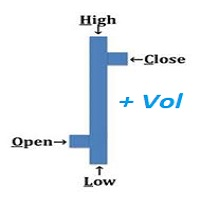
An "Intraday" indicator makes no sense anymore above H1 !! VOHLC is calculated using the following formula: VOHLC= ( Price * Volume ) / Volume Where Price= ( Open + High + Low + Close ) / 4 Volume= Tick Volume This indicator helps us to understand the current direction of the trend in the selected period. Typically, the indicator is calculated for one day, so there is no reason to use it on timeframes larger than the H1 timeframe.

Bu, 3Bar_Play olarak bilinen Fiyat Eylemine dayalı bir stratejidir ve 3Bar şamdan formasyonuna dayalıdır. Al/sat sinyal okları çıkmadan önce filtre ve onaylar için ek göstergeler eklenir. Bir yükseliş trendinde, düşüş trendinde veya yatay piyasada işlem görebilir. Eklenen göstergeler şunları içerir: Stokastik - Momentum Balıkçı - Trend ATR - Sinyal okunun tabanındaki Kaybı Durdur yerleşimini de açıkça tanımlayan Oynaklık (ATR Kaybı Durdurma yöntemini kullanarak). Ödül Riski, iyi bir risk yöneti

R Silver Trend göstergesi, mevcut trendi doğrudan Metatrader 4 aktivite tablosunda gösteren, trend takip eden bir ticaret göstergesidir.
İki tür mum çeker: Mavi, yükseliş fiyat hareketi içindir. Aşağı yönlü fiyat hareketi için kırmızı.
R Silver Trend göstergesi ile işlem yapmak, tamamen yeni başlayanlar için bile oldukça kolaydır ve ölçeklendirme (M1, M5), günlük işlem (M5, M15, M30) ve salıncak ticaret (H1, H4, D1) para birimleri için kullanılabilir.
Temel ticaret sinyalleri R Silver Trend
FREE

R Wolfe Wave göstergesi, fiyat hareketini analiz eder ve birikmiş verileri güçlü bir Wolfe Wave grafik modeli teknik aracına dönüştürür. Temelde, R Wolfe Wave grafik paterni hem yükseliş hem de düşüş eğilimi gösterebilir ve tüccarların gecikmeli göstergeler olmadan alım satım işlemleri açmasına yardımcı olabilir.
Anahtar noktaları Güçlü Wolfe Wave modellerini tanımlar Gelişmiş tüccarlar için Herhangi bir döviz çifti için çalışır Gösterge koleksiyonunuza eklemeye değer Bu gösterge, herhangi bir
FREE

R Alligator göstergesi Bill Williams tarafından tanıtıldı, 3 düzleştirilmiş hareketli ortalamanın yardımıyla trendi takip ediyor.
Varsayılan olarak aşağıdaki değerler kullanılır: 13 dönemlik düzleştirilmiş hareketli ortalama (Çene olarak bilinir) 8 dönemlik düzleştirilmiş hareketli ortalama (Diş olarak bilinir) 5 dönemlik düzleştirilmiş hareketli ortalama (Dudaklar olarak bilinir)
R Alligator göstergesi, hareketli ortalamaları yumuşatarak yanlış trend işlemlerinin sayısını azaltır.
Temel Tic
FREE

R Scalper Arrow göstergesi, döviz çiftleri için okunması kolay alış ve satış sinyal okları sağlar.
Kısa vadeli eğilimleri tahmin etmek için iyidir. Yukarı ok paritenin kısa vadeli bir yükseliş trendinde olduğunu gösterir. Aşağı ok, paritenin kısa vadeli bir düşüş trendinde olduğunu gösterir. Uzun vadeli işlemler için, zararı durdur'u piplerin altına yerleştirin.
Kısa işlemler için pip başına bir zararı durdur ayarlayın.
ile gidiyorum Bu gösterge, basit hareketli ortalama ve üstel hareketli o

R Chimp Scalper, forex spekülatörleri ve günlük tüccarlar için mükemmel bir ticaret aracıdır.
Bu ölçeklendirme göstergesinin sinyalleri çok nettir ve okunması kolaydır.
Ayrı ticaret pencerelerinde sıfır seviyesinin üstüne ve altına yeşil ve kırmızı çubuklar çizin: Yeşil çubuklar, sıfır seviyesinin üzerinde sıralanarak yükseliş spekülasyon eğilimini gösteriyor. Kırmızı çubuklar, sıfırın altında sıralanarak, aşağı yönlü bir ölçeklendirme trendini gösteriyor. Sıfır seviyesinin üzerindeki gösterg
Trend Rising, özel bir MT4 (Metatrader 4) göstergesidir, birden fazla zaman dilimine dayalı Bill William Göstergelerini kullanarak trendi ve momentum modelini analiz eden TF M30 ve altı ölçeklendirme için en iyi şekilde kullanın. Sonuç olarak, çoğu döviz çiftinde işe yarayan trendin başlangıcını ve sonunu tanımlar. Trend Yükselen göstergesi, Hızlandırıcı Osilatörü ve Müthiş Göstergeye dayalı olarak geliştirilmiştir.
Ana Özellikler Trendin başlangıcını ve bitişini renkli ekran olarak belirle
FREE
MetaTrader Mağazası, alım-satım robotları ve teknik göstergelerin benzersiz bir deposudur.
Yatırımcılara sunduğumuz benzersiz hizmetler hakkında daha fazla bilgi edinmek için MQL5.community - Kullanıcı Notunu okuyun: alım-satım sinyallerini kopyalama, freelancer'lar tarafından geliştirilen özel uygulamalar, Ödeme Sistemi aracılığıyla otomatik ödemeler ve MQL5 Bulut Ağı.

Alım-satım fırsatlarını kaçırıyorsunuz:
- Ücretsiz alım-satım uygulamaları
- İşlem kopyalama için 8.000'den fazla sinyal
- Finansal piyasaları keşfetmek için ekonomik haberler
Kayıt
Giriş yap
Web sitesi politikasını ve kullanım şartlarını kabul edersiniz
Hesabınız yoksa, lütfen kaydolun