#define GRAPH_WIDTH 750
#define GRAPH_HEIGHT 350
#include <Graphics\Graphic.mqh>
CGraphic ExtGraph;
//+------------------------------------------------------------------+
//| Script program start function |
//+------------------------------------------------------------------+
void OnStart()
{
vector delta=vector::Full(10,10);
delta[0]=0;
//--- delta adımı ile 0'dan 2 pi'ye kadar 101 değer elde et
vector X=delta.CumSum();
//--- X vektörünün her bir değeri için arktanjant değerini hesapla
vector Y=delta.CumSum();
Print("vector delta = \n",delta);
Print("vector X = \n",X);
Print("vector Y = \n",Y);
//--- hesaplanan değerleri vektörlerden dizilere aktar
double x_array[];;
double y_array[];;
X.Swap(x_array);
Y.Swap(y_array);
double array[10];
for(int i=0; i<10; i++)
{
array[i]=MathArctan2(y_array[i],x_array[i]);
}
//--- hesaplanan vektör değerlerinin grafiğini çiz
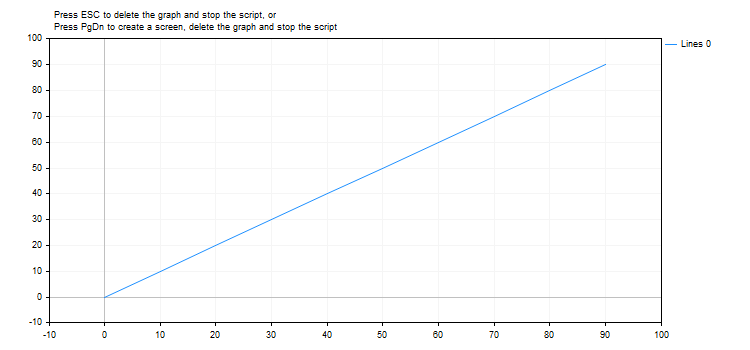
CurvePlot(x_array,y_array,clrDodgerBlue);
//--- grafiği silmek (ekran görüntüsü almak) ve çıkmak için Escape veya PgDn tuşlarına basılmasını bekle
while(!IsStopped())
{
if(StopKeyPressed())
break;
Sleep(16);
}
//--- temizle
ExtGraph.Destroy();
}
//+------------------------------------------------------------------+
//| ESC tuşuna basıldığında 'true' geri döndür |
//| PgDn'a basıldığında grafiğin görüntüsünü al ve 'true' geri döndür|
//| Aksi takdirde, 'false' geri döndür |
//+------------------------------------------------------------------+
bool StopKeyPressed()
{
//--- ESC tuşuna basılırsa 'true' geri döndür
if(TerminalInfoInteger(TERMINAL_KEYSTATE_ESCAPE)!=0)
return(true);
//--- PgDn tuşuna basılırsa ve grafiğin ekran görüntüsü başarıyla alınırsa, 'true' geri döndür
if(TerminalInfoInteger(TERMINAL_KEYSTATE_PAGEDOWN)!=0 && MakeAndSaveScreenshot(MQLInfoString(MQL_PROGRAM_NAME)+"_Screenshot"))
return(true);
//--- 'false' geri döndür
return(false);
}
//+------------------------------------------------------------------+
//| Bir grafiksel nesne oluştur ve bir eğri çiz |
//+------------------------------------------------------------------+
void CurvePlot(double &x_array[], double &y_array[], const color colour)
{
ExtGraph.Create(ChartID(), "Graphic", 0, 0, 0, GRAPH_WIDTH, GRAPH_HEIGHT);
ExtGraph.CurveAdd(x_array, y_array, ColorToARGB(colour), CURVE_LINES);
ExtGraph.IndentUp(30);
ExtGraph.CurvePlotAll();
string text1="Press ESC to delete the graph and stop the script, or";
string text2="Press PgDn to create a screen, delete the graph and stop the script";
ExtGraph.TextAdd(54, 9, text1, ColorToARGB(clrBlack));
ExtGraph.TextAdd(54,21, text2, ColorToARGB(clrBlack));
ExtGraph.Update();
}
//+------------------------------------------------------------------+
//| Ekran görüntüsü al ve görüntüyü bir dosyaya kaydet |
//+------------------------------------------------------------------+
bool MakeAndSaveScreenshot(const string file_name)
{
string file_names[];
ResetLastError();
int selected=FileSelectDialog("Save Picture", NULL, "All files (*.*)|*.*", FSD_WRITE_FILE, file_names, file_name+".png");
if(selected<1)
{
if(selected<0)
PrintFormat("%s: FileSelectDialog() function returned error %d", __FUNCTION__, GetLastError());
return false;
}
bool res=false;
if(ChartSetInteger(0,CHART_SHOW,false))
res=ChartScreenShot(0, file_names[0], GRAPH_WIDTH, GRAPH_HEIGHT);
ChartSetInteger(0,CHART_SHOW,true);
return(res);
}
|