Fan sayfamıza katılın
Öyleyse bir link gönderin -
başkalarının da faydalanmasını sağlayın
- Görüntülemeler:
- 6303
- Derecelendirme:
- Yayınlandı:
-
Bu koda dayalı bir robota veya göstergeye mi ihtiyacınız var? Freelance üzerinden sipariş edin Freelance'e git
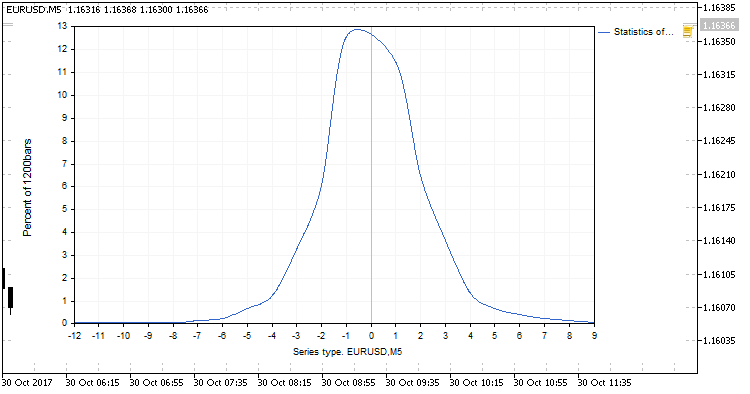
A modification of the Statistics of candles script. Counting the number of series of bullish and bearish bars. Displaying the result as a chart. Saving the screenshot of the resulting chart. The CGraphic class is used.
What's new
- Now two types of statistics on bar series are available for the Y axis:
- The number of series (was available in version 1.xxx);
- Percent of series (new in version 2.xxx).
- Drawing a smoothed chart (new in 2.xxx).
Input Parameters
- Count of bars - the number of bars (from the rightmost bar on the chart), for which the calculation will be preformed;
- Verification - the flag for printing the copied timeseries of this symbol and the resulting array of bar series. NOTE: should only be enabled if the Count of bars parameter does not exceed 15-30. Otherwise the amount of printed data will be very large;
- Save screenShot - enable/disable saving of screenshots of the resulting chart;
- Sleep (milliseconds) - a delay in displaying the resulting chart;
- Output statistics - chart mode: the number of series or the percent of series.

Fig. 1. EURUSD,M5. 1200 bars. Percent.
MetaQuotes Ltd tarafından Rusçadan çevrilmiştir.
Orijinal kod: https://www.mql5.com/ru/code/19323
 DeMarkerValues
The indicator shows a text block with the values of the user defined DeMarker oscillator period for each timeframe.
 WPRValues
The indicator shows a text block with the values of the user defined WRP oscillator period for each timeframe.
 Count of candles in interval (histogram)
The indicator shows the number of bullish and bearish bars in the given interval.
 MAMACD
A strategy based on iMA (Moving Average, MA) and iMACD (Moving Average Convergence/Divergence, MACD).
