KT Horizontal Lines MT4
- Индикаторы
-
KEENBASE SOFTWARE SOLUTIONS
 Keenbase Trading разрабатывает профессиональные индикаторы и советники (Expert Advisors) для MetaTrader 4 и MetaTrader 5, помогая трейдерам принимать более взвешенные торговые решения.
 - Версия: 1.0
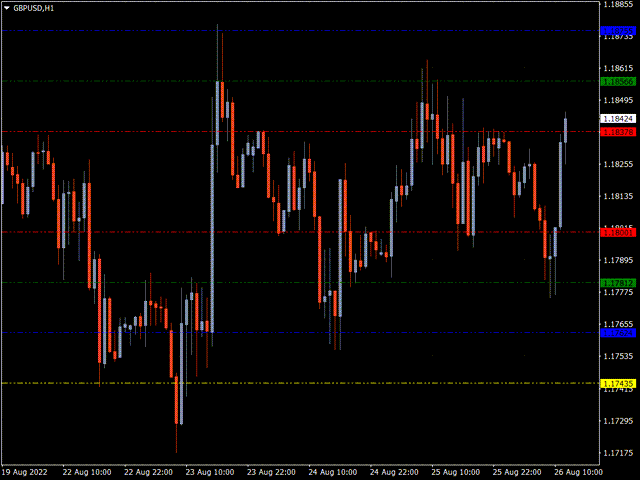
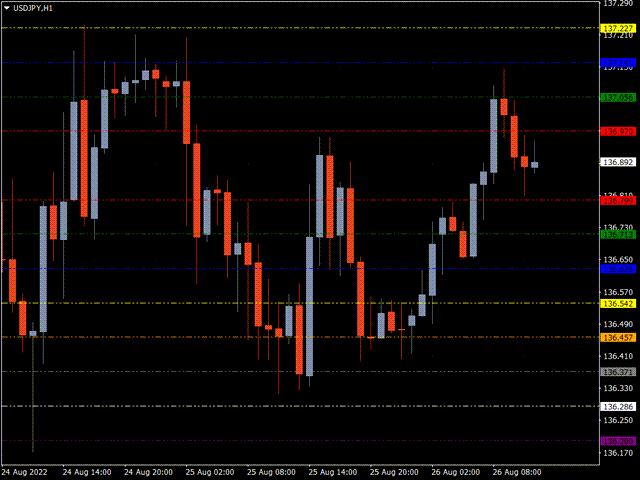
В MetaTrader построение нескольких горизонтальных линий и отслеживание их ценовых уровней может быть утомительным. Этот индикатор автоматически строит горизонтальные линии на равных интервалах для установки ценовых оповещений, отображения уровней поддержки и сопротивления и других ручных целей.
Этот индикатор идеально подходит для начинающих трейдеров на рынке Форекс, стремящихся быстро заработать на покупке и продаже. Горизонтальные линии помогают определить возможные зоны для входа в рынок, как в условиях тренда, так и при флетовом движении.
Особенности
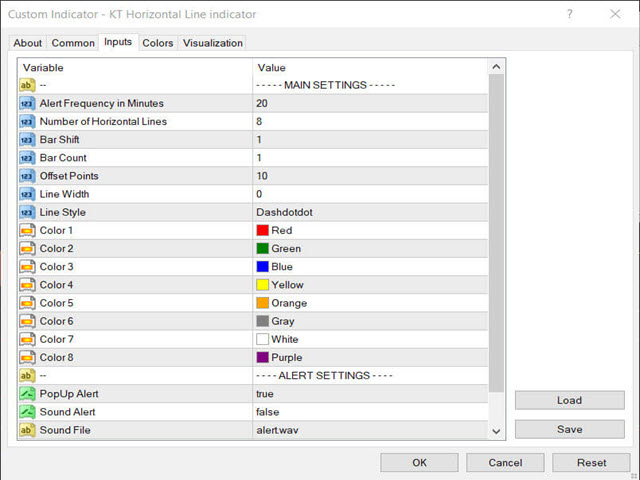
- Может построить несколько горизонтальных линий мгновенно в соответствии с предварительными настройками во входных параметрах.
- Яркая цветовая палитра для различения нескольких горизонтальных линий.
- Незаменимый инструмент для отслеживания диапазона различных торговых сессий.
- Отправляет оповещения при касании ценой горизонтальной линии.
- Возможность задать интервал между оповещениями, чтобы избежать чрезмерных уведомлений.
- Полностью настраиваемый.
Объяснение
Индикатор строит горизонтальные линии на основе инструкций и данных, заданных во входных параметрах. Наблюдение за реакцией цены на горизонтальные уровни помогает определить потенциальные торговые возможности рядом с важными уровнями поддержки/сопротивления.
Например, бычий пин-бар у горизонтального уровня поддержки может указывать на вероятное движение цены к ближайшему уровню сопротивления.
Медвежья свеча, закрывшаяся ниже уровня поддержки, может свидетельствовать о пробое вниз. Ложный пробой горизонтального уровня означает, что цене не удалось пробить важный уровень, и возможен разворот.
Некоторые разворотные модели, такие как пин-бар или ложный пробой, особенно полезны для поиска точек входа на горизонтальных уровнях.