Order Block Scanner

5

** All Symbols x All Time frames scan just by pressing scanner button **

*** Contact me to send you instruction and add you in "Order Block group" for sharing or seeing experiences with other users.

Introduction:

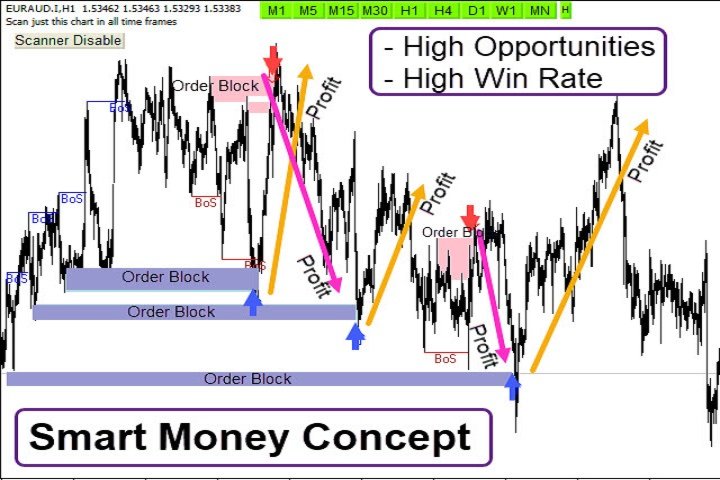
The central banks and financial institutions mainly drive the market, Order block is considered a market behavior that indicates accumulation of orders from banks and institutions, then the market tends to make a sharp move(Imbalance) on either side once the order block is completed. On the other hand, mostly the price pullback to order block zone and then reverse sharply again.

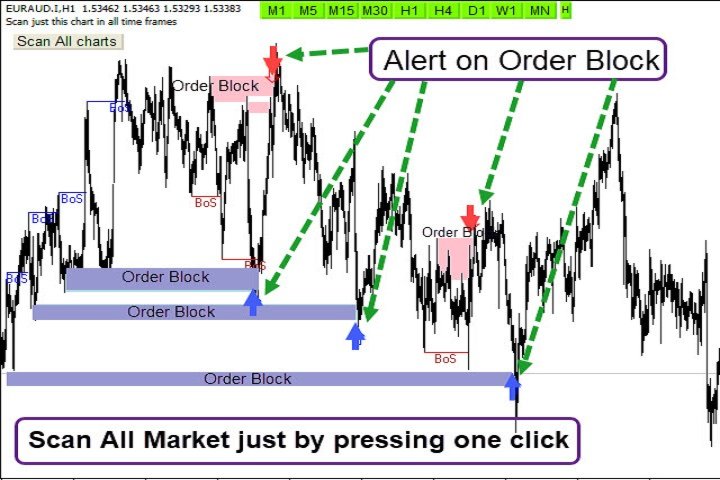
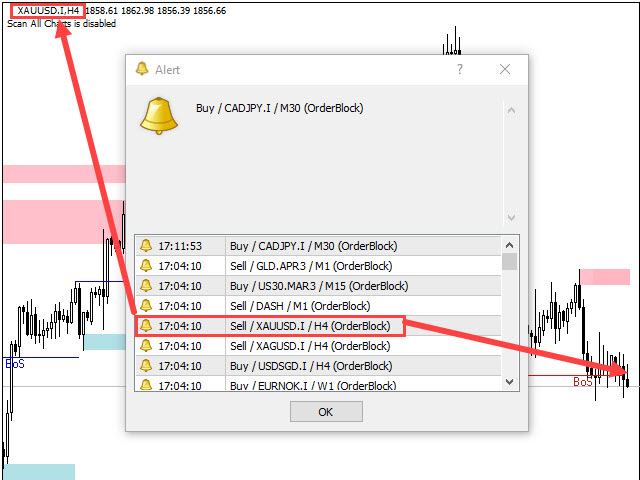
The Order Block Scanner indicator detects imbalance movement, Breakout of Structure(BoS) and order block zones, Also it Scans All market just by pressing one click. 

Main Features:

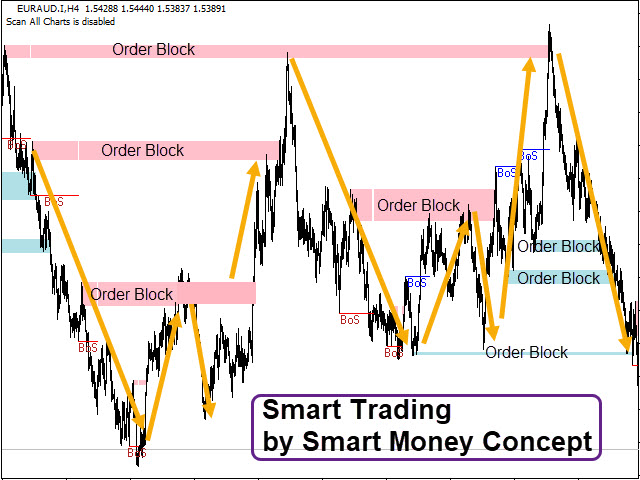
  • Detect the best and most common successful point of reversal trend : Smart Money, Imbalance, BoS, Order Block Zones
  • Easy-to-use and user-friendly indicator
  • NO repaint
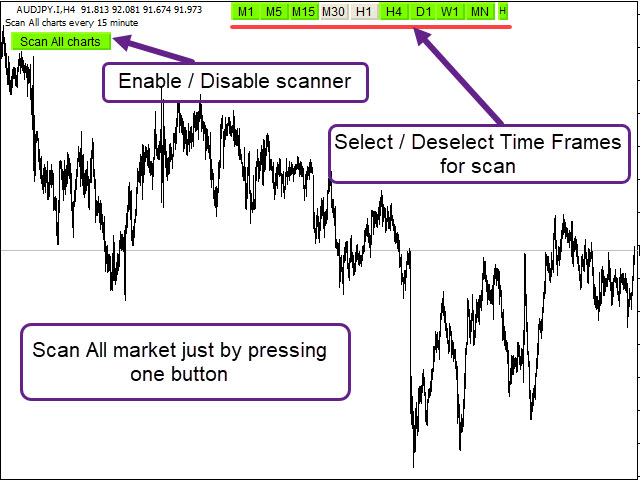
  • Scan All charts button ( Forex, Crypto, Indices and commodities )
  • Select and deselect time frames button for scan (M1,M5,M15,M30,H1,H4,D1,W1,MN)
  • Candlestick check for the best entry point
  • Sending the alert and push notification
  • Alert enable/disable based on your setting time
  • Adjust the pattern setting

How to test:

Contact me to send you tester file. It is free on EURAUD real chart.


Input Parameters :

=========Scanner============

  • Scan All Charts – Enable
  • Scan the number of candles – Amount of history bars to evaluate
  • Re-scan Timer – Re-scan all charts in all time frames after passing time

    ========ALERT SETTINGS ==========

    • Display Alert or Push Notification – Enable or disable Alert or Push Notification
    • How many candles are past a pattern – Maximum Number of candles Passed from a pattern to allow alert
    • Alert Buffer Size – Maximum save alert to prevent duplicate alerts
    • Alert start/end time  – Determine trading hours based on the computer clock to activate and deactivate the alarm

    Отзывы 2
    MissyD1202
    293
    MissyD1202 2023.09.22 11:57 
     

    Very good product and makes trading so much easier. I've bought a few of Reza's scanner indicators and I intend to buy them all in the future.

    elite luis
    3482
    elite luis 2023.02.14 16:57 
     

    Author is very commited, passionated on his indicator scanner and continously make imporvement enhancement, tested on demo reap almost 200 pips during nyc session! this is a priceless scanner should worth alot more than $39!

    Рекомендуем также
    Power Renko is an indicator which plots Renko bricks underneath the chart using a histogram. You can select the brick size and the timeframe of the Renko bricks as well as whether or not to use the close price or the high/low price of the candles. Renko bricks are based on price alone, not time, therefor the Renko bricks will not be aligned with the chart's time. They are extremely useful for trend trading and many different strategies can be formed from them. Buffers are provided allowing you t
    Rira Renko
    Vitor Palmeira Abbehusen
    RENKO on Time Chart This indicator is an enhanced Renko, so you can watch the Renko bricks on the chart to understand price movement more clearly the other improvement is automated box size according to ATR (Average True Range) period you can set the ATR number as you want and the box size of Renko changes automatically based on price movement Inputs Mode: Box size is the input to specify the size of the Renko box you want to print on the chart. This input lets you choose the fixed box siz
    Фильтруйте мелкие движения цен и сосредоточьтесь на более крупном тренде . Индикатор Renko поможет вам отфильтровать мелкие движения цен, чтобы вы могли сосредоточиться на общем тренде. Цена должна пройти заданное расстояние, чтобы сформировать блок Renko. Это упрощает определение текущего направления тренда, в котором движется цена. Многофункциональная утилита : содержит более 66 функций  |   Свяжитесь со мной  если у вас есть вопросы  |    Версия для MT5 В настройках индикатора вы можете наст
    Triple Trend Indicator   is a versatile trend-following tool designed to help traders identify trend strength and potential pullback levels using a three-band system. Each band represents a varying degree of price deviation from the mean, providing progressively stronger trend signals. Key Features: Three Adaptive Bands: The indicator dynamically calculates three bands (1, 2, and 3) based on moving averages   (SMA, EMA, WMA)   and ATR multipliers. Bands are positioned below the price in a
    Remaining Time MT4
    Dhokiyas Money Map Investment Consultants - FZCO
    Candle Remaining Time для MetaTrader 4 Больше никогда не пропускайте закрытие свечи. Торгуйте с идеальной точностью. Утилита точного таймера Candle Remaining Time для MT4 Candle Remaining Time — это легкая и точная утилита для MetaTrader 4, которая отображает точное оставшееся время текущей свечи прямо на графике в режиме реального времени. Инструмент создан для трейдеров, которые полагаются на подтверждение закрытия свечи. Независимо от того, торгуете ли вы скальпинг, внутридневные стратегии,
    FREE
    The indicator allows you to trade binary options. The recommended time frame is М1 and the expiration time is 1,2,3 minutes. The indicator suitable for auto and manual trading. A possible signal is specified as a arrows above/under a candle. You should wait until the candle closes! Arrows are not re-painted Trade sessions: TOKYO section (Half-end) Currency pairs: USD/JPY Working time frame: M1 Expiration time: 1,2,3 minutes. The indicator also shows good results when using the martingale strateg
    FREE
    Price vs Vwap
    Pieter Gerhardus Van Zyl
    Price vs VWAP is a clean, non-repainting indicator that compares raw market price directly against a rolling Volume Weighted Average Price (VWAP) over a configurable time window. It plots two lines in a separate window: the real closing price and a dynamically calculated VWAP based on recent volume and price interaction. By adapting the VWAP lookback to the chart timeframe, it delivers a clear view of value versus execution, helping traders see whether price is trading at a premium or discount.
    Description The Market Profile & Volume Profile Indicator is a powerful technical analysis tool designed to visualize market activity and price distribution over specific timeframes. Unlike standard technical indicators that focus solely on price over time, this indicator organizes price data to show where the market spent the most time (TPO) and where the most volume was traded (Volume Profile). It automatically calculates and displays key structural levels such as the Point of Control (POC) ,
    TMA AI Bands
    Monique Ellen Miranda Dos Santos
    Индикатор TMA AI Bands основан на Треугольной скользящей средней (TMA) с динамическими верхними и нижними полосами и четкими стрелками покупки/продажи, нанесенными непосредственно на график. Он оснащен интегрированным ИИ для адаптивной оптимизации и гарантирует отсутствие перерисовки, предоставляя точные сигналы разворота при касании цены полос. * Пары: работает со всеми валютными парами * Рекомендуемые таймфреймы: D1 / W1 / MN * Настраиваемые внешние переменные:   * TimeFrame – период расч
    Anchored VWAP with Alert
    Trade The Volume Waves Single Member P.C.
    5 (4)
    What is the Volume Weighted Average Price (VWAP)? The volume weighted average price (VWAP) is a trading benchmark used by traders that gives the average price an instrument has traded at throughout the day, based on both volume and price.  It is important because it provides traders with insight into both the trend and value of the instrument. What is the Difference between VWAP and AVWAP? While VWAP is having as starting point the beggining of the day,week,month etc. in the AVWAP you can plac
    Introduction It is common practice for professional trades to hide their stop loss / take profit from their brokers. Either from keeping their strategy to the themselves or from the fear that their broker works against them. Using this indicator, the stop loss / take profit points will be drawn on the product chart using the bid price. So, you can see exactly when the price is hit and close it manually.  Usage Once attached to the chart, the indicator scans the open orders to attach lines for t
    Профиль Рынка (Market Profile) определяет ряд типов дней, которые помогают трейдеру распознать поведение рынка. Ключевая особенность - это область значений (Value Area), представляющая диапазон ценового действия, в котором произошло 70% торговли. Понимание области значений может помочь трейдерам вникнуть в направление рынка и установить торговлю с более высокими шансами на успех. Это отличное дополнение к любой системе, которую вы возможно используете. Blahtech Limited представляет сообществу Me
    Ключевые Особенности  Гистограмма Кумулятивной Дельты – Визуализирует чистый объем покупок против объема продаж в реальном времени. Медианы Объема Покупок/Продаж – Горизонтальные линии, показывающие средние уровни объема покупок и продаж.  Умная Классификация Объема – Разделяет: Сильные Покупки (Зеленый) – Бычье давление. Сильные Продажи (Красный) – Медвежье давление. Медиана Объема Покупок (Синяя Линия) – Ориентир для типичного объема покупок. Медиана Объема Продаж (Оранжевая Линия) – Ориентир
    How TrendMaster Works TrendMaster is a trading indicator designed to streamline and enhance your chart analysis. Using algorithmic logic, it reviews historical price data to generate a dynamic reference line. When price action crosses this line, a "BUY" or "SELL" signal is displayed on your chart. The goal is to assist in identifying potential shifts in price behavior with a clear and user-friendly visual approach. Why Use TrendMaster? The TrendMaster MT4 Indicator helps highlight potential tre
    Rainbow MT4 is a technical indicator based on Moving average with period 34 and very easy to use. When price crosses above MA and MA changes color to green, it’s a signal to buy. When price crosses below MA and MA changes color to red, it’s a signal to sell. The Expert advisor ( Rainbow EA MT4) based on Rainbow MT4 indicator, as you can see in the short video below is now available here .
    FREE
    Индикатор позволяет анализировать изменения тиковых объемов в виде кумулятивных дельта-баров (свечей). Он вычисляет на каждом баре тиковые объемы для покупок и продаж (раздельно), а также их разницу. Кроме того, он может выводить объемы в разбивке по кластерам (ячейкам) цен внутри указанного бара (обычно это последний бар). Данный индикатор производит вычисления аналогично VolumeDelta , но предоставляет иное отображение результатов. Имеется версия для МетаТрейдер 5 - VolumeDeltaBars . Это ограни
    Do you need precision? Tick charts show each change in the ask or bid; The chart updates whenever either price changes. Study the markets more deeply, with surgical precision. Tick Chart Window saves all the received ticks and shows them into a seperate window. Get the best entry price in the Market.               trade with precision trade good  Spread Register In the comment section you will see the highest spread, the lowest spread and the average spread since the indicator was loaded.
    FREE
    Pips forex - готовая торговая система . Этот индикатор показывает стрелками на графике когда и в каком направлении нужно открывать ордер. Если зеленая стрелка, значит открываем сделку на покупку, а если красная стрелка, значит открываем сделку на продажу. Все очень просто и достаточно эффективно. ТейкПрофит ставим 15-25 пунктов. СтопЛосс ставим на уровне точек. Когда точки передвигаются, мы сразу передкигаем СтопЛосс. Рекомендуемый таймфрейм для торговли М1 и М5. Это скальпинговая стратегия и он
    Версия для MT4: https://www.mql5.com/en/market/product/157433 Версия для MT5: https://www.mql5.com/en/market/product/167286 Volume Imbalance — это легкий инструмент визуализации профиля объема + дельта-дисбаланса, разработанный для того, чтобы помочь вам выявить зоны высокой активности, направленное давление и «пустые» ценовые области в пределах настраиваемого диапазона ретроспективного анализа. В отличие от классического профиля объема, который показывает только общий объем, этот индикатор р
    VolumeDeltaM1
    Stanislav Korotky
    3.25 (4)
    Данный индикатор анализирует дельты тиковых объемов. Он отслеживает тики вверх и вниз и подсчитывает на их основе тиковые объемы для покупок и продаж (раздельно), а также их разницу. Кроме того, он выводит объемы в разбивке по кластерам (ячейкам) цен внутри указанного периода баров. VolumeDeltaM1 был создан в дополнение к индикатору VolumeDelta , который использует похожие алгоритмы, но не обрабатывает тики и потому не может применяться на M1. VolumeDelta может показывать данные на любой истории
    Индикатор отображает на графике ренко-бары, вычисляет и отображает по их данным индикаторы Bollinger Bands и Parabolic SAR и выделяет сигналы для покупки/продажи. Ренко - специализированное отображение движения цены, при котором на график выводится бар временного интервала лишь при условии, что цена прошла более заданного количества пунктов. Ренко-бары не привязаны к временному интервалу, поэтому индикатор с одинаковой эффективностью может работать на любом таймфрейме. Сигнал на покупку формируе
    Delta Fusion Pro – Продвинутая Аналитика Order Flow для Внутридневной Торговли Delta Fusion Pro — это профессиональный индикатор для MetaTrader 4, который раскрывает поток агрессивных ордеров, показывая интенсивность и направление институционального давления в реальном времени. В отличие от традиционных объемных индикаторов, он анализирует дельту между объемами Ask и Bid, чтобы предсказывать развороты, подтверждать тренды и выявлять зоны профессионального интереса. Основные Характеристики Инте
    Sentiment Market Indicator: Real-Time Market Sentiment Display The Sentiment Market Indicator is a real-time MQL4 tool that displays current buy/sell sentiment directly on your MetaTrader 4 chart. Designed to support your technical analysis, it provides a visual representation of market positioning to help inform your decision-making process. Key Features Live Sentiment Display View real-time percentage breakdowns of buy vs. sell sentiment. Customizable Alerts Set specific thresholds for buy o
    Last 50 Pips
    Martin Alejandro Bamonte
    Индикатор Last 50 Pips разработан для быстрого определения возможностей покупки и продажи на основе недавнего поведения цен. Он измеряет изменение цены в последних свечах, чтобы выделить желтым моменты, когда цена может менять направление. Сигнал на покупку: Следует открыть позицию ПОКУПКИ , когда индикатор меняется с КРАСНОГО на ЖЕЛТЫЙ , что указывает на изменение от нисходящего тренда к восходящему. Пожалуйста, смотрите изображения, чтобы увидеть, как это просто. Сигнал на продажу: Следует о
    MAD Bands (Moving Average Deviation Bands) MAD Bands are intended to be used when you want to visually check the behavior of price volatility in relation to a moving average. MAD_Bands (MQL4 version) parameter description This document explains the MT4 parameter input screen for each setting item (input parameter). Group: Main (basic settings) Period Default   :       20 Explanation   : The number of candlesticks used to calculate the moving average (Mid) and band width. The larger the value,
    FREE
    Adjustable Consecutive Fractals  looks for 2 or more fractals in one direction and sends out a on screen alert, sound alert and push notification, for strong reversal points . Adjustable Consecutive Fractals, shows the fractals on chart along with a color changing text for buy and sell signals when one or more fractals appear on one side of price. Adjustable Consecutive Fractals is based Bill Williams Fractals . The standard Bill Williams fractals are set at a non adjustable 5 bars, BUT withe th
    Market Profile 3
    Hussien Abdeltwab Hussien Ryad
    3 (2)
    Market Profile 3 MetaTrader 4 indicator  — is a classic Market Profile implementation that can show the price density over time, outlining the most important price levels, value area, and control value of a given trading session. This indicator can be attached to timeframes between M1 and D1 and will show the Market Profile for daily, weekly, monthly, or even intraday sessions. Lower timeframes offer higher precision. Higher timeframes are recommended for better visibility. It is also possible t
    FREE
    Профиль рынка Форекс (сокращенно FMP) Чем это не является: FMP не является классическим отображением TPO с буквенным кодом, не отображает общий расчет профиля данных диаграммы и не сегментирует диаграмму на периоды и не вычисляет их. Что оно делает : Что наиболее важно, индикатор FMP будет обрабатывать данные, которые находятся между левым краем спектра, определяемого пользователем, и правым краем спектра, определяемого пользователем. Пользователь может определить спектр, просто потянув мышь
    FREE
    Overlay Renko is an indicator which plots Renko bricks overtop of the chart. You can select the brick size as well as whether or not to use the close price or the high/low price of the candles. Typically Renko bricks are based on price alone, not time, however unlike normal Renko bricks the only difference is this indicator allows you to see the price action going on within each Brick by overlaying the bricks on top of the standard chart. Renko bricks are extremely useful for trend trading and m
    Trade History Drawer is an indicator for MetaTrader 4. It shows trades on the chart and draws them in customized colors. Furthermore, the indicator shows a trade summary and saves a CSV history file for either one selected pair or all pairs. Inputs General Settings Number Trades : Number of trades to be drawn on the chart, if -1 then all trades Magic Number : Only trades with this magic number, if -1 then ignore Line Style : Line Style Line Thickness : Line Thickness Arrow Size : Arrow Size
    С этим продуктом покупают
    Gann Made Easy - это профессиональная, но при этом очень простая в применении Форекс система, основанная на лучших принципах торговли по методам господина У.Д. Ганна. Индикатор дает точные BUY/SELL сигналы, включающие в себя уровни Stop Loss и Take Profit. ПОЖАЛУЙСТА, СВЯЖИТЕСЬ СО МНОЙ ПОСЛЕ ПОКУПКИ, ЧТОБЫ ПОЛУЧИТЬ ТОРГОВЫЕ ИНСТРУКЦИИ И ОТЛИЧНЫЕ ДОПОЛНИТЕЛЬНЫЕ ИНДИКАТОРЫ БЕСПЛАТНО! Вероятно вы уже не раз слышали о торговли по методам Ганна. Как правило теория Ганна отпугивает от себя не только н
    M1 SNIPER — это простая в использовании торговая система. Это стрелочный индикатор, разработанный для тайм фрейма M1. Индикатор можно использовать как отдельную систему для скальпинга на тайм фрейме M1, а также как часть вашей существующей торговой системы. Хотя эта торговая система была разработана специально для торговли на M1, ее можно использовать и с другими тайм фреймами. Первоначально я разработал этот метод для торговли XAUUSD и BTCUSD. Но я считаю этот метод полезным и для торговли на д
    Инновационный индикатор, использующий эксклюзивный алгоритм для быстрого и точного определения тренда. Индикатор автоматически рассчитывает время открытия и закрытия позиций, а также подробную статистику работы индикатора на заданном отрезке истории, что позволяет выбрать наилучший торговый инструмент для торговли. Вы также можете подключить свои пользовательские стрелочные индикаторы к Scalper Inside Pro для проверки и расчета их статистики и прибыльности. Инструкция и настройки: Читать... Осно
    After purchase, contact me privately to receive 1 month of free testing with EA Forex Proton! This advanced MT4 trading robot automatically executes signals from any MT4 indicator, including Market Makers. The latest version also includes AI integration, allowing each trade signal to be analyzed using Artificial Intelligence. Live Signal with EA Forex Proton: Click here Market Makers is a powerful price action trading system designed to identify high-probability Buy and Sell opportunities based
    Прежде всего стоит подчеркнуть, что этот Торговый Инструмент является Неперерисовывающимся Нерепейнтинговым Индикатором, что делает его идеальным для профессиональной торговли. Онлайн-курс, руководство пользователя и демонстрация. Индикатор Концепций Умного Действия Цены - очень мощный инструмент как для новичков, так и для опытных трейдеров. Он объединяет более 20 полезных индикаторов в одном, комбинируя передовые торговые идеи, такие как анализ Inner Circle Trader и стратегии торговли концеп
    Ultimate Sniper Dashboard
    Hispraise Chinedum Abraham
    4.82 (22)
    Скидка $299! Цены могут вырасти в будущем! Читайте описание ниже! Лучшая система ввода для Ultimate Sniper Dashboard: ПРЕДЕЛЬНЫЕ ДИНАМИЧЕСКИЕ УРОВНИ. (Пожалуйста, проверьте мои продукты) Ultimate Sniper Dashboard работает ТОЛЬКО на реальных рынках из-за ограничений мультивалютного тестирования MT4. Представляем вам Ultimate-Sniper Dashboard! Наша самая лучшая панель, которая содержит HA-Sniper, MA-Sniper и множество специальных режимов. Ultimate Sniper Dashboard - это абсолютный зверь! Лучшее
    Trend Screener
    STE S.S.COMPANY
    4.79 (95)
    Индикатор тренда, революционное уникальное решение для торговли и фильтрации тренда со всеми важными функциями тренда, встроенными в один инструмент! Это 100% неперерисовывающийся мультитаймфреймный и мультивалютный индикатор, который можно использовать на всех инструментах/инструментах: форекс, товары, криптовалюты, индексы, акции. ПРЕДЛОЖЕНИЕ ОГРАНИЧЕННОГО ВРЕМЕНИ: Индикатор скринера поддержки и сопротивления доступен всего за 50$ и бессрочно. (Изначальная цена 250$) (предложение продлено) Tre
    Индикатор " Dynamic Scalper System " разработан для скальпингового метода торговли внутри трендовых волн. Тестировался на основных валютных парах и золоте, возможна совместимость с другими торговыми инструментами. Дает сигналы для кратковременного открытия позиций по тренду с дополнительным сопровождением движения цены. Принцип действия индикатора. Большие стрелки определяют направление тренда. Внутри трендовых волн действует алгоритм генерации сигналов для скальпинга в виде маленьких стрело
    Прежде всего стоит подчеркнуть, что этот торговый индикатор не перерисовывается, не перерисовывает и не отставает, что делает его идеальным как для ручной, так и для роботизированной торговли. Руководство пользователя: настройки, вводы и стратегия. Атомный аналитик - это индикатор ценового действия PA, который использует силу и импульс цены, чтобы найти лучший край на рынке. Оборудованный расширенными фильтрами, которые помогают убирать шумы и ложные сигналы, и повышают торговый потенциал. Испо
    Ultimate Dynamic Levels
    Hispraise Chinedum Abraham
    4.7 (10)
    В настоящее время праздничная скидка составляет $399! Цены могут вырасти в будущем. Читайте описание ниже!   Представляем Ultimate Dynamic Levels - ЛУЧШИЙ индикатор входов для Ultimate Sniper Dashboard! Чрезвычайно низкий риск своевременных входов и высокий RR!!! Найдите Ultimate Sniper Dashboard ЗДЕСЬ. Самая важная способность как для начинающих, так и для профессиональных трейдеров - точно определить, где и когда рынок, скорее всего, развернется, и как безопасно войти в рынок и выйти из него
    Super Signal – Skyblade Edition Профессиональная система трендовых сигналов без перерисовки и без задержек с исключительным процентом выигрышей | Для MT4 / MT5 Лучше всего работает на младших таймфреймах, таких как 1 минута, 5 минут и 15 минут. Основные характеристики: Super Signal – Skyblade Edition — это интеллектуальная система сигналов, специально разработанная для трендовой торговли. Она использует многоуровневую фильтрацию, чтобы выявлять только сильные направленные движения, подкреплённ
    Представляем ON Trade Waves Patterns Harmonic Elliot Wolfe, передовой индикатор, разработанный для обнаружения разнообразных рыночных паттернов с использованием как ручных, так и автоматизированных методов. Вот как это работает: Гармонические паттерны: Этот индикатор может определять гармонические паттерны, появляющиеся на вашем графике. Эти паттерны важны для трейдеров, практикующих теорию гармонической торговли, как это описано в книге Скотта Карни "Гармоническая Торговля том 1 и 2". Независи
    В НАСТОЯЩЕЕ ВРЕМЯ СКИДКА 20%! Лучшее решение для новичка или трейдера-эксперта! Этот индикатор специализирован для отображения силы валюты для любых символов, таких как экзотические пары, товары, индексы или фьючерсы. Впервые в своем роде, любой символ может быть добавлен в 9-ю строку, чтобы показать истинную силу валюты золота, серебра, нефти, DAX, US30, MXN, TRY, CNH и т.д. Это уникальный, высококачественный и доступный торговый инструмент, потому что мы включили в него ряд собственных функци
    Currency Strength Wizard — очень мощный индикатор, предоставляющий вам комплексное решение для успешной торговли. Индикатор рассчитывает силу той или иной форекс-пары, используя данные всех валют на нескольких тайм фреймах. Эти данные представлены в виде простых в использовании индексов валют и линий силы валют, которые вы можете использовать, чтобы увидеть силу той или иной валюты. Все, что вам нужно, это прикрепить индикатор к графику, на котором вы хотите торговать, и индикатор покажет вам ре
    ИНСТРУКЦИЯ RUS  /  INSTRUCTIONS  ENG   -    VERSION  MT5 Основные функции: Отображения активных зон продавцов и покупателей! Индикатор отображает все правильные первые импульсные уровни/зоны для покупок и продаж. При активации этих уровней/зон, где начинается поиск точек входа, уровни изменяют цвет и заливаются определенными цветами. Также появляются стрелки для более интуитивного восприятия ситуации. LOGIC AI - Отображения зон (кружки) поиска точек входа при активации шаблона   Для улучшения ви
    BTMM State Engine Pro is a MetaTrader 4 indicator for traders who use the Beat The Market Maker approach: Asian session context, kill zone timing, level progression, peak formation detection, and a multi-pair scanner from a single chart. It combines cycle state logic with a built-in scanner dashboard so you do not need the same tool on many charts at once. What it does Draws the Asian session range; session times can follow broker server offset or be set in inputs. Tracks level progression (L
    Linear Trend Predictor - Трендовый индикатор сочетающий в себе точки для входа и линии поддержки направления. Работает по принципу пробития ценового канала High/Low. Алгоритм индикатора фильтрует рыночный шум, учитывает волатильность и рыночную динамику. Возможности индикатора Методами сглаживания показывает рыночную тенденцию и точки входа для открытия ордеров BUY или SELL. Подходит для определения краткосрочных и долгосрочных движений рынка, анализируя графики на любых таймфреймах. Адаптивн
    В НАСТОЯЩЕЕ ВРЕМЯ СКИДКА 40% Лучшее решение для новичка или трейдера-эксперта! Этот индикатор является уникальным, высококачественным и доступным торговым инструментом, поскольку мы включили в него ряд собственных функций и новую формулу. С помощью всего лишь ОДНОГО графика вы можете определить силу валюты для 28 пар Форекс! Представьте, как улучшится ваша торговля, потому что вы сможете точно определить точку запуска нового тренда или возможность скальпирования? Руководство пользователя:  
    Easy Breakout
    Mohamed Hassan
    4.71 (14)
    After your purchase, feel free to contact me for more details on how to receive a bonus indicator called VFI, which pairs perfectly with Easy Breakout for enhanced confluence!    Easy Breakout is a powerful price action trading system built on one of the most popular and widely trusted strategies among traders: the Breakout strategy ! This indicator delivers crystal-clear Buy and Sell signals based on breakouts from key support and resistance zones. Unlike typical breakout indicators, it levera
    Trend indicator AI
    Ramil Minniakhmetov
    4.53 (83)
    Индикатор Trend Ai - отличный инструмент, который улучшит анализ рынка трейдером, сочетая идентификацию тренда с точками входа и предупреждениями о развороте. Этот индикатор позволяет пользователям уверенно и точно ориентироваться в сложностях рынка Форекс Помимо первичных сигналов, индикатор Trend Ai определяет вторичные точки входа, возникающие во время откатов или коррекций, позволяя трейдерам извлекать выгоду из коррекции цены в рамках установленного тренда. Важные преимущества: · Работае
    Volatility Trend System - торговая система дающая сигналы для входов.  Система волатильности дает линейные и точечные сигналы в направлении тренда, а также сигналы выхода из него, без перерисовки и запаздываний. Трендовый индикатор следит за направлением среднесрочной тенденции, показывает направление и ее изменение. Сигнальный индикатор основан на изменении волатильности, показывает входы в рынок. Индикатор снабжен несколькими типами оповещений. Может применяться к различным торговым инструмен
    TREND LINES PRO помогает понять, где рынок действительно меняет направление. Индикатор показывает реальные развороты тренда и места, где крупные участники входят повторно. Вы видите BOS-линии смены тренда и ключевые уровни старших таймфреймов — без сложных настроек и лишнего шума. Сигналы не перерисовываются и остаются на графике после закрытия бара. VERSION MT 5     -     Раскрывает свой максимальный потенциал в связке с индикатором  RFI LEVELS PRO Что показывает индикатор: Реальные смены   тр
    Order Block Hunter
    Noha Mohamed Fathy Younes Badr
    5 (10)
    Order block hunter indicator is the best indicator for  hunt the order blocks that area where there has been a large concentration of limit orders waiting to be executed Order blocks are identified on a chart by observing previous price action and looking for areas where the price experienced significant movement or sudden changes in direction .This indicator does that for you by using very complicated codes and helps you to take the best areas To buy and sell because it make marks at the best a
    GOLD Impulse with Alert
    Bernhard Schweigert
    4.67 (12)
    Этот индикатор является супер комбинацией двух наших продуктов Advanced Currency IMPULSE with ALERT  +   Currency Strength Exotics . Он работает на всех временных рамках и графически показывает импульс силы или слабости для 8 основных валют плюс один символ! Этот индикатор специализирован для отображения ускорения силы валюты для любых символов, таких как золото, экзотические пары, товары, индексы или фьючерсы. Первый в своем роде, любой символ может быть добавлен в 9-ю строку, чтобы показат
    Apollo SR Master — это индикатор уровней поддержки/сопротивления со специальными функциями, которые упрощают и повышают надежность торговли с использованием зон поддержки/сопротивления. Индикатор рассчитывает зоны поддержки/сопротивления в режиме реального времени без задержек, выявляя локальные максимумы и минимумы цены. Затем, для подтверждения сформированной зоны поддержки/сопротивления, индикатор выдаёт специальный сигнал, который сигнализирует о том, что зону поддержки/сопротивления можно у
    KT Gaussian Trend Filter сочетает в себе гауссовскую фильтрацию с линейной регрессией для получения точного и ясного анализа тренда. Он генерирует простые сигналы на покупку и продажу, одновременно подчеркивая долгосрочное направление рынка. Особенности Полностью настраиваемый гауссовский фильтр: Регулируйте длину и количество полюсов для тонкой настройки сглаживания и четкости тренда. Улучшение линейной регрессией: Дальнейшее сглаживание сигнала для минимизации ложных сигналов на фоне рыночной
    Advanced Supply Demand
    Bernhard Schweigert
    4.91 (299)
    Специальное предложение – скидка 40% Этот индикатор является уникальным, качественным и доступным инструментом для торговли, включающим в себя наши собственные разработки и новую формулу. В обновленной версии появилась возможность отображать зоны двух таймфреймов. Это означает, что вам будут доступны зоны не только на старшем ТФ, а сразу с двух таймфреймов - таймфрейма графика и старшего: отображение вложенных зон. Обновление обязательно понравится всем трейдерам, торгующим по зонам спроса и пре
    Route Lines Prices - индикатор разработанный для поиска направлений цены. Простой интерфейс индикатора содержит в себе множество алгоритмов поведения цены и расчет будущих направлений. В алгоритмах содержатся расчеты волатильности и сглаживание цены в соответствии с используемыми тайм-фреймами. Индикатор имеет единственный параметр для изменения значений " Calculating price values ". Значение по умолчанию 1 имеет сбалансированную автоматическую форму расчетов, которой можно пользоваться без с
    PRO Renko System - это высокоточная система торговли на графиках RENKO. Система универсальна. Данная торговая система может применяться к различным торговым инструментам. Система эффективно нейтрализует так называемый рыночный шум, открывая доступ к точным разворотным сигналам. Индикатор прост в использовании и имеет лишь один параметр, отвечающий за генерацию сигналов. Вы легко можете адаптировать алгоритм к интересующему вас торговому инструменту и размеру ренко бара. Всем покупателям с удовол
    Easy Reversal is designed to help traders spot turning points in the market with clear buy and sell signals. The indicator is based on the Keltner Channel but improved with a custom calculation that uses ATR and EMA confirmation. This makes it more reliable and less noisy than standard reversal tools.  The signals from Easy Reversal appear directly from peak candlestick behavior, showing you when price action is reaching exhaustion. A buy signal is generated when a candlestick forms a strong r
    Другие продукты этого автора
    **   All Symbols   x   All Timeframes   scan just by pressing scanner button ** *** Contact me  to send you instruction and add you in "M W Scanner group" for sharing or seeing experiences with other users. Introduction: Double Top(M) and Double Bottom(W) is a very repetitive common type of price reversal patterns. Double Top resembles M pattern and indicates bearish reversal whereas Double Bottom resembles W pattern and indicates a bullish reversal that they have  high win  rate. The M W Scanne
    **  All Symbols  x  All Timeframes  scan just by pressing scanner button ** *** Contact me  to send you instruction and add you in "Wolfe Wave Scanner group" for sharing or seeing experiences with other users. Introduction: A Wolfe Wave is created with five-wave patterns in price. It shows supply and demand and a fight towards a balance price. T hese waves of price actions can help traders identify the boundaries of   the trend . Also  It helps forecast how the price will move in the near futur
    **   All Symbols   x   All Timeframes   scan just by pressing scanner button ** - Discount : it is not 50$, it is just 39$. *** Contact me  to send you instruction and add you in "Head & Shoulders Scanner group" for sharing or seeing experiences with other users. Introduction: Head and Shoulders   Pattern  is a very repetitive common type of price reversal patterns. The pattern appears on all time frames and can be used by all types of traders and investors.   The  Head and Shoulders  Scanner in
    **   All Symbols   x   All Timeframes   scan just by pressing scanner button ** Discount: The price is $50$, But now it is just $39, Limited time offer is active. *** Contact me  to send you instruction and add you in "Trend Reversal group" for sharing or seeing experiences with other users. Introduction: Trendlines are the most famous technical analysis in trading . Trendlines continually form on the charts of markets across all the different timeframes providing huge opportunities for traders
    Discount: It will be $39 for a week or for 2 purchases!  Contact me  to send you instruction and add you in group. QM (Quasimodo) Pattern is based on Read The Market(RTM) concepts. The purpose of this model is to face the big players of the market (financial institutions and banks), As you know in financial markets, big traders try to fool small traders, but RTM prevent traders from getting trapped. This style is formed in terms of price candles and presented according to market supply and dem
    **   All Symbols   x   All Timeframes   scan just by pressing scanner button ** ***  Contact me to send you instruction and add you in "Head & Shoulders Scanner group" for sharing or seeing experiences with other users. Introduction: Head and Shoulders   Pattern  is a very repetitive common type of price reversal patterns.   The pattern appears on all time frames and can be used by all types of traders and investors.   The  Head and Shoulders  Scanner indicator  Scans All charts just by pressing
    ** All Symbols x All Timeframes scan just by pressing scanner button ** *** Contact me  to send you instruction and add you in "All Divergences scanner group" for sharing or seeing experiences with other users. Introduction Divergence is a main technique used to determine trend reversing when it’s time to sell or buy because prices are likely to drop or pick in the charts. All Divergence indicator can help you locate the top and bottom of the market. This indicator finds Regular divergences for
    ** All Symbols x All Timeframes scan just by pressing scanner button ** *** Contact me  to send you instruction and add you in "RSI scanner group" for sharing or seeing experiences with other users. Introduction RSI divergence is a main technique used to determine trend reversing when it’s time to sell or buy because prices are likely to drop or pick in the charts. The RSI Divergence indicator can help you locate the top and bottom of the market. This indicator finds Regular divergence for pul
    Market Heartbeat is in your hand! ***  Contact me to send you " Trend Finder indicator " free and add you in "Market Heartbeats group" for sharing or seeing experiences with other users. Introduction The Market Heartbeat indicator with a   special enhanced algorithm   (volume, money flow, cycle of market and a secret value) is a very repetitive trend finder with a high success rate .   Interestingly, this   Winner indicator   indicates that the trend has changed its direction or the end of a tre
    ** All Symbols x All Timeframes scan just by pressing scanner button ** After 18 years of experience in the markets and programming, Winner indicator is ready. I would like to share with you! *** Contact me  to send you instruction and add you in "123 scanner group" for sharing or seeing experiences with other users. Introduction The 123 Pattern Scanner indicator with a special enhanced algorithm is a very repetitive common pattern finder with a high success rate . Interestingly, this Winner in
    **   All Symbols   x   All Time frames   scan just by pressing scanner button ** After 18 years of experience in the markets and programming, Winner indicator is ready. I would like to share with you! ***  Contact me to send you " Trend Finder indicator " free, instruction and add you in "M1 Signal Scanner group" for sharing or seeing experiences with other users. Introduction: M1 Signal Scanner   is the indicator designed scalping M1 time frame to detect Small trend switching in the direction
    Swing Scanner
    Reza Aghajanpour
    4.65 (23)
    ** All Symbols x All Time frames scan just by pressing scanner button ** Discount: The price is $50$, But now it is just $35, Limited time offer is active. *** Contact me  to send you instruction and add you in "Swing scanner group" for sharing or seeing experiences with other users. Swing EA:  https://www.mql5.com/en/market/product/124747 Introduction: Swing Scanner is the indicator designed to detect swings in the direction of the trend and possible reversal swings. The indicator studies sev
    Market Structure
    Reza Aghajanpour
    4.86 (29)
    ** All Symbols x All Timeframes scan just by pressing scanner button ** *** Contact me  to send you instruction and add you in "Market Structure group" for sharing or seeing experiences with other users. Introduction: Market structure is important for both new and professional traders since it can influence the liquidity and price action of a market (Breakout and Retest). It’s also one of the most commonly used techniques to understand trends, identify potential reversal points, and get a feel f
    **   All Symbols   x   All Time frames   scan just by pressing scanner button ** Discount: The price is $50$, But now it is just $35, Limited time offer is active. *** Contact me  to send you instruction and add you in "Swing scanner group" for sharing or seeing experiences with other users. Swing EA:  https://www.mql5.com/en/market/product/124747 Introduction: Swing Scanner   is the indicator designed to detect swings in the direction of the trend and possible reversal swings. The indicator st
    ** All Symbols x All Time frames scan just by pressing scanner button ** *** Contact me  to send you instruction and add you in "Harmonic Scanner group" for sharing or seeing experiences with other users. Introduction Harmonic Patterns are best used to predict turning point. Harmonic Patterns give you high win rate and high opportunities for trade in during one day. This indicator detects the best and successful patterns base on Harmonic Trading books . The Harmonic Patterns Scanner Scans All ch
    Contact me  to send you instruction and add you in group. QM (Quasimodo) Pattern is based on Read The Market(RTM) concepts. The purpose of this model is to face the big players of the market (financial institutions and banks), As you know in financial markets, big traders try to fool small traders, but RTM prevent traders from getting trapped. This style is formed in terms of price candles and presented according to market supply and demand areas and no price oscillator is used in it. RTM conc
    M W Scanner
    Reza Aghajanpour
    5 (11)
    **   All Symbols   x   All Timeframes   scan just by pressing scanner button ** *** Contact me  to send you instruction and add you in "M W Scanner group" for sharing or seeing experiences with other users. Introduction: Double Top(M) and Double Bottom(W) is a very repetitive common type of price reversal patterns. Double Top resembles M pattern and indicates bearish reversal whereas Double Bottom resembles W pattern and indicates a bullish reversal that they have  high win  rate. The M W Scanne
    AI Swing EA Meta5
    Reza Aghajanpour
    5 (1)
    Introduction : AI Swing EA is a fully automated trader with Fixed SL and high win rate. It will be 200$, it is now just 49$. No Martingale, No Grid Contact me  to send you instruction and add you in group. The next generation OpenAI model quickly gained significant attention with its broad range of capabilities and versatility, We used its expertise in assisting prediction prices in formulating and applying improved trading strategies. Our AI core is capable of extracting data insights from
    ** All Symbols x All Timeframes scan just by pressing scanner button ** *** Contact me  to send you instruction and add you in "Channel Scanner group" for sharing or seeing experiences with other users. Introduction: The Channel pattern is described as the area located between two trend lines. This area is used for a measure of a trading range. In this case, the upper trend line connects price highs while the lower trend line connects price lows. Also when it comes to breakout points, it helps t
    ** All Symbols x All Timeframes scan just by pressing scanner button ** After 18 years of experience in the markets and programming, Winner indicator is ready. I would like to share with you! *** Contact me  to send you instruction  and add you in "123 scanner group" for sharing or seeing experiences with other users. Introduction The 123 Pattern Scanner indicator with a special enhanced algorithm is a very repetitive common pattern finder with a high success rate . Interestingly, this Winner in
    ** All Symbols x All Time frames scan just by pressing scanner button ** *** Contact me  to send you instruction and add you in "Harmonic Scanner group" for sharing or seeing experiences with other users. Introduction Harmonic Patterns are best used to predict turning point. Harmonic Patterns give you high win rate and high opportunities for trade in during one day. This indicator detects the best and successful patterns based on Harmonic Trading concepts . The   Harmonic Patterns   Scanner   Sc
    **   All Symbols   x   All Timeframes   scan just by pressing scanner button ** *** Contact me  to send you instruction and add you in "Channel Scanner group" for sharing or seeing experiences with other users. Introduction: The Channel pattern is described as the area located between two trend lines. This area is used for a measure of a trading range. In this case, the upper trend line connects price highs while the lower trend line connects price lows. Also when it comes to breakout points, it
    **   All Symbols   x   All Timeframes   scan just by pressing scanner button ** *** Contact me  to send you instruction and add you in "Market Structure group" for sharing or seeing experiences with other users. Introduction: Market structure is important for both new and professional traders since it can influence the liquidity and price action of a market. It’s also one of the most commonly used techniques to understand trends, identify potential reversal points, and get a feel for current mar
    After 18 years of experience in the markets and programming, Winner indicator is ready. I would like to share with you! ***  Contact me to send you instruction and add you in group for sharing or seeing experiences with other users. Largest Market Cap belongs to Gold, Bitcoin and US30, So they have many traders and great for use in scalping. Gold and Bitcoin Assistant will earn profit on M5 time frames in Gold, Bitcoin and US30. Easy strategy comes from long years experiences, It is a piece of c
    **   All Symbols   x   All Timeframes   scan just by pressing scanner button ** Discount: The price is $50$, But now it is just $39, Limited time offer is active. *** Contact me  to send you instruction and add you in "Trend Reversal group" for sharing or seeing experiences with other users. Introduction: Trendlines are the most famous technical analysis in trading . Trend lines continually form on the charts of markets across all the different timeframes providing huge opportunities for trader
    ** All Symbols x All Time frames scan just by pressing scanner button ** *** Contact me to send you instructions and add you in "Triple MA scanner group" for sharing or seeing experiences with other users. Introduction: The triple moving average strategy involves planning three different moving averages to generate buy and sell signals.  The third moving average is used in combination with the other two moving averages to confirm or deny the signals they generate. This reduces the probability t
    FREE
    ** All Symbols x All Timeframes scan just by pressing scanner button ** ***Contact me to send you instruction and add you in "RSI scanner group" for sharing or seeing experiences with other users. Introduction RSI divergence is a main technique used to determine trend reversing when it’s time to sell or buy because prices are likely to drop or pick in the charts. The RSI Divergence indicator can help you locate the top and bottom of the market. This indicator finds Regular divergence for pullba
    ** All Symbols x All Time frames scan just by pressing scanner button ** *** Contact me  to send you instruction and add you in "Divergence group" for sharing or seeing experiences with other users. Introduction MACD divergence is a main technique used to determine trend reversing when it’s time to sell or buy because prices are likely to drop or pick in the charts. The MACD Divergence indicator can help you locate the top and bottom of the market. This indicator finds Regular divergence for pul
    **   All Symbols   x   All Time frames   scan just by pressing scanner button ** After 18 years of experience in the markets and programming, Winner indicator is ready. I would like to share with you! ***  Contact me to send you " Trend Finder indicator " free, instruction and add you in "M1 Signal Scanner group" for sharing or seeing experiences with other users. Introduction: M1 Signal Scanner   is the indicator designed scalping M1 time frame to detect Small trend switching in the direction
    * All Symbols x All Timeframes scan just by pressing scanner button ** *** Contact me to send you instructions and add you in "Candle Scanner group" for sharing or seeing experiences with other users. Introduction: Candles tell their story. When looking at a candle, it’s best viewed as a contest between buyers and sellers. Candlestick patterns are used to predict the future direction of price movement. Candlesticks are an easy way to understand the price action. You can use candlesticks to decid
    FREE
    Фильтр:
    MissyD1202
    293
    MissyD1202 2023.09.22 11:57 
     

    Very good product and makes trading so much easier. I've bought a few of Reza's scanner indicators and I intend to buy them all in the future.

    Reza Aghajanpour
    93084
    Ответ разработчика Reza Aghajanpour 2023.09.22 22:00
    Thank you for your awesome feedback. ⛱️🏖️🥇🌹🙏
    Enjoy your trading.⭐⭐⭐⭐⭐
    elite luis
    3482
    elite luis 2023.02.14 16:57 
     

    Author is very commited, passionated on his indicator scanner and continously make imporvement enhancement, tested on demo reap almost 200 pips during nyc session! this is a priceless scanner should worth alot more than $39!

    Reza Aghajanpour
    93084
    Ответ разработчика Reza Aghajanpour 2023.02.14 17:14
    Thank you for your awesome feedback. ⛱️🏖️🥇🌹🙏
    Enjoy your trading.⭐⭐⭐⭐⭐
    Ответ на отзыв