OneKey Generate Forex Index

1. Development background

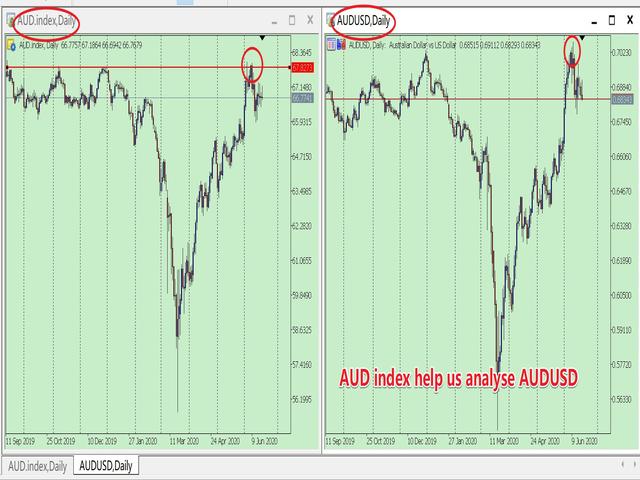
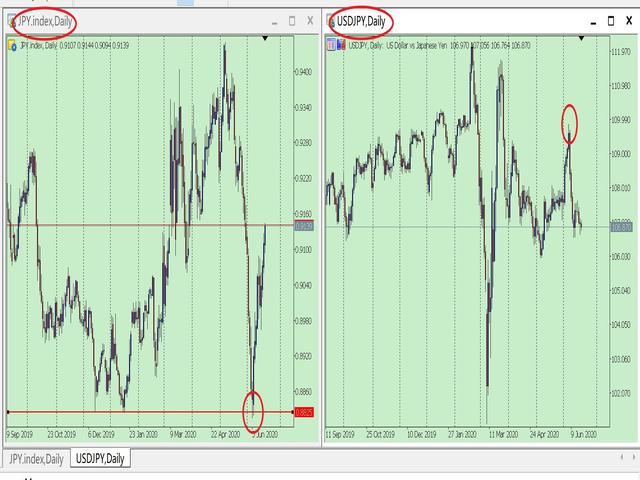
Forex is a ratio, different from futures and the stocks. For example, if EURUSD has risen, it may be that EUR is falling and USDX has fallen even more.  I believe everyone knows that the US dollar index is an essential reference index in forex analysis.  In MT5 client, it is very valuable to see the US dollar index.

Similarly, if you can see the index of other forex in the MT5 client, which is very valuable for trading.  Because the US dollar index is very authoritative,  we can convert other Symbols of indexes according to the US dollar index.

For example:

  • EURUSD = EUR: USD ---> EUR_index = EURUSD * USDX.
  • USDJPY = USD: JPY  ---> JPY_index = USDX / USDJPY.
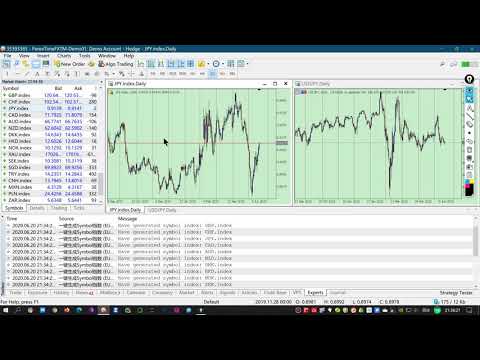
2. What is this

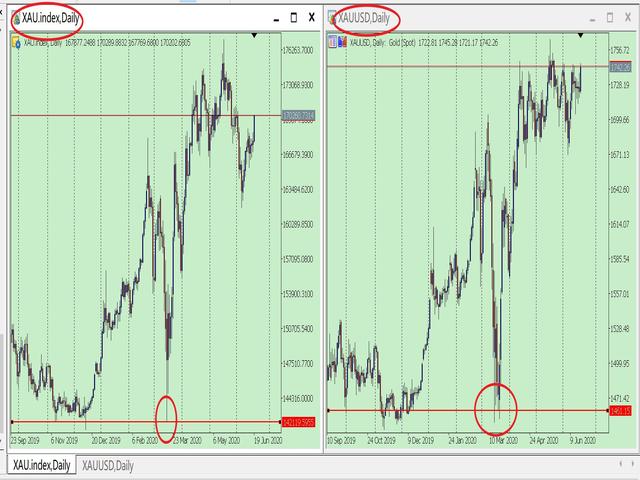
This program can generate custom symbols, each custom symbol is a forex index, such as EUR, GBP, JPY, AUD and so on.  It will be automatically detected and automatically generated.

Note: The forex index generated by this program is converted according to the US dollar index. Because the US dollar index is very authoritative, conversion through the US dollar index is also of great reference value.

3. How to use

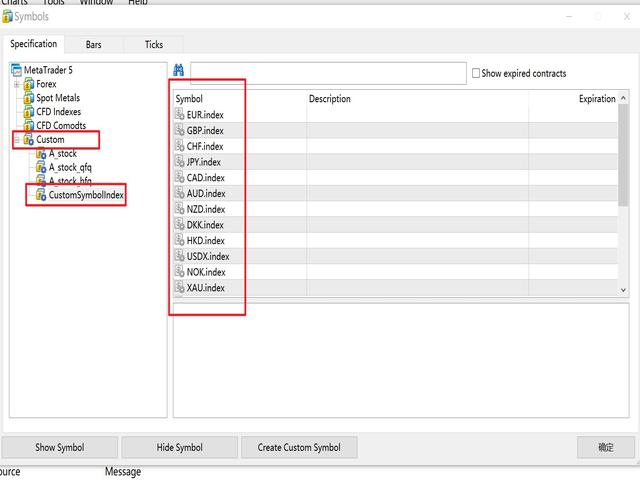
Run the program and it will automatically add custom symbol. To distinguish, all forex index have the suffix ".index" at the end, such as "EUR.index".

Parameter Description:

string foldername = "CustomSymbolIndex"; // The name of the folder saved.

bool bool_MarketSymbol = true;                 // true---Parse Market Watch;  false---Parse Servers.

  • If you select true, it is to parse Market Watch, you can choose your commonly used varieties to generate a custom index. The variety must be against US currency.
  • If you select false, it is to parse all the varieties in the server.

int NameShift=0;    // NameShift, default 0. Usually it doesn't need to change.

  • If the variety name style is "EURUSD" or "EURUSD.abc", set NameShift=0;  But some brokers have a naming style "_EURUSD",  set NameShift=1.

4. Other instructions

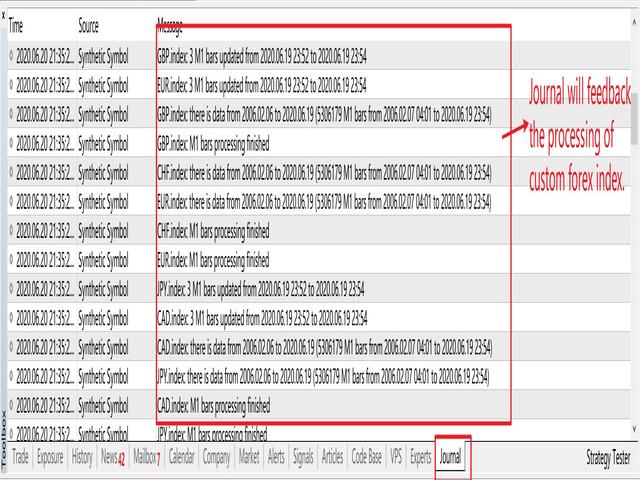
If too many forex index are generated for the first time, the client will perform a lot of operations. You need to wait. Journal will feedback the processing of custom index.

It is a custom symbol, so it can not be directly traded.


Рекомендуем также
Уникальный индикатор, реализующий профессиональный и количественный подход к торговле на возврате к среднему. Он использует тот факт, что цена отклоняется и возвращается к среднему предсказуемым и измеримым образом, что позволяет использовать четкие правила входа и выхода, которые значительно превосходят неколичественные торговые стратегии. [ Installation Guide | Update Guide | Troubleshooting | FAQ | All Products ] Четкие торговые сигналы Удивительно легко торговать Настраиваемые цвета и разме
SPECIAL LAUNCH OFFER: $30 (1-Month Rent) Limited time offer to build our community and gather feedback! AmbM GOLD Institutional Scalper A high-precision M5 algorithm for XAUUSD (Gold) , engineered to trade exclusively at Institutional Liquidity Levels ($5/$10 psychological marks). PERFORMANCE DATA (BUY ONLY) • Win Rate: 87.09%. • Safe Growth: +$4,113 profit on $10k (13.75% Max Drawdown). • Extreme Stress Test: Successfully generated +$22,997 in a 5-year stress test (2020-2026), proving
DF Fib Trader Pro DF Fib Trader Pro — это автоматизированная торговая система, разработанная для MetaTrader 5. Она использует ценовые уровни Фибоначчи в сочетании с анализом тренда и структуры для определения точек входа и выхода. Советник поддерживает как длинные, так и короткие позиции и включает встроенные параметры управления рисками. Основные характеристики: • Использует логику коррекции и расширения Фибоначчи для построения точек входа, стоп-лосса и тейк-профита. • Настраиваемый размер л
FREE
CoPilot dashboard MT5
Frederic Jacques Collomb
CoPilot — Торговая панель дня Знайте свои цифры. Торгуйте с ясностью. MT4 версия Что такое CoPilot? CoPilot — это торговый помощник профессионального уровня , который отображает в режиме реального времени всю статистику дневной производительности прямо на графике — с живой кривой эквити , обновляемой сделка за сделкой. Разработан для активных трейдеров, которым нужна мгновенная видимость торговой сессии без переключения вкладок. CoPilot агрегирует каждую закрытую сделку дня по всем инструментам
RBreaker Gold Indicators — это краткосрочная внутридневная торговая стратегия для фьючерсов на золото, которая сочетает в себе два подхода: трендовое следование и внутридневные развороты. Она позволяет не только получать прибыль при трендовом движении, но и своевременно фиксировать прибыль при развороте рынка, открывая позиции в новом направлении. Данная стратегия на протяжении 15 лет подряд входила в десятку самых прибыльных торговых стратегий по версии американского журнала Futures Truth. Она
Noize Absorption Index - is the manual trading system that measures the difference of pressure between bears forces and bulls forces. Green line - is a noize free index that showing curent situation. Zero value of index shows totally choppy/flat market.Values above zero level shows how powerfull bullish wave is and values below zero measures bearish forces.Up arrow appears on bearish market when it's ready to reverse, dn arrow appears on weak bullish market, as a result of reverse expectation.
Общее описание Этот индикатор — усовершенствованная версия классического канала Дончия с добавлением практических функций для реальной торговли. Помимо стандартных трёх линий (верхняя, нижняя и средняя), система определяет пробои и отображает их на графике стрелками, показывая только линию, противоположную текущему направлению тренда для более чистого восприятия. Индикатор включает: Визуальные сигналы : цветные стрелки при пробое Автоматические уведомления : всплывающие окна, push и email Фильтр
FREE
Caicai L&S Yield Histogram Important Notice: This indicator is an integral tool of the automated EA Caicai Long and Short Pair Trading . This indicator visually displays the percentage deviation (Yield %) of a pair's current spread relative to its own historical mean. It is an excellent tool for quickly visualizing the gross financial potential of a market distortion in Long & Short operations. Main Features: Percentage Visualization: Understand the size of the distortion in palpable percentage
Follow The Line MT5
Oliver Gideon Amofa Appiah
4.6 (35)
This indicator obeys the popular maxim that: "THE TREND IS YOUR FRIEND" It paints a GREEN line for BUY and also paints a RED line for SELL. (you can change the colors). It gives alarms and alerts of all kinds. IT DOES NOT REPAINT and can be used for all currency pairs and timeframes. Yes, as easy and simple as that. Even a newbie can use it to make great and reliable trades. NB: For best results, get my other premium indicators for more powerful and reliable signals. Get them here: https://www.m
FREE
Indicator Description 4 Hull MA Color + Envelopes is a powerful trend-following indicator for MetaTrader 5 that combines four Hull Moving Averages (HMA) with Moving Average Envelopes to clearly identify market direction, trend strength, and potential reversal or pullback zones. This indicator is designed to reduce noise, react quickly to price movement, and provide a clean visual structure for professional trading.   Key Features   4 Hull Moving Averages (20, 50, 100, 200) Automatic color change
FREE
Индикатор SMC Venom Model BPR — профессиональный инструмент для трейдеров, работающих в рамках концепции Smart Money (SMC). Он автоматически идентифицирует на графике цены два ключевых паттерна:  FVG   (Fair Value Gap) — комбинация их трёх свечей, в которой имеется разрыв между первой и третьей свечой. Формирует зону между уровнями, где отсутствует поддержка объемов, что часто приводит к коррекции цены. BPR   (Balanced Price Range)— комбинация двух FVG-паттернов, образующих «мост»  — зону пробо
Magic EA MT5
Kyra Nickaline Watson-gordon
Magic EA is an Expert Advisor based on Scalping, Elliot Waves and with filters such as RSI, Stochastic and 3 other strategies managed and decided with the robot smartly. Large number of inputs and settings are tested and optimized and embedded in the program thus inputs are limited and very simple. Using EA doesn't need any professional information or Forex Trading Knowledge. EA can trade on all symbols and all time frames, using special and unique strategies developed by the author. The EA w
Episode Health Monitor Episode Health Monitor is a trading utility for MetaTrader 5 designed to analyze the real-time condition of active trading positions directly on the chart. The tool evaluates the current “trading episode” - a group of open positions - and provides a structured view of risk, stability, and distance to potential failure. Instead of relying only on profit/loss or price movement, it helps identify whether the current position is stable, weakening, or approaching a critical st
Free automatic Fibonacci is an indicator that automatically plots a Fibonacci retracement based on the number of bars you select on the BarsToScan setting in the indicator. The Fibonacci is automatically updated in real time as new highest and lowest values appears amongst the selected bars. You can select which level values to be displayed in the indicator settings. You can also select the color of the levels thus enabling the trader to be able to attach the indicator several times with differe
FREE
Inverted_Chart_EA Utility Expert Advisor Inverted_Chart_EA creates and maintains a mirror-inverted chart of any symbol and timeframe. It automatically generates a custom instrument (e.g. US30_INV ) and keeps its price history updated in real time, with bars mirrored around a chosen pivot. This utility gives traders a new way to analyze the market from a different perspective by flipping the chart upside down. Why use an inverted chart? Highlight hidden patterns – price formations that look ordin
Trading Utility for Forex Currency Pairs Only not for Gold  Functions Auto Lot Calculation based on Risk Auto stoploss  Auto TakeProfit Breakeven Auto Close Half % Close in percentage with respect to the PIPs Pending Orders BuyLimit Sell Limit with distances BuyStop Sell Stop    with distances Trading Informations Risk in percentage For Multiple trades Combine Takeprofit and Combine Stoplosses
Range Volume Hybrid Generator
Trade The Volume Waves Single Member P.C.
1. Introduction Range Volume Hybrid (RVH) is a MetaTrader 5 Expert Advisor that creates custom chart symbols using a unique dual-condition bar formation method. Unlike traditional charts where bars close based on a single criterion (time, range, or volume), RVH bars close only when BOTH a minimum price range AND a minimum volume threshold are met simultaneously.  Download also and install RVH Monito r Indicator - to control the EA from the custom charts (it's Free)  https://www.mql5.com/en/marke
Are you tired of drawing trendlines every time you're analyzing charts? Or perhaps you would like more consistency in your technical analysis. Then this is for you. This indicator will draw trend lines automatically when dropped on a chart. How it works Works similar to standard deviation channel found on mt4 and mt5. It has 2 parameters: 1. Starting Bar 2. Number of bars for calculation The   starting bar   is the bar which drawing of the trend lines will begin, while the   number of bars for c
FREE
Индикатор Universal Trend создан для обнаружения тенденций движения цены и позволяет быстро определить не только направление тренда, но и понять уровни взаимодействия покупателей и продавцов. Индикатор работает на всех таймфреймах и валютных парах. Индикатор дает достаточно точные сигналы и принято использовать его как на трендовых так и на флетовых рынках. Индикатор желательно использовать в комплексе с другими инструментами для более достоверных сигналов и принятие более взвешеного решения. И
Imagine flying a real aircraft without ever stepping into a flight simulator. That's what trading is like. You have to simulate your strategy before you can take it to a live market. It is good if you can simulate things speedily before even stepping into any live market, or before coming up with an automated system.  People don't have all day to stare at a higher timeframe chart until the entry signal finally arrives. That's why I built this so that you can simulate your strategy with speed. Th
FREE
Second Level Candles And Alligator Indicators 每12秒产生一个K线,而且自带Alligator指标,对超短线选手交易非常有帮助。程序启动时可能不成功,是因为MT5 MqlTick 数据加载少的原因。可以通过修改显示的数据参数避免,比如display=100,程序正常之后再将参数调大 display=300 。如果数据不正常,也可以采用重新加载的方式解决。 如果您对这个指标有任何建议,请联系作者。  Second Level Candles And Alligator Indicators  produced a candle per 12 seconds,include Alligator, it's helpful to Short-Term Trading。You'd better reload the indicator every start MT5 or change display parameter to reslove data bug. Please attach author when  you had some su
FREE
Total trade manager allows you to manage your trade to maximise your profits and minimise your losses. This is an essential for traders that are looking for consistency within their trading.  The features: Partial Stop Loss: This feature allows you to close a partial percentage of your trade once it goes into negative. So if your stop loss is 20 pips, you could close 75% of your trade at 10 pips and let the remainder of the position to continue running. Auto Stop Loss: This means that once you p
Indicator Name: Fibaction – price action candle Detector Description: Fibo Signal Boxes is a powerful Smart Money Concept (SMC)-inspired indicator that auto-detects price action candles. bullish hammers and shooting stars, then draws precise Fibonacci entry zones and multiple take-profit levels directly on the chart. as for the SL personally i use 40 pips rules  Key Features: Detects bullish hammer and shooting star reversal candles. Automatically draws Fibonacci entry and TP boxes. as
It is just an alternative fibo lines. mt4 have is a very strange drawing of fibo lines, this utilites was written for mt4, but for mt5 it may not be particularly useful. A simple Box (Rectangle) graphic element with adjustable levels binding: it is possible to specify up to 17 custom levels, all rectangles on the chart with the given prefix in their name are processed. Levels are specified in % of the height of the rectangle. A convenient graphical element for analyzing charts by growth-correct
FREE
PROMETHEUS TECHNICAN VERSION Free | By THE SONS A gift from The Sons — no strings, no trial, no expiry. Every trader deserves access to professional-grade market intelligence. That belief is why Prometheus Technical Version exists, and why it costs nothing. Consider it our handshake to the trading community. What You're Getting This is not a simplified tool dressed up as a gift. Prometheus Technican Version is a fully built, institutional-quality technical analysis indicator running a dual-model
FREE
Price Magnet — Индикатор зон плотности цены и уровней притяжения Price Magnet — это профессиональный аналитический инструмент, который определяет ключевые уровни поддержки и сопротивления на основе статистической плотности распределения цены (Price Density). Индикатор анализирует заданный исторический период и находит ценовые значения, на которых рынок находился дольше всего. Эти зоны выступают в роли «магнитов» — они притягивают цену или служат фундаментом для разворота. В отличие от стандартны
IMPORTANT NOTE: This is a professional Trade Management Utility and on-chart assistant. It is NOT an automated trading robot. It does not open trades on its own. The UltraFast Trade Manager MT5 is the ultimate execution and risk-management suite designed to give you absolute control over your manual and algorithmic trades. When managing multiple positions, calculating complex net break-even points, or constantly monitoring the economic calendar, hesitation can lead to costly mistakes. This utili
FREE
Scalping Lines System MT5 - торговая система для скальпинга, специально разработанная для торговли на активе "Gold, XAUUSD" на Тайм-фреймах M1 - H1. Сочетает в себе индикаторы для анализа тренда, волатильности и перекупленности/перепроданности рынка, собранные в один осциллятор для определения кратковременных сигналов. Основные внутренние параметры для сигнальных линий уже настроены для работы, для ручного изменения оставлены некоторые параметры, "Продолжительность трендовой волны", регулирующи
FlatBreakout  MT5 (Бесплатная версия) Детектор флэта и пробоев для MT5 — только для GBPUSD FlatBreakout   MT5  — это бесплатная версия профессионального индикатора FlatBreakoutPro MT5, специально предназначенная для анализа флэта и поиска точек пробоя только по паре   GBPUSD . Идеально для трейдеров, которые хотят познакомиться с уникальной фрактальной логикой FlatBreakout MT5  и протестировать сигналы пробоя диапазона на реальном рынке. Для кого этот продукт Для трейдеров, предпочитающих торгов
FREE
High Low Open Close
Alexandre Borela
4.98 (44)
Если вам нравится этот проект, оставьте 5-звездочный обзор. Данный показатель рисует открытые, высокие, низкие и закрывающие цены на указанные период и его можно отрегулировать для специфического часового пояса. Это важные уровни, которые выглядят многие институциональные и профессиональные трейдеры и могут быть полезны для вас, чтобы знать места, где они могут быть больше активный. Доступные периоды: Предыдущий день. Предыдущая неделя. Предыдущий месяц. Предыдущий квартал. Предыдущий год. Или
FREE
С этим продуктом покупают
Trade Assistant MT5
Evgeniy Kravchenko
4.42 (207)
Помогает рассчитать риск на сделку, простая установка нового ордера с помощью линий, управление ордерами с функциями частичного закрытия, 7 типов трейлинг-стопа и другие полезные функции. Дополнительные материалы и инструкции Инструкция по установке - Инструкция к приложению - Пробная версия приложения для демо счета Функция Линии   - отображает на графике линию открытия, стоп-лосс, тейк-профит. С помощью этой функции легко установить новый ордер и увидеть его дополнительные характеристики пе
Добро пожаловать в Trade Manager EA — лучший инструмент для управления рисками, предназначенный для упрощения, точности и эффективности торговли. Это не просто инструмент для размещения ордеров; это комплексное решение для удобного планирования торгов, управления позициями и усиленного контроля над рисками. Независимо от того, начинающий вы трейдер, опытный специалист или скальпер, нуждающийся в быстром исполнении, Trade Manager EA адаптируется к вашим потребностям и работает с любыми активами:
Local Trade Copier EA MT5
Juvenille Emperor Limited
4.96 (134)
Опыт экстремально быстрого копирования сделок с помощью Local Trade Copier EA MT5 . Благодаря простой установке в течение 1 минуты этот копировщик сделок позволяет вам копировать сделки между несколькими терминалами MetaTrader на одном компьютере с Windows или на Windows VPS с крайне быстрыми скоростями копирования менее 0.5 секунды. Независимо от того, новичок вы или профессиональный трейдер, Local Trade Copier EA MT5 предлагает широкий спектр опций, чтобы настроить его под ваши конкретные по
TradePanel MT5
Alfiya Fazylova
4.87 (149)
Trade Panel — это многофункциональный торговый помощник. Приложение содержит более 50 торговых функций для ручной торговли и позволяет автоматизировать большинство торговых операций. Внимание! Скидки действуют ограниченное время, каждый вторник цена будет повышаться на 5$ (до 100$). Перед покупкой вы можете протестировать демоверсию на демо-счете. Скачать пробную версию приложения для демонстрационного аккаунта: https://www.mql5.com/ru/blogs/post/750864 . Полная инструкция здесь . Торговля. Позв
VERIFIED TRADING RESULTS - Farmed Hedge Yield Axi Copy:  https://www.mql5.com/en/signals/2356376 - Farmed Hedge Yield Exn Copy:   https://www.mql5.com/en/signals/2356404 - Farmed Hedge Yield V Copy:  https://www.mql5.com/en/signals/2357156 Contact me via private message to receive the User Manual and Setup Video. * Thai Lauguage Support Available Farmed Hedge Yield Farming - Professional Pair Trading Dashboard (Manual - Hybrid - Semi/Automated EA) VERSION 3 - WILD HARVEST UPDATE Trading A
Бета-версия Telegram to MT5 Signal Trader почти готов к официальному альфа-релизу. Некоторые функции все еще находятся в разработке, и вы можете столкнуться с небольшими ошибками. Если вы заметите проблемы, пожалуйста, сообщите о них, ваша обратная связь помогает улучшать программное обеспечение для всех. Telegram to MT5 Signal Trader — мощный инструмент, который автоматически копирует торговые сигналы из каналов и групп Telegram прямо в ваш счёт MetaTrader 5 . Поддерживаются как публичные, так
Trade Dashboard MT5
Fatemeh Ameri
4.94 (120)
Tired of complex order placement and manual calculations? Trade Dashboard is your solution. With its user-friendly interface, placing orders becomes effortless, by a single click, you can open trades, set stop loss and take profit levels, manage trade lot size, and calculate risk to reward ratios, allowing you to only focus on your strategy. Say goodbye to manual calculations and streamline your trading experience with Trade Dashboard. Download  Demo Version  right now. You can find  Details of
Exp COPYLOT CLIENT for MT5
Vladislav Andruschenko
3.82 (34)
Trade copier for MT5 - копировщик позиций/СДЕЛОК/ордеров для МetaТrader 5  из МТ4/МТ5) Для копирования на терминал MetaTrader 5 между терминалами МТ5 - МТ5, МТ4 - МТ5  для версии COPYLOT MT5 ( или МТ4 - МТ4 МТ5 - МТ4 для версии COPYLOT MT4). Версия МT4 Полное описание +DEMO +PDF Как купить Как установить    Как получить файлы журналов   Как тестировать и оптимизировать    Все продукты от Expforex Вы также можете копировать сделки в терминал МТ4 (МТ4 - МТ4, МТ5 - МТ4):    COPYLOT CLIENT for M
Timeless Charts
Samuel Manoel De Souza
5 (3)
Timeless Charts is an advanced charting solution designed for professional traders seeking for custom charts / custom timeframes , including seconds charts / seconds timeframe, renko charts / renko bars, cluster charts / footprint charts and advanced tools present in most of the popular platforms. Unlike traditional offline charts or simplistic custom indicators, this solution constructs fully custom bars with true timestamp accuracy , down to miliseconds, allowing for a powerful and precise tr
Copy Cat More Trade Copier MT5 (Копи-Кот MT5) — это локальный торговый копировщик и полная система управления рисками и исполнения, разработанная для современных торговых задач. От испытаний проп-фирм до управления личным портфелем, он адаптируется к любой ситуации с сочетанием надежного исполнения, защиты капитала, гибкой настройки и продвинутой обработки сделок. Копировщик работает как в режиме Мастер (отправитель), так и в режиме Слейв (получатель), с синхронизацией в реальном времени рыночны
AntiOverfit PRO: неудобная правда о бэктестах Прежде чем покупать этого EA, остановитесь на минуту. Вы только что нашли систему, которая обещает 250% в год. Бэктест выглядит впечатляюще. Продавец просит $399, а может и $1,999. На бумаге всё выглядит идеально. Но есть проблема: этот бэктест не доказывает того, что вы думаете. Исторический тест сам по себе почти ничего не доказывает. Единственное, что он подтверждает, — эта логика сработала в одной конкретной рыночной последовательности. Как толь
Footprint Chart Pro — Professional OrderFlow EA for MetaTrader 5 Version 6.34 | Professional tool for real traders | Institutional-Grade Visualization DEMO USERS - PLEASE SELECT EVERY TICK / REAL TICK WHEN TESTING AND YOU HAVE DOWNLOADED HISTORICAL DATA. IF YOU SEE A WAITING SCREEN AND IT IS NOT DOWNLOADING, IT MEANS YOU HAVE LOW HISTORICAL DATA. TRY 1 MIN AND 5 MIN FIRST ON 1 DAY DATA. ONE DAY DATA SHOULD BE THE NEWEST AND MOST CURRENT DATE. PLEASE WAIT UNTIL THE MARKET HAS ROLLED OVER PERIOD.
HINN MAGIC ENTRY - лучший инструмент для входа и менеджмента позиций! Выставляет ордера через выбор уровня на графике! полное описание    ::    demo-версия    ::   60-sec-video-description Основные функции: - Рыночные, лимитные и отложенные ордера -  Автоматический подсчет лоттажа  -  Автоматический учет спреда и комиссий -  Неограниченное количество промежуточных тейков для позиций - Перевод в безубыток и трейл стоп-лосса и тейк-профита - Уровни инвалидаций - Интуитивно понятный,  адаптивный,
Trade Assistant 38 in 1
Makarii Gubaydullin
4.91 (23)
Многофункциональная утилита: калькулятор лота, сеточные ордера, индикатор Price Action, менеджер ордеров, рассчёт R/R, и многое другое Демо-веpсия  |   Инструкция  |   Версия для MT4 Утилита не работает в тестере стратегий: вы можете скачать демо-версию ЗДЕСЬ , чтобы протестировать продукт перед покупкой. Напишите мне  если есть вопросы / идеи по улучшению / в случае найденного бага Упроситите и сделайте вашу торговлю быстрее, при этом расширяя стандартные возможности терминала. 1. Открытие но
MT5 to Telegram Signal Provider — это простой в использовании полностью настраиваемый инструмент, который позволяет отправлять определённые сигналы в чат, канал или группу Telegram, превращая вашу учётную запись в провайдера сигналов . В отличие от большинства конкурирующих продуктов, он не использует импорт DLL. [ Демо ]   [ Руководство ] [ Версия MT4 ] [ Версия для Discord ] [ Канал в Telegram ]  New: [ Telegram To MT5 ] Настройка Доступно пошаговое руководство пользователя . Никаких знаний A
Anchor Trade Manager
Kalinskie Gilliam
5 (2)
Anchor: The EA Manager A coordination system for traders running multiple EAs. Anchor ensures only one EA can trade at a time, preventing conflicting positions and keeping your portfolio safer. Attach Anchor to any chart. Configure your EAs and their magic numbers. Anchor handles the rest. Built for portfolios. Built for discipline. Built for prop firms. The Problem Running multiple EAs on the same account creates risk. Two gold EAs can open opposite positions on the same candle. Three EA
Суть: используя юзер-интерфейс вы настраиваете параметры, которым должен соответствовать график до входа в позицию(позиции), настраиваете какие входные модели использовать, настраиваете правила по которым надо завершать торговлю и планирование. А всю рутину по наблюдению за графиком и исполнению  Lazy Trader  берет на себя. полное описание  :: 3 ключевых видео [1] -> [2] -> [3] Что он умеет? - Понимает структуру рынка по Ларри Вильямсу - Понимает Swing-структуру рынка по Майклу Хадлстону (ICT
Trade Manager DaneTrades
Levi Dane Benjamin
4.36 (28)
Trade Manager, который поможет вам быстро входить и выходить из сделок, автоматически рассчитывая риск. Включает функции, которые помогут предотвратить чрезмерную торговлю, торговлю из мести и эмоциональную торговлю. Сделками можно управлять автоматически, а показатели эффективности счета можно визуализировать в виде графика. Эти функции делают эту панель идеальной для всех трейдеров, занимающихся ручной торговлей, и помогают улучшить платформу MetaTrader 5. Многоязычная поддержка. Версия для МТ
The product will copy all telegram signal to MT5 ( which you are member) , also it can work as remote copier.  Easy to set up, copy order instant, can work with almost signal formats, image signal,  s upport to translate other language to English Work with all type of channel or group, even channel have "Restrict Saving Content", work with  multi channel, multi MT5 Work as remote copier: with signal have ticket number, it will copy exactly via ticket number. Support to backtest signal. How to s
Entry In The Zone and SMC Multi Timeframe   is a real-time 2-in-1 market analysis tool that combines market structure analysis and a No Repaint BUY / SELL signal system into a single indicator, built on Smart Money Concepts (SMC) — a widely adopted framework used by professional traders to understand market structure. This indicator helps you see the market more clearly, make decisions based on structure rather than guesswork, and focus on high-probability zones where price is more likely to rea
Торговая панель для торговли в один клик.  Работа с позициями и ордерами!  Торговля с  графика  или  клавиатуры  . Используя нашу торговую панель, вы можете торговать в один клик с графика и совершать торговые операции в 30 раз быстрее, чем стандартное управление MetaTrader. Автоматические расчеты параметров и функций, которые облегчают жизнь трейдеру и помогают трейдеру вести торговую деятельность намного быстрее и удобнее. Графические подсказки и полная информация о торговых сделках на графике
Seconds Chart MT5
Boris Sedov
4.59 (17)
Seconds Chart - уникальный инструмент для создания секундных графиков в MetaTrader 5 . С помощью Seconds Chart вы можете построить график с таймфреймом, заданным в секундах, получая идеальную гибкость и точность анализа, недоступную на стандартных минутных или часовых графиках. Например, таймфрейм S15 обозначает график со свечами продолжительностью 15 секунд. Вы можете использовать любые индикаторы и советники с поддержкой пользовательских символов. Работать с ними так же удобно, как и на станда
Crystal Trade Manager – Advanced MT5 Risk and Trade Control Utility Overview Crystal Trade Manager (CTM) is a professional MetaTrader 5 utility designed for risk management, trade automation, and instant execution control. It provides traders with an integrated system for protecting equity, managing daily drawdowns, controlling lot sizes, and applying automation features such as automatic SL/TP, break-even, and trailing stop. The tool is suitable for manual traders, prop-firm challenge particip
Telegram To MT5 Receiver
Levi Dane Benjamin
4.31 (16)
Копируйте сигналы из любого канала, участником которого вы являетесь (в том числе частного и ограниченного), прямо на свой MT5. Этот инструмент был разработан с учетом потребностей пользователей и предлагает множество функций, необходимых для управления и мониторинга сделок. Этот продукт представлен в простом в использовании и визуально привлекательном графическом интерфейсе. Настройте свои параметры и начните использовать продукт в течение нескольких минут! Руководство пользователя + Демо  |
The News Filter MT5
Leolouiski Gan
4.75 (20)
Этот продукт фильтрует всех экспертных советников и ручные графики во время новостей, так что вам не нужно беспокоиться о внезапных скачках цены, которые могут разрушить ваши ручные торговые настройки или сделки, введенные другими экспертными советниками. Этот продукт также поставляется с полной системой управления ордерами, которая может обрабатывать ваши открытые позиции и ордера на ожидание перед выпуском новостей. После покупки   The News Filter   вам больше не придется полагаться на встроен
Advanced Dashboard Ultra
Mirel Daniel Gheonu
5 (1)
Stats Dashboard & Journal ULTRA для MT5 Полный командный центр трейдинга: Аналитика, Автоматизация и Анализ Новостей. Stats Dashboard ULTRA — это высшая эволюция инструмента аналитики Pro. Он превращает MetaTrader 5 в профессиональную торговую станцию, сочетая анализ эффективности институционального уровня с автоматической защитой от новостей и продвинутыми психологическими метриками. Разработано для ручных трейдеров и управляющих портфелями EA, которым нужен полный контроль. НОВОЕ В ВЕРСИИ ULTR
Ордерная форма, Торговая панель, Управление риском, Ручная торговля, Трейлинг-стоп, Управление ордерами, Быстрое исполнение — JoOrderTrade Pro — панель исполнения для MetaTrader 5 JoOrderTrade Pro — это графическая панель для ручной торговли и управления ордерами в MetaTrader 5. Позволяет быстро открывать сделки, настраивать Stop Loss и Take Profit, а также включает инструменты управления рисками, такие как Trailing Stop, Breakeven и система SP (Save Position). Панель работает в среде MetaTrade
YuClusters
Yury Kulikov
4.93 (43)
Внимание: Ознакомиться с работой программы можно с помощью бесплатной версии  YuClusters DEMO . YuClusters это профессиональная система анализа рынка. Для трейдера открываются уникальные возможности анализа потока ордеров, объемов торговли, движения цены используя различные графики, профили, индикаторы, графические объекты. YuClusters оперирует данными на основе ленты сделок или тиковой информации, в зависимости от того, что доступно в котировках финансового инструмента.  YuClusters позволяет с
EA Auditor
Stephen J Martret
EA AUDITOR - ПРОВЕРЯЙТЕ EA ПЕРЕД ПОКУПКОЙ Единственный независимый инструмент проверки EA и сигналов для MetaTrader 5 ПРИНИМАЙТЕ БОЛЕЕ ВЗВЕШЕННЫЕ РЕШЕНИЯ ПРИ ПОКУПКЕ EA. КАЖДЫЙ РАЗ. На рынке MQL5 представлены действительно выдающиеся советники, созданные талантливыми разработчиками — стратегии, способные изменить ваш трейдинг. Но здесь также можно встретить EA со встроенными читерами истории д
EasyTrade MT5
Alain Verleyen
5 (3)
Easy Trade – Умное, простое и мощное управление сделками Easy Trade — это универсальное решение для управления сделками в MetaTrader для тех, кто хочет держать риск под контролем и обеспечить максимально плавное исполнение ордеров. Созданный с нуля на основе обратной связи от трейдеров, Easy Trade позволяет легко открывать, отслеживать и управлять сделками по множеству символов — без лишней сложности. Независимо от того, скальпируете ли вы вручную или управляете несколькими позициями, Easy Tra
Другие продукты этого автора
This product can be used to synchronize multiple Charts, and each Chart can be set to a different sync mode. With this product you can better view and manipulate charts: different time frames for a single Symbol, the same time frame for multiple Symbols... and more. PS: The link below is the FreeDemo product, you can use it on EURUSD/XUAUSD/USDCNH symbol: https://www.mql5.com/en/market/product/38557 Feature: Chart settings  can be synchronized, including : background, indentation, size, etc. M
This product can be used to synchronize multiple Charts, and each Chart can be set to a different sync mode. With this product you can better view and manipulate charts: different time frames for a single Symbol, the same time frame for multiple Symbols, system indicators for single/multiple Symbols... and more. Feature: Chart settings can be synchronized, including : background, indentation, size, etc. Multiple Chart window start times  or end times can be synchronized. Multiple Chart time fr
Have you ever take a long time to watch a Symbol when the network link is not good ? Have you ever wait for a long time when you switch chart between different Symbols or different TimeFrames ? If you do long-term backtesting , Have you ever to be downloaded datas for a long time ? Yes, If there is no data in the system, those will happen.  1. What is this: Download all the Symbol data in Market Watch to the system. PS: This is not outputting data to Files. This Link go to Demo version: https:/
Do you think it's a bit cumbersome when you need to switch symbols or timeframes with mouse click? 1. What is this? This is a program that can switch symbols and timeframes with direction keys. Fast switching, very convenient, no mouse click required. For traders, one symbol with multi-timeframe charts are usually added,  you can change symbol on those charts easily. For multi-currency traders, different symbol charts are usually added, you can also change those timeframes easily. I wrote this p
1. What is this         Rising volatility and falling volatility are not the same, whether it is academic research or actual testing has shown this point.         The original ATR indicator is calculated by putting up and down fluctuations together. This indicator is to calculate separately the upward volatility and the downward volatility, which can better help you study the market. 2. Indicator description          There are two modes for the calculation of this indicator, as shown in the fo
I see that many tools in the market deal with Position and Order in the form of operation panels. Which is loaded into a Chart in the form of an EA. However, once the operator panel EA is loaded, no other EAs can be loaded. So, I wrote the one-click operation of Position and Order as a script, so you can load other EAs and easily complete one-click operation of Trade. 1. What is this: This is a one-click script to close position order. Now you can close position tickets at high speed, for examp
I see that many tools in the market deal with Position and Order in the form of operation panels. Which is loaded into a Chart in the form of an EA. However, once the operator panel EA is loaded, no other EAs can be loaded. So, I wrote the one-click operation of Position and Order as a script, so you can load other EAs and easily complete one-click operation of Trade. 1. What is this: This is a one-click script to delete the pending order . Now you can delete pending tickets at high speed, for
Do you think it's a bit cumbersome when you need to switch symbols or timeframes with mouse click? 1. What is this? This is a program that can switch symbols and timeframes with direction keys. Fast switching, very convenient, no mouse click required. For traders, one symbol with multi-timeframe charts are usually added,  you can change symbol on those charts  easily . For multi-currency traders, different symbol charts are usually added, you can also change those timeframes easily. I wrote thi
According to trading experience: Some symbols are easy to reverse on certain days, such as Monday, or afternoon, and so on. So comparing the current price with the corresponding historical moment price is valuable. If the price coordinate system uses a logarithmic price, you will get a lot of valuable information. 1. What is this? This program can convert the symbol price and add it to your Chart. You can compare it with your major chart. The DEMO version Link: https://www.mql5.com/en/market/pr
What is this: Violent trading: means sending a large number of orders to your brokerage server,  it can conduct a stress test of the trading. In this program you can run a variety of trading tests.  Now you can trade at high speed, For example 1000 orders in an instant. The Demo version's link:  https://www.mql5.com/en/market/product/38431/ Why to use: Whether manual trading or EA trading,  the status of the broker server is very important. So it is beneficial to conduct a trading stress test on
1. Why did I develop this series of indicators I found that most traders need to use multiple time frame indicators. They usually switch time frame to see indicators. However, once the timeframe is switched, you cannot see the  corresponding relationship  between  the price in the smaller timeframe  and  the indicator in the larger timeframe . For example: if your price chart is in H1 timeframe, you can see H4, D1 and W1 indicators in H1 timeframe Chart. This is more helpful for you to find th
Фильтр:
[Удален] 2020.06.22 04:59 
 

Пользователь не оставил комментарий к оценке

[Удален] 2020.06.21 04:44 
 

Пользователь не оставил комментарий к оценке

[Удален] 2020.06.21 03:04 
 

Пользователь не оставил комментарий к оценке

Ответ на отзыв