Smart Order Blocks

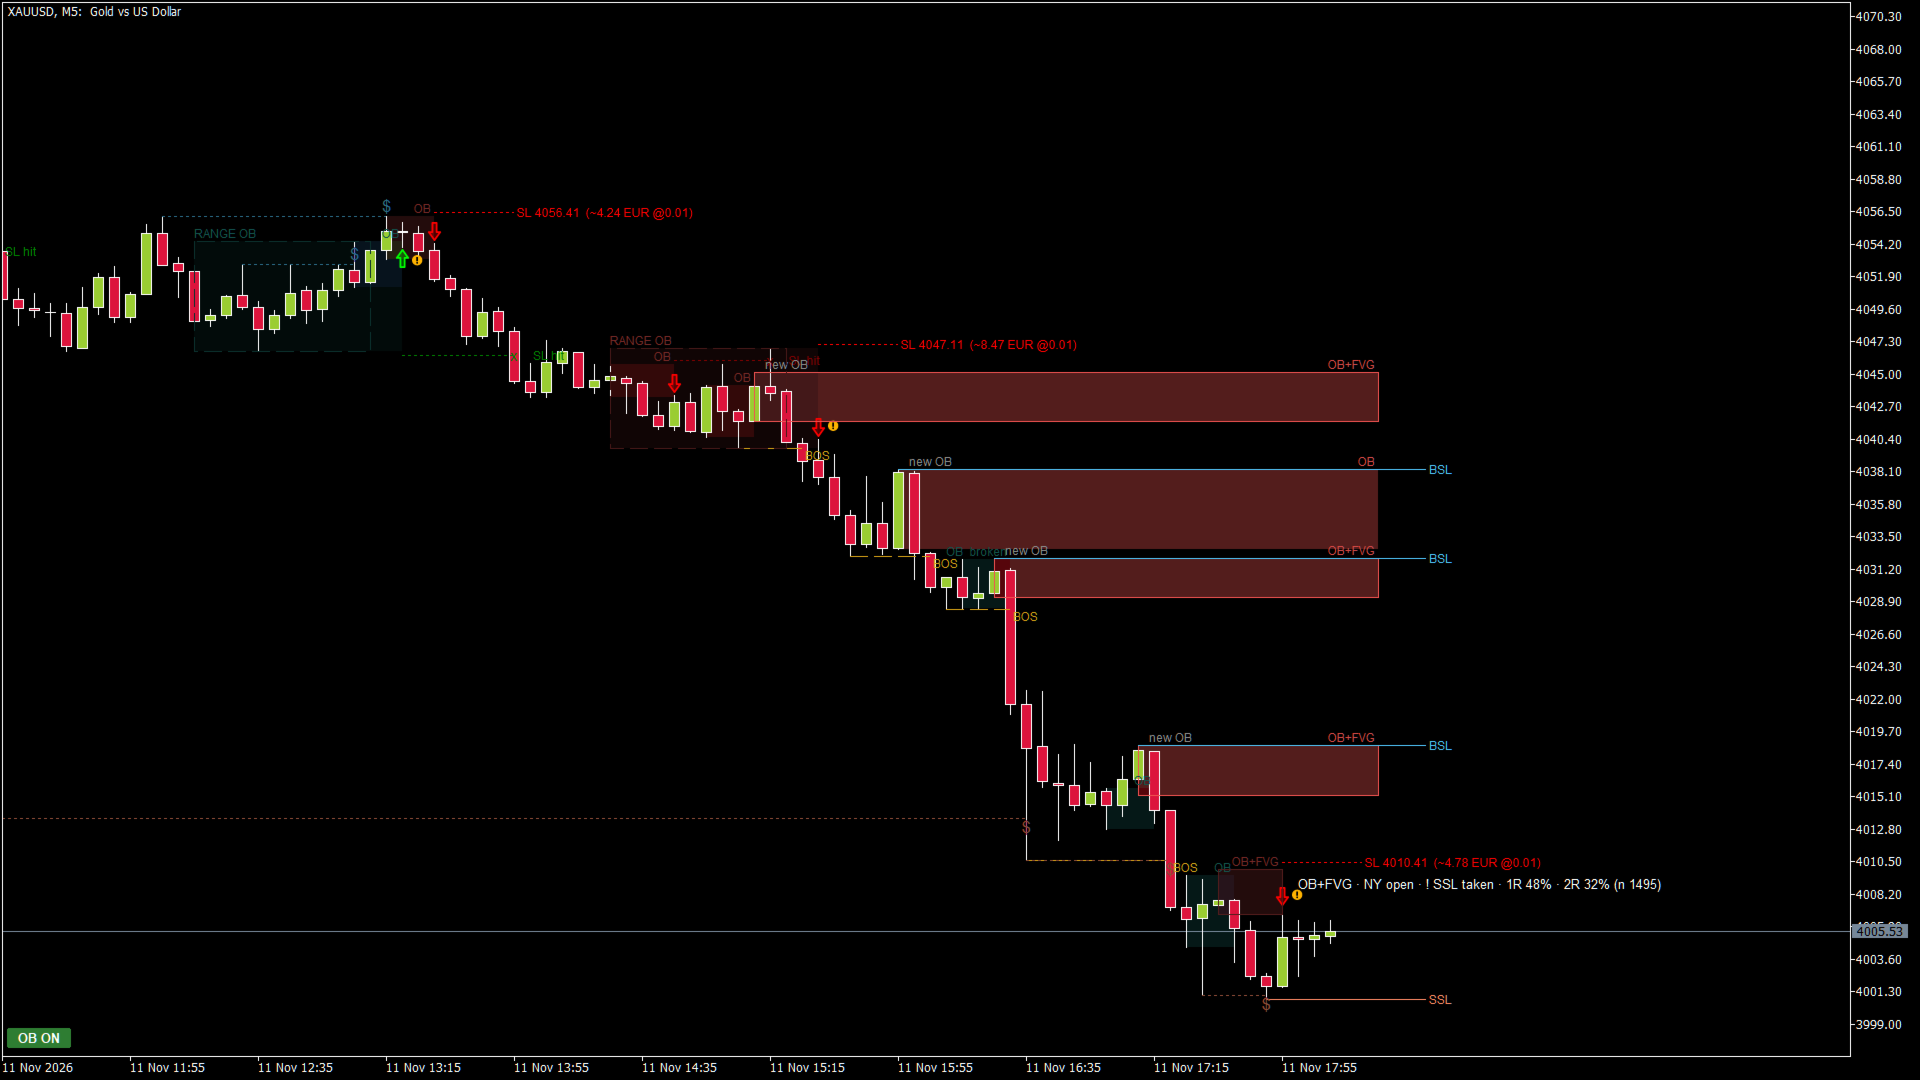
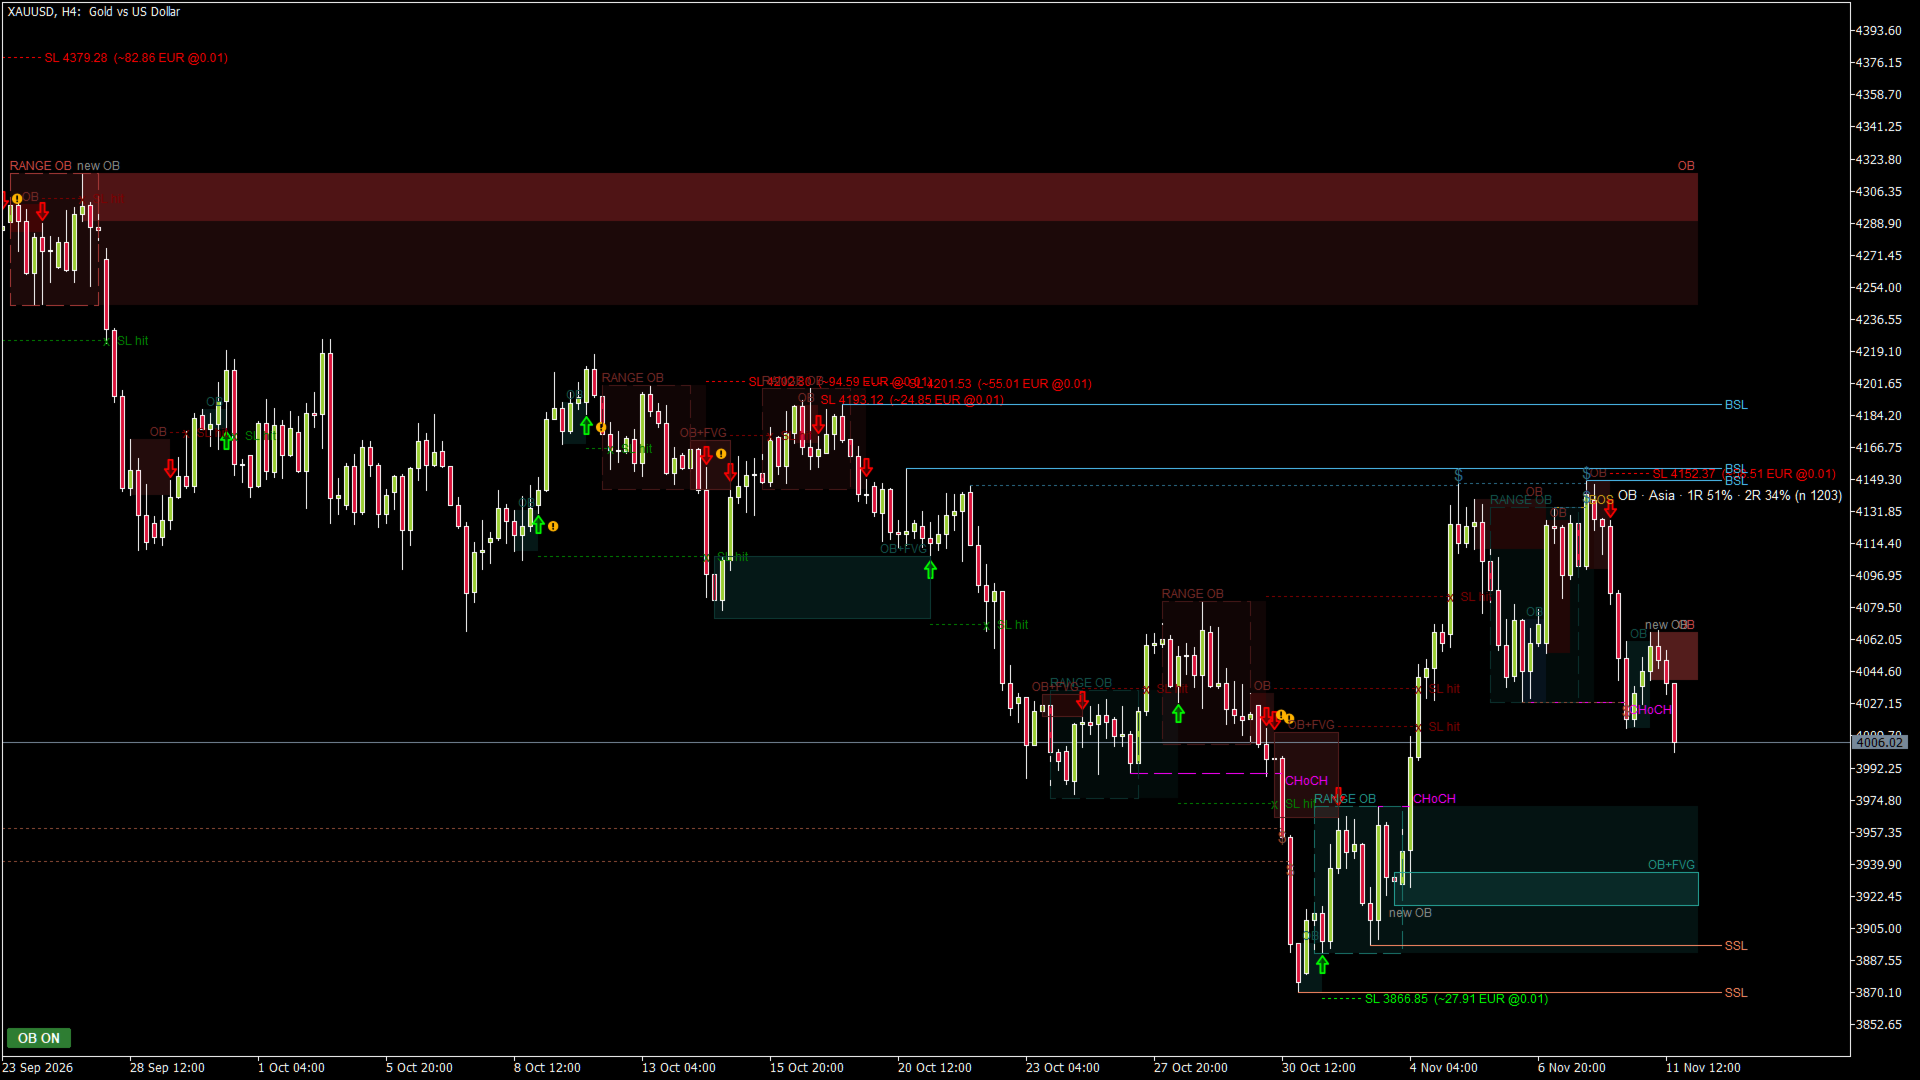
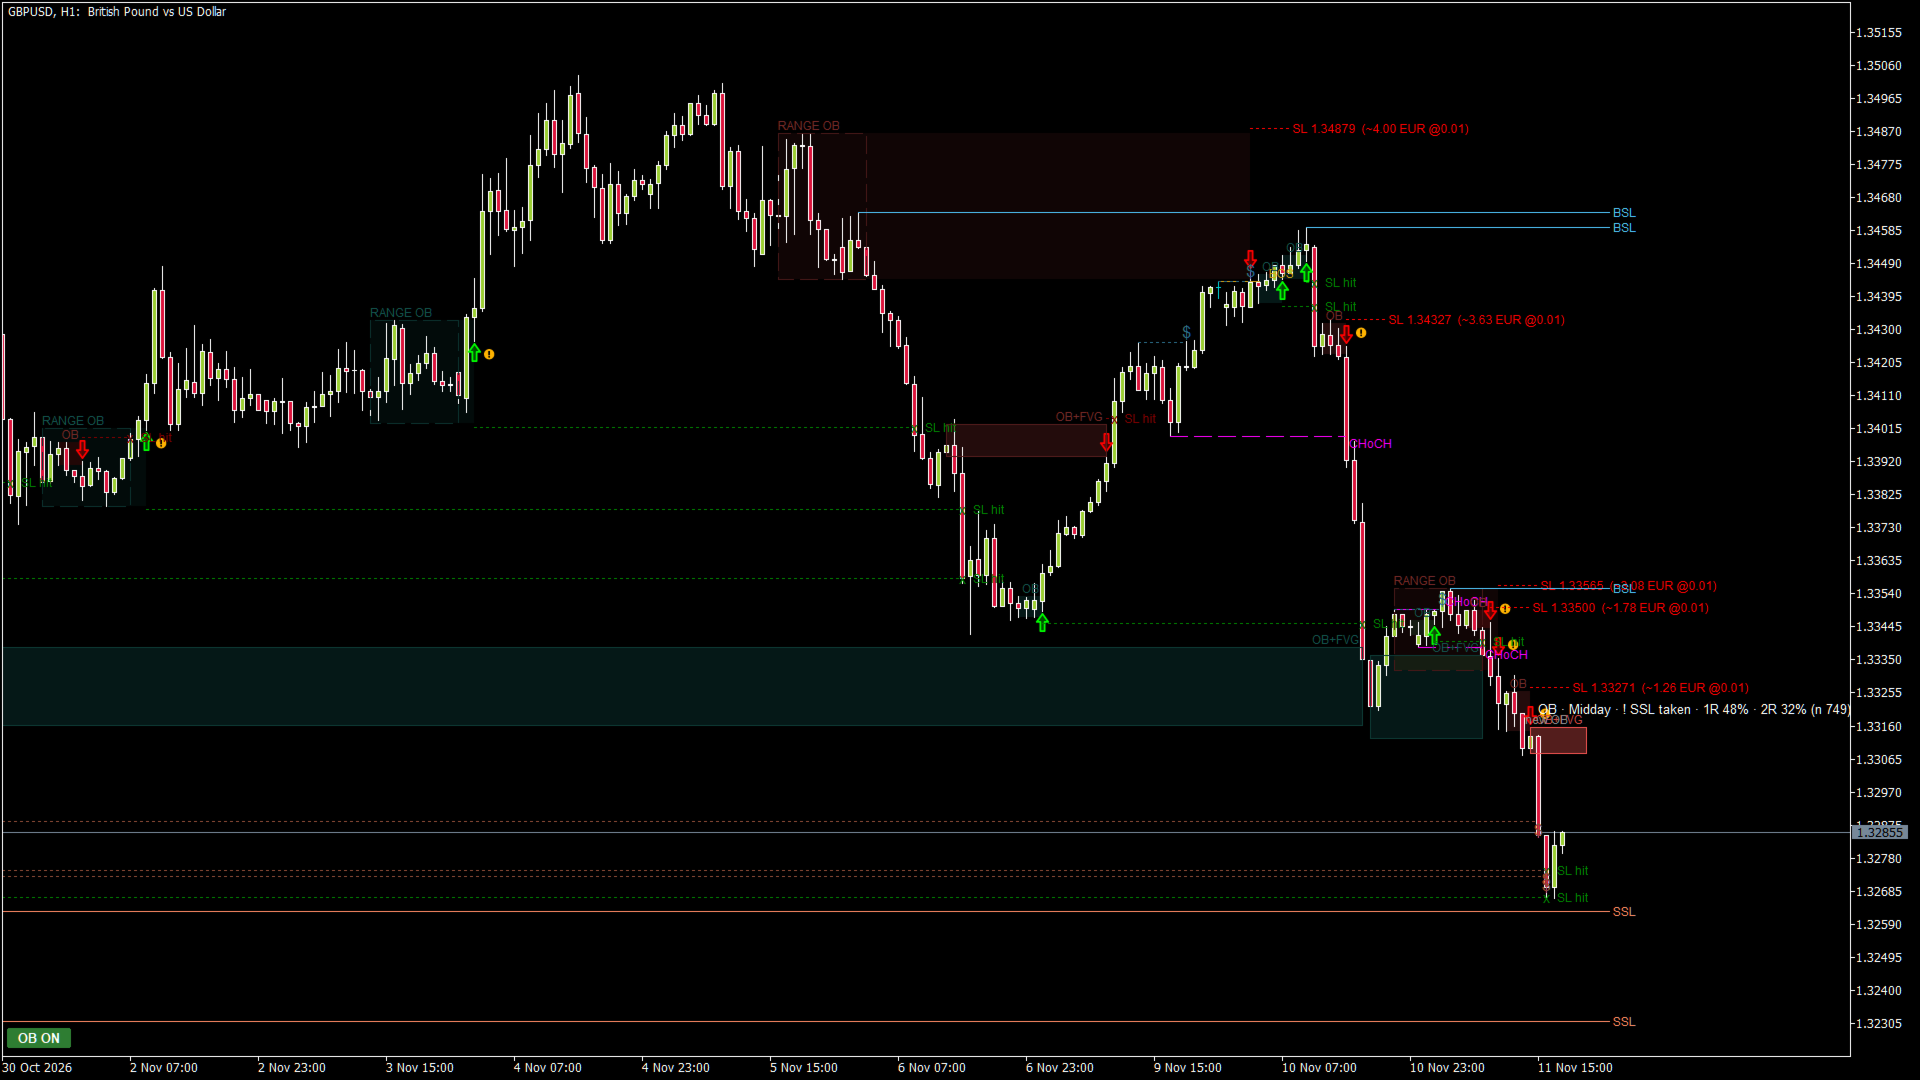
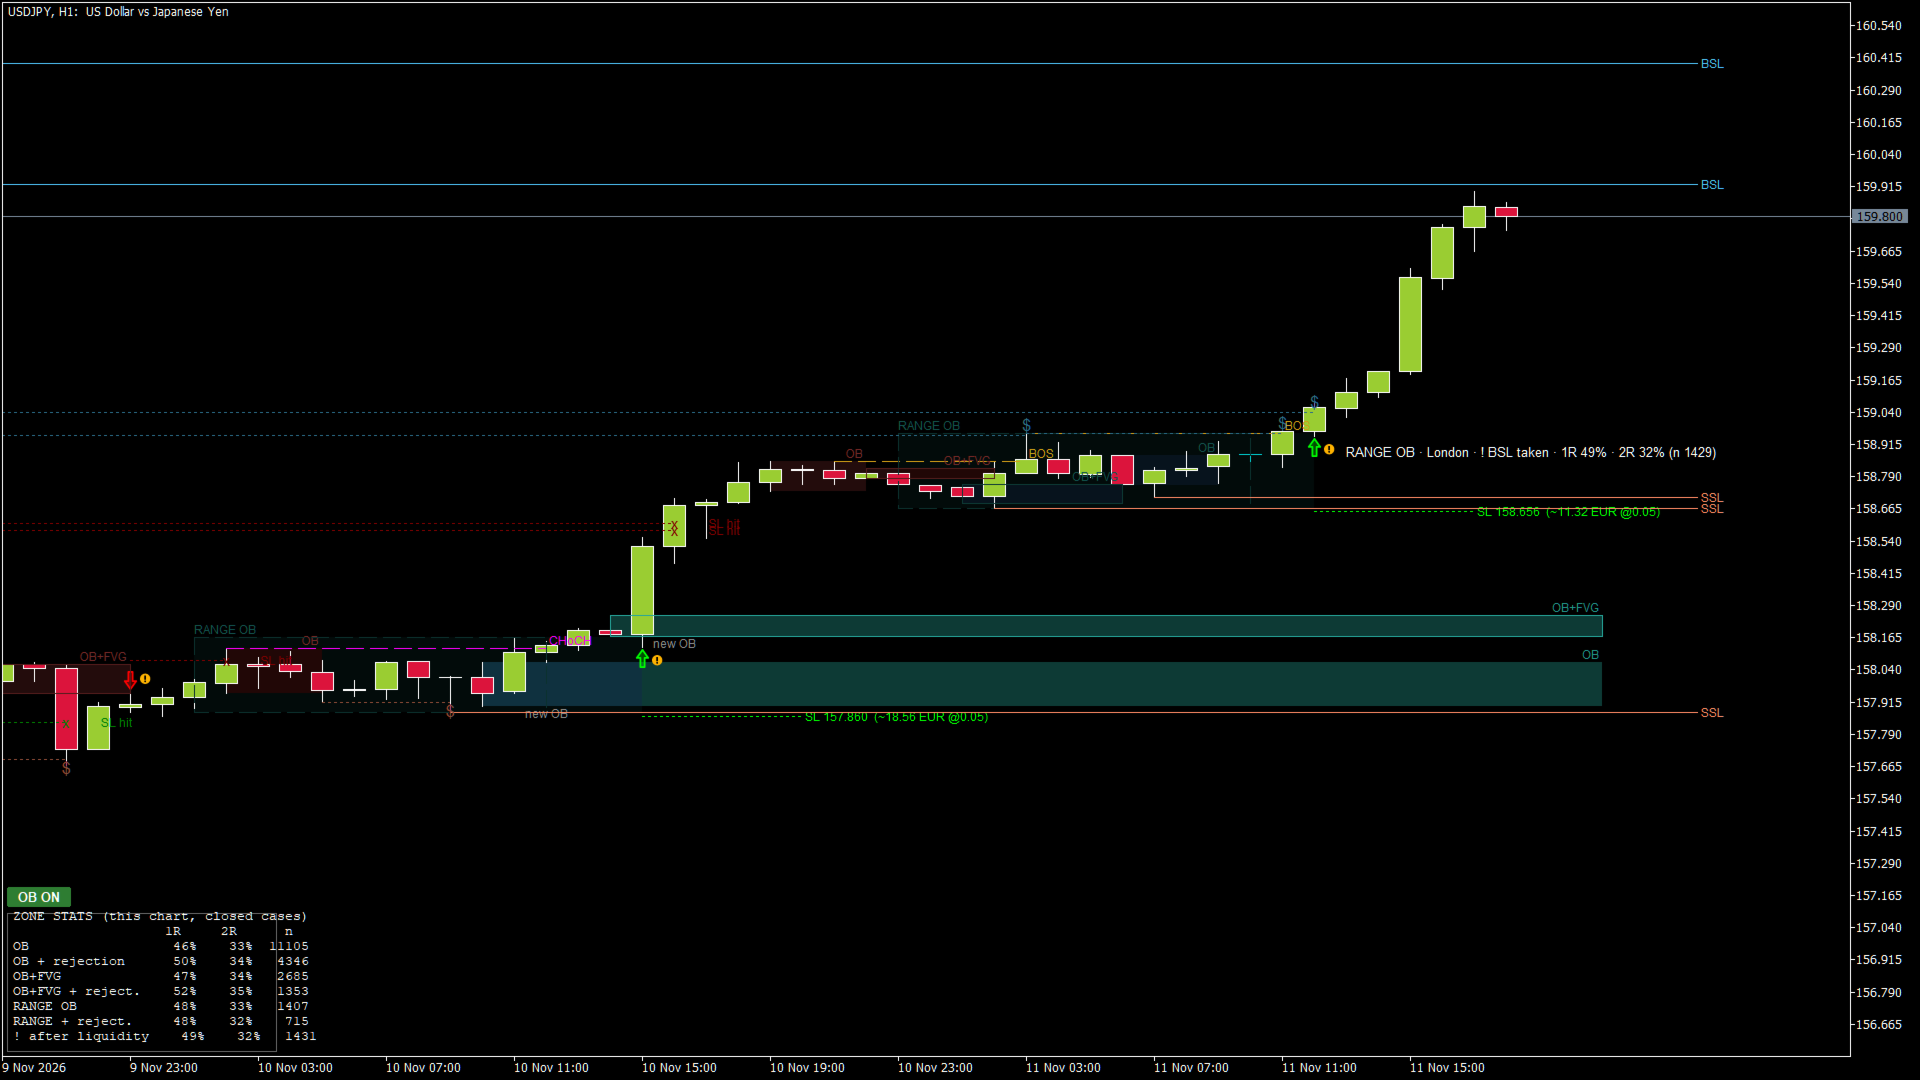
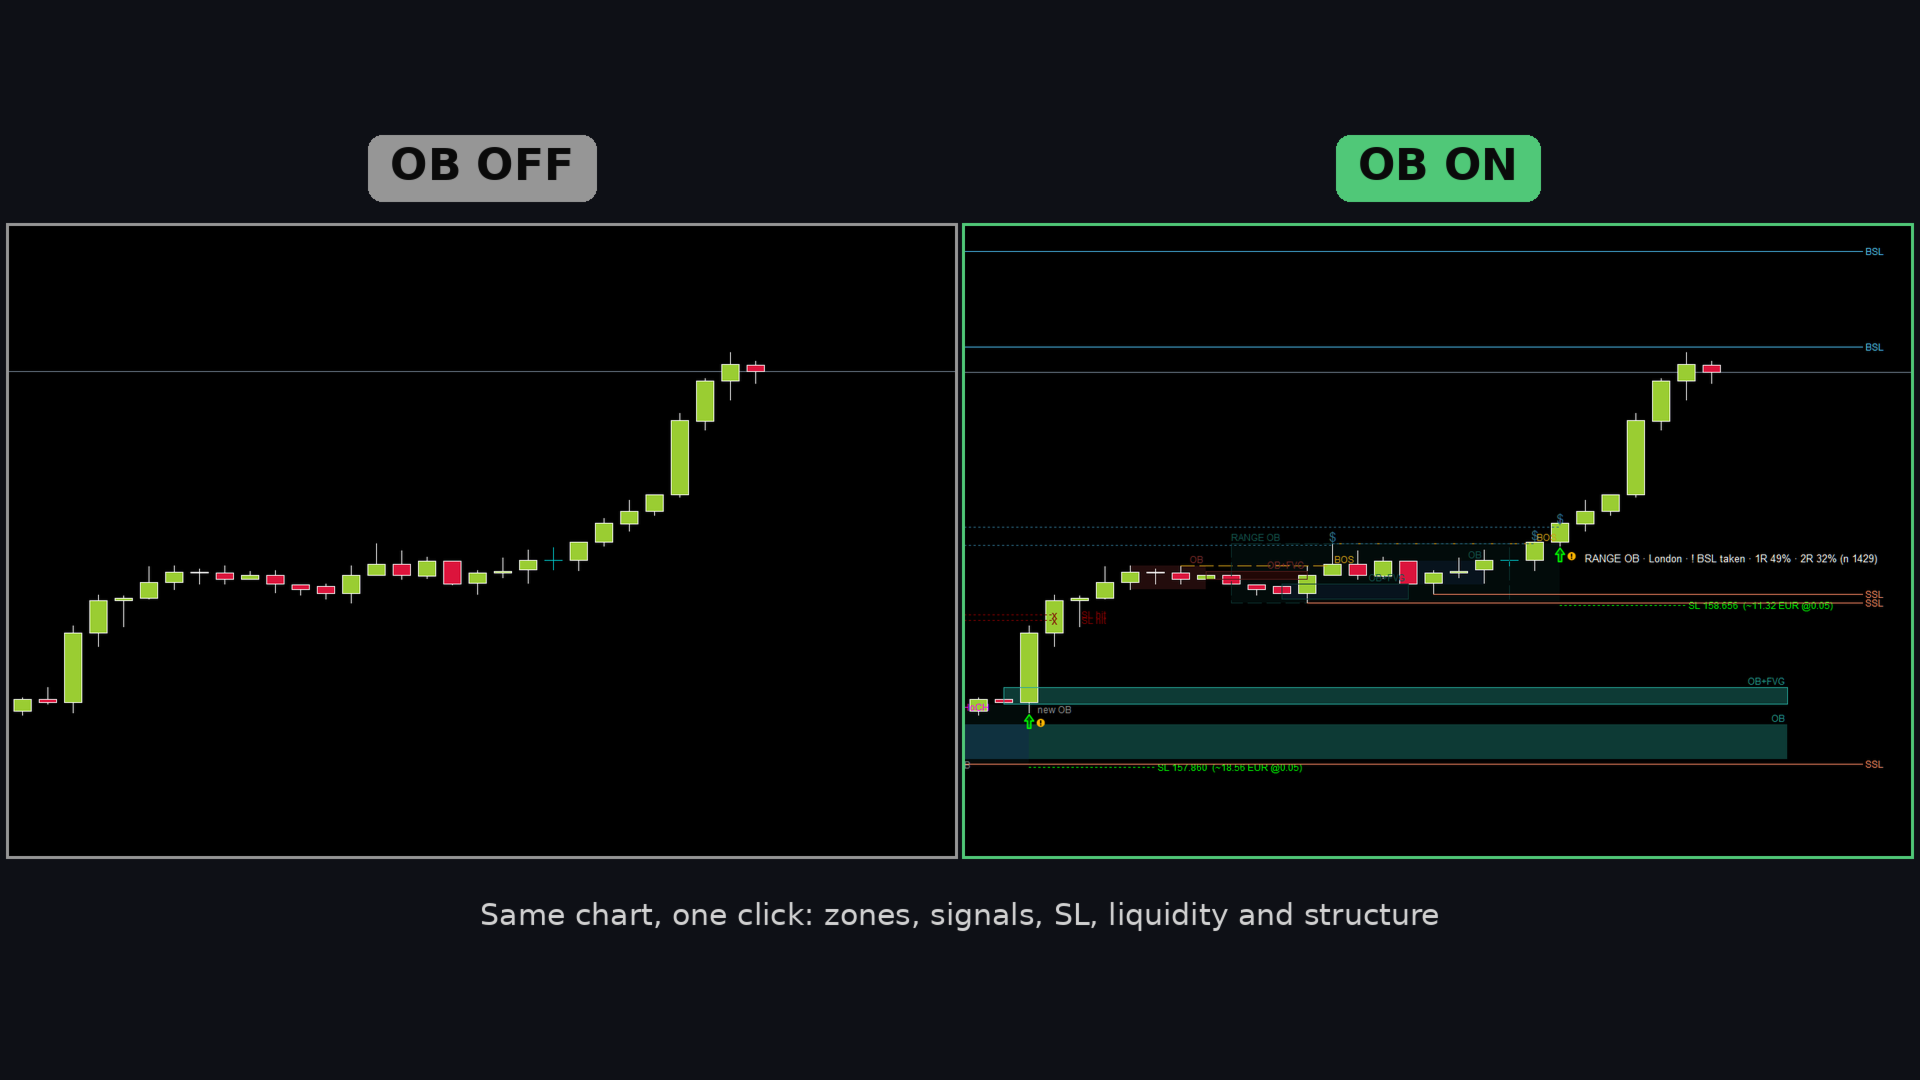
Smart Order Blocks puts the main Smart Money Concepts on one clean chart: order blocks, fair value gaps (FVG), range order blocks, market structure (BOS / CHoCH) and liquidity (BSL / SSL, equal highs / lows, liquidity taken). It gives a signal when price touches a zone and rejects it, and shows how often that type of signal worked in the past ON YOUR CHART.

Nothing is drawn before it happened and nothing repaints: a zone appears only after the candle that confirms it has closed, and a signal only after the rejection candle has closed.

Great for learning Smart Money Concepts: hover the mouse over any zone, arrow or line and a short explanation tells you what it is, why it is there and where the SL would be. You see the concepts on real charts instead of reading about them.

HOW TO USE IT IN 5 STEPS

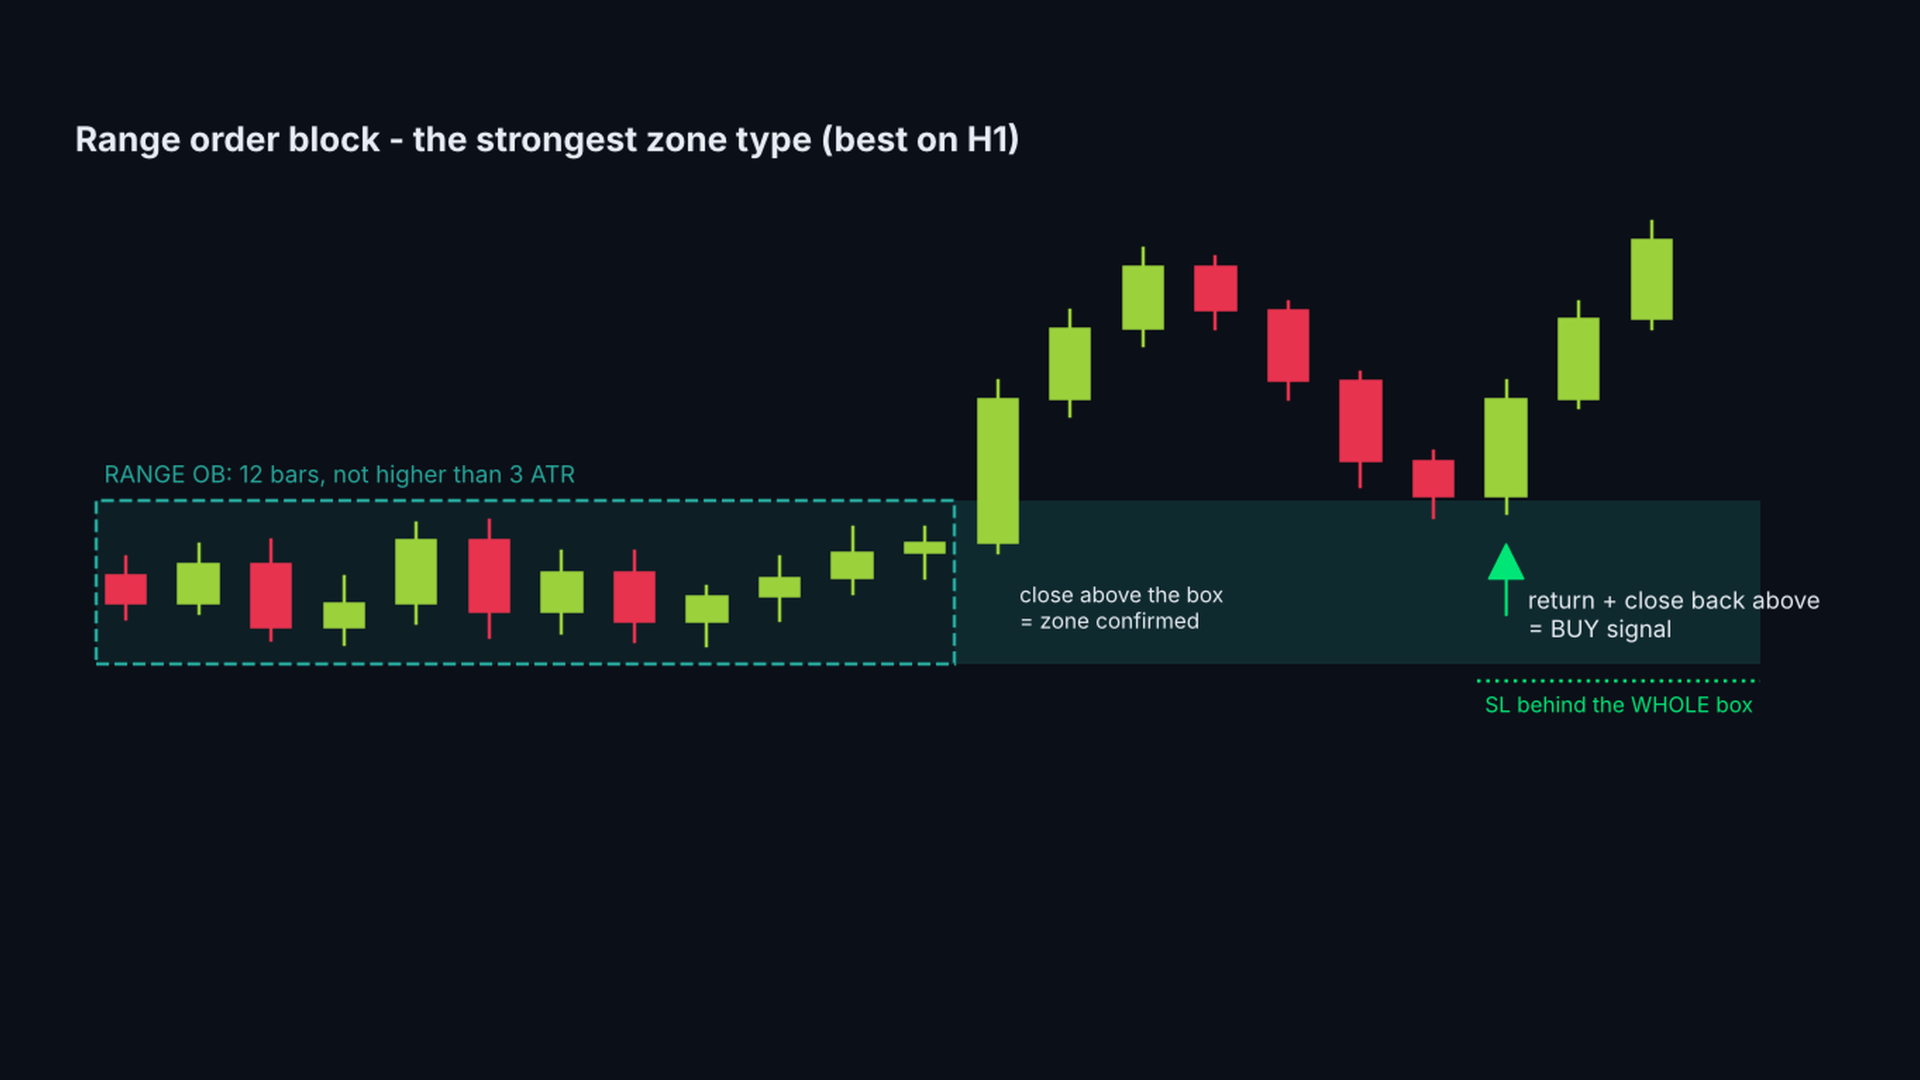
1) Attach it to an H1 chart and look at the zones: green = bullish order blocks (possible support), red = bearish (possible resistance). The light box is a RANGE OB, the strongest zone type.
2) Check the context: BOS / CHoCH show the direction of the structure, BSL / SSL show where stop orders rest above highs and below lows.
3) Wait for an arrow: a candle touched a zone and closed back outside it. The label shows the zone type and how often this type worked on your chart.
4) Use the dotted SL line behind the zone for your stop and size the position from that distance (the label shows the risk in money). Many traders take the entry on M5 / M15 in the direction of the H1 zone.
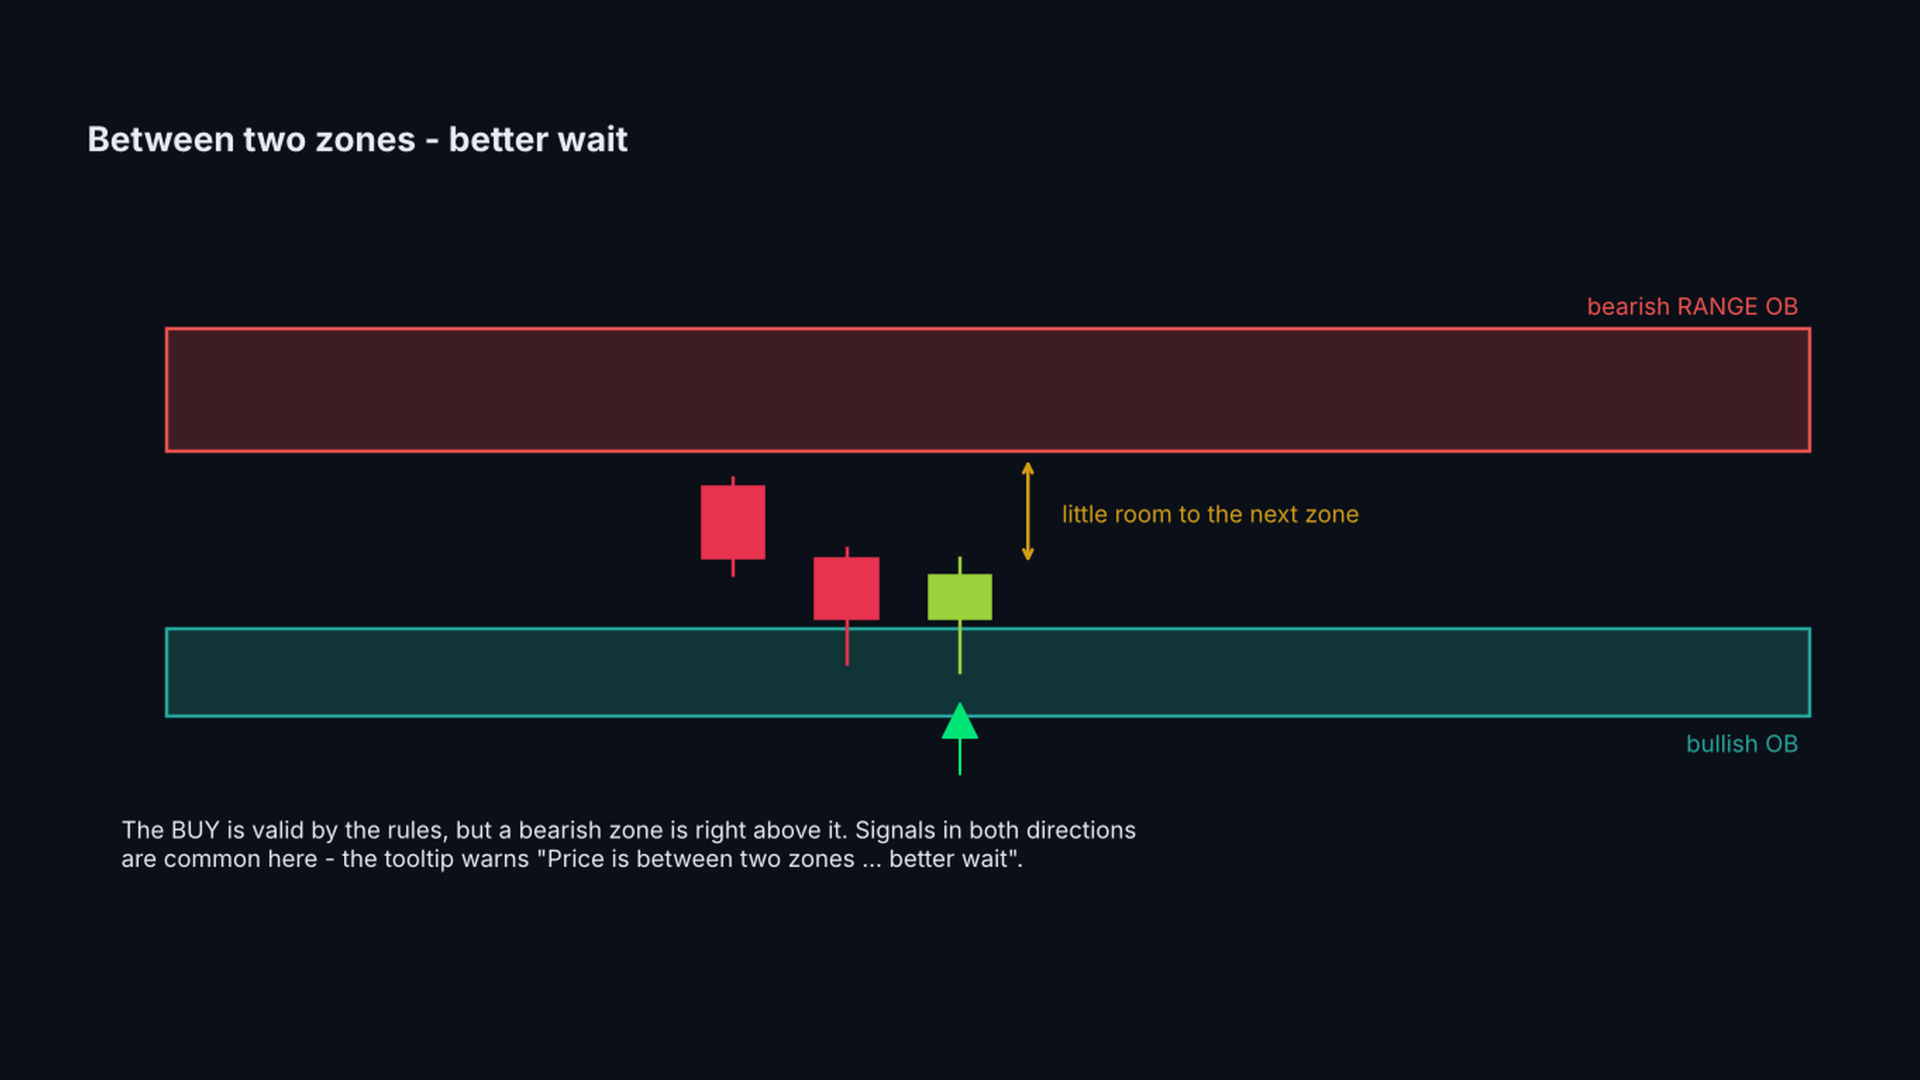
5) Skip signals marked with "!" and wait when arrows come in both directions within a few candles.

MAIN FEATURES

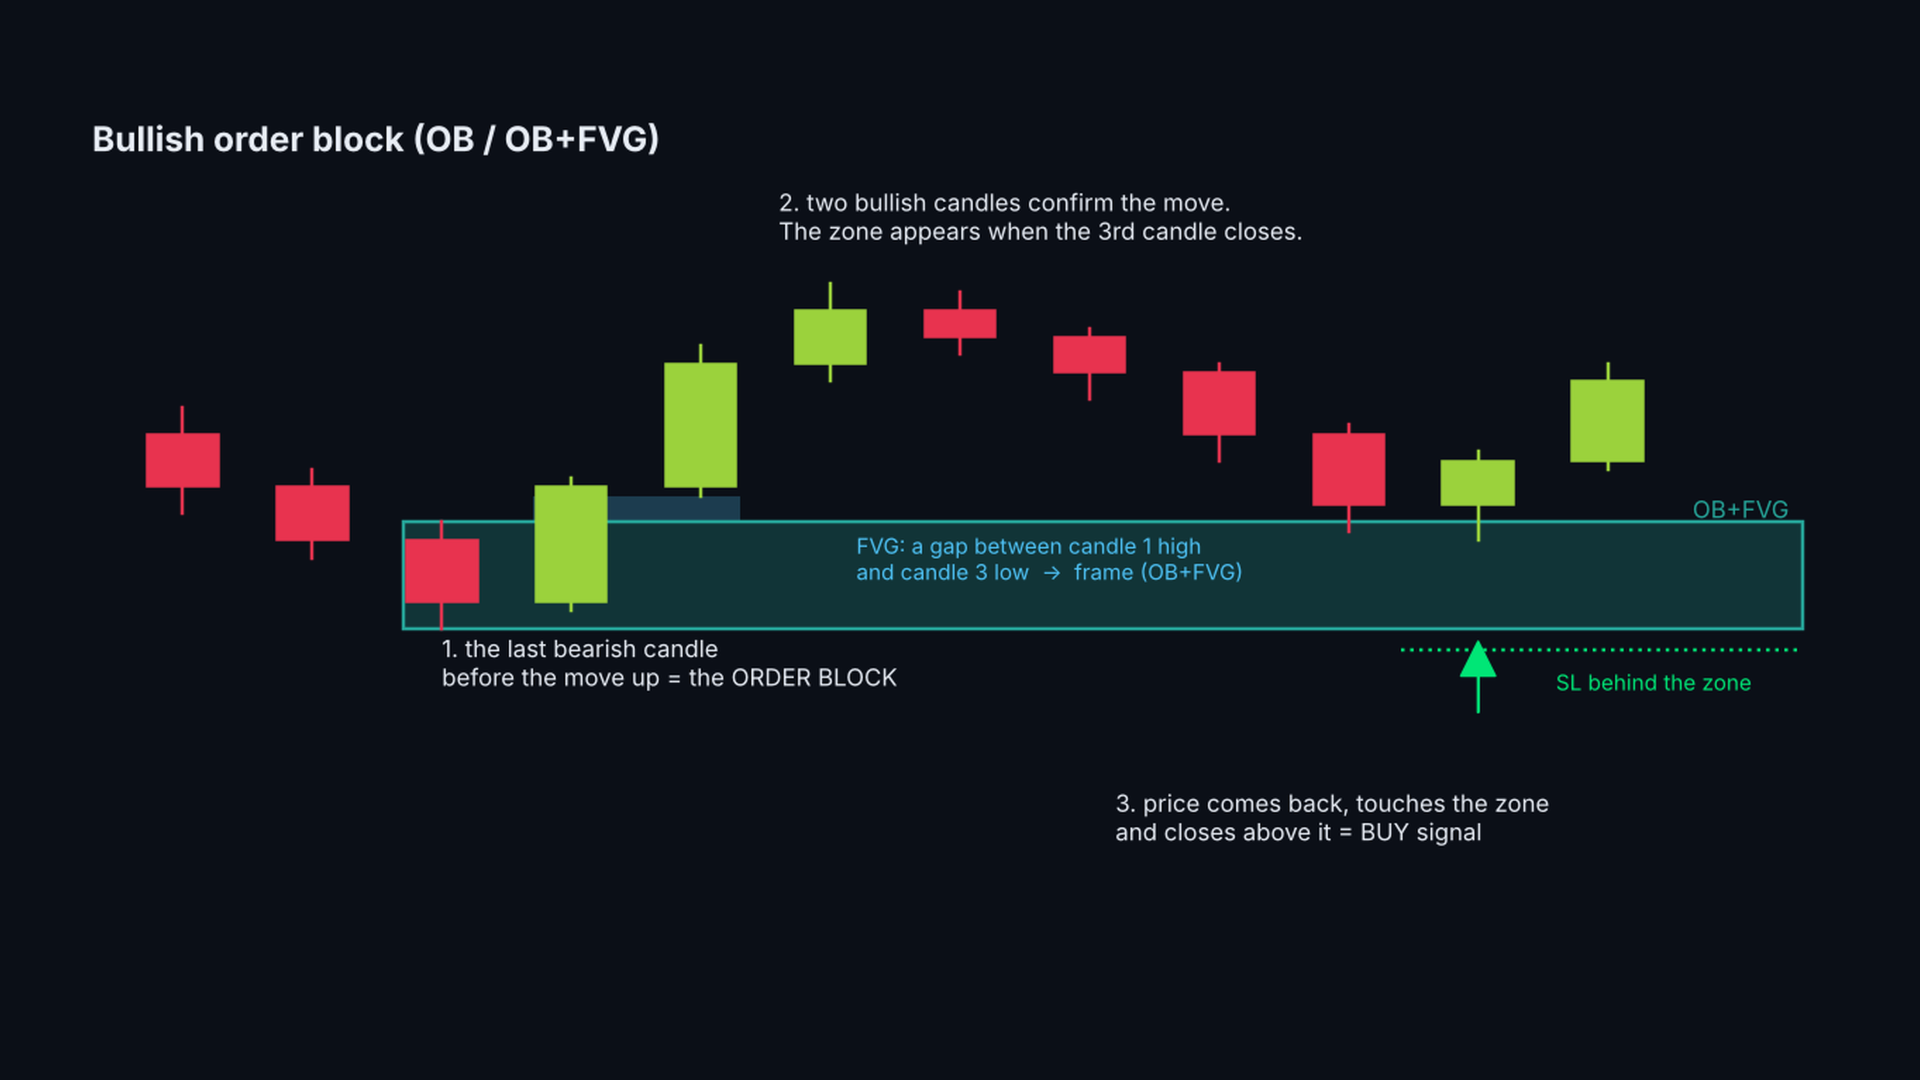
  • Order blocks (OB): the last opposite candle before a move, confirmed when the 3rd candle closes.
  • OB + fair value gap: order blocks whose move left a price gap are marked with a frame.
  • Range order blocks: a consolidation of 12 bars followed by a close beyond it. The whole box is the zone.
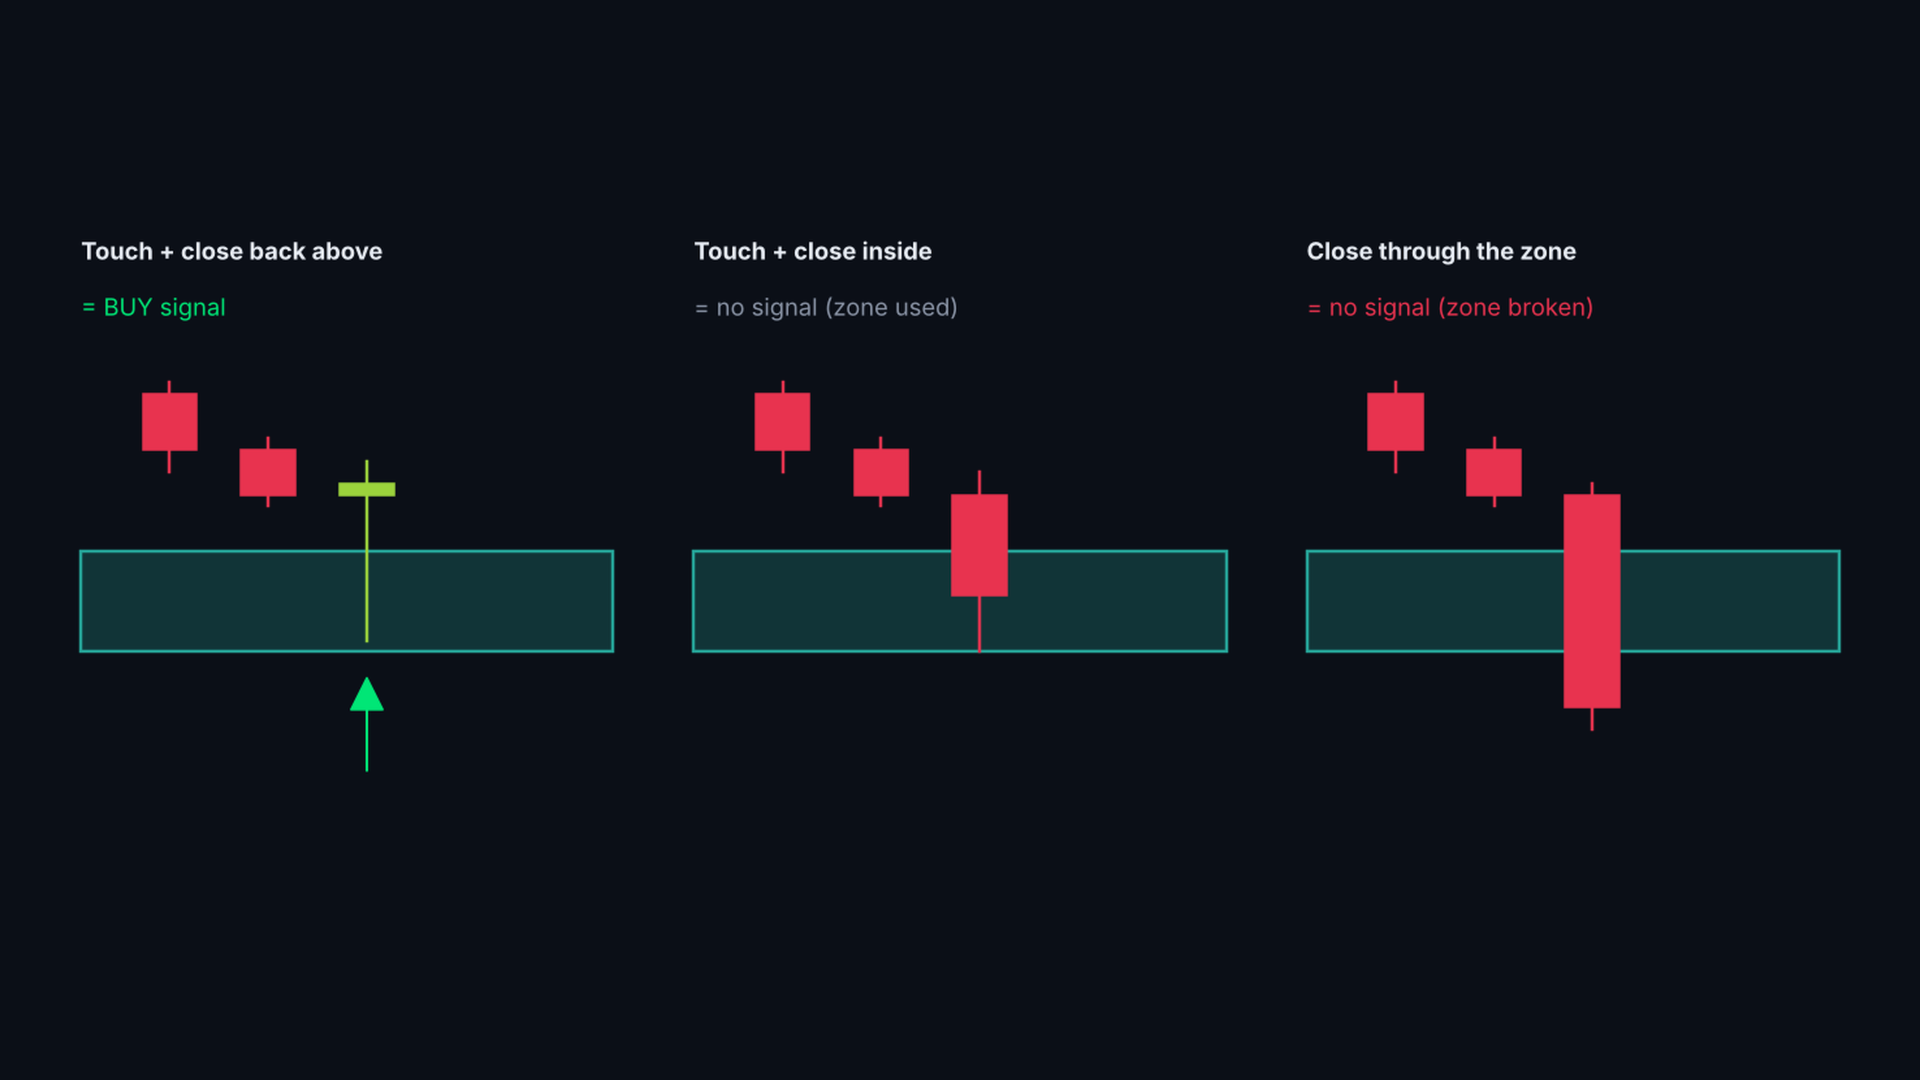
  • Rejection signals: a closed candle that touched an untouched zone and closed back outside it. Arrow + SL line behind the zone.
  • Possible signal: a hollow arrow while the candle is still open and touching a zone. It becomes a signal on the close or disappears.
  • Honest probability: for every signal type the indicator counts how often price reached 1R and 2R before the SL in the past cases on this chart (walk-forward, no look-ahead).
  • Fair value gaps: order blocks whose move left an FVG get a frame (OB+FVG), FVGMinATR sets the minimum gap size.
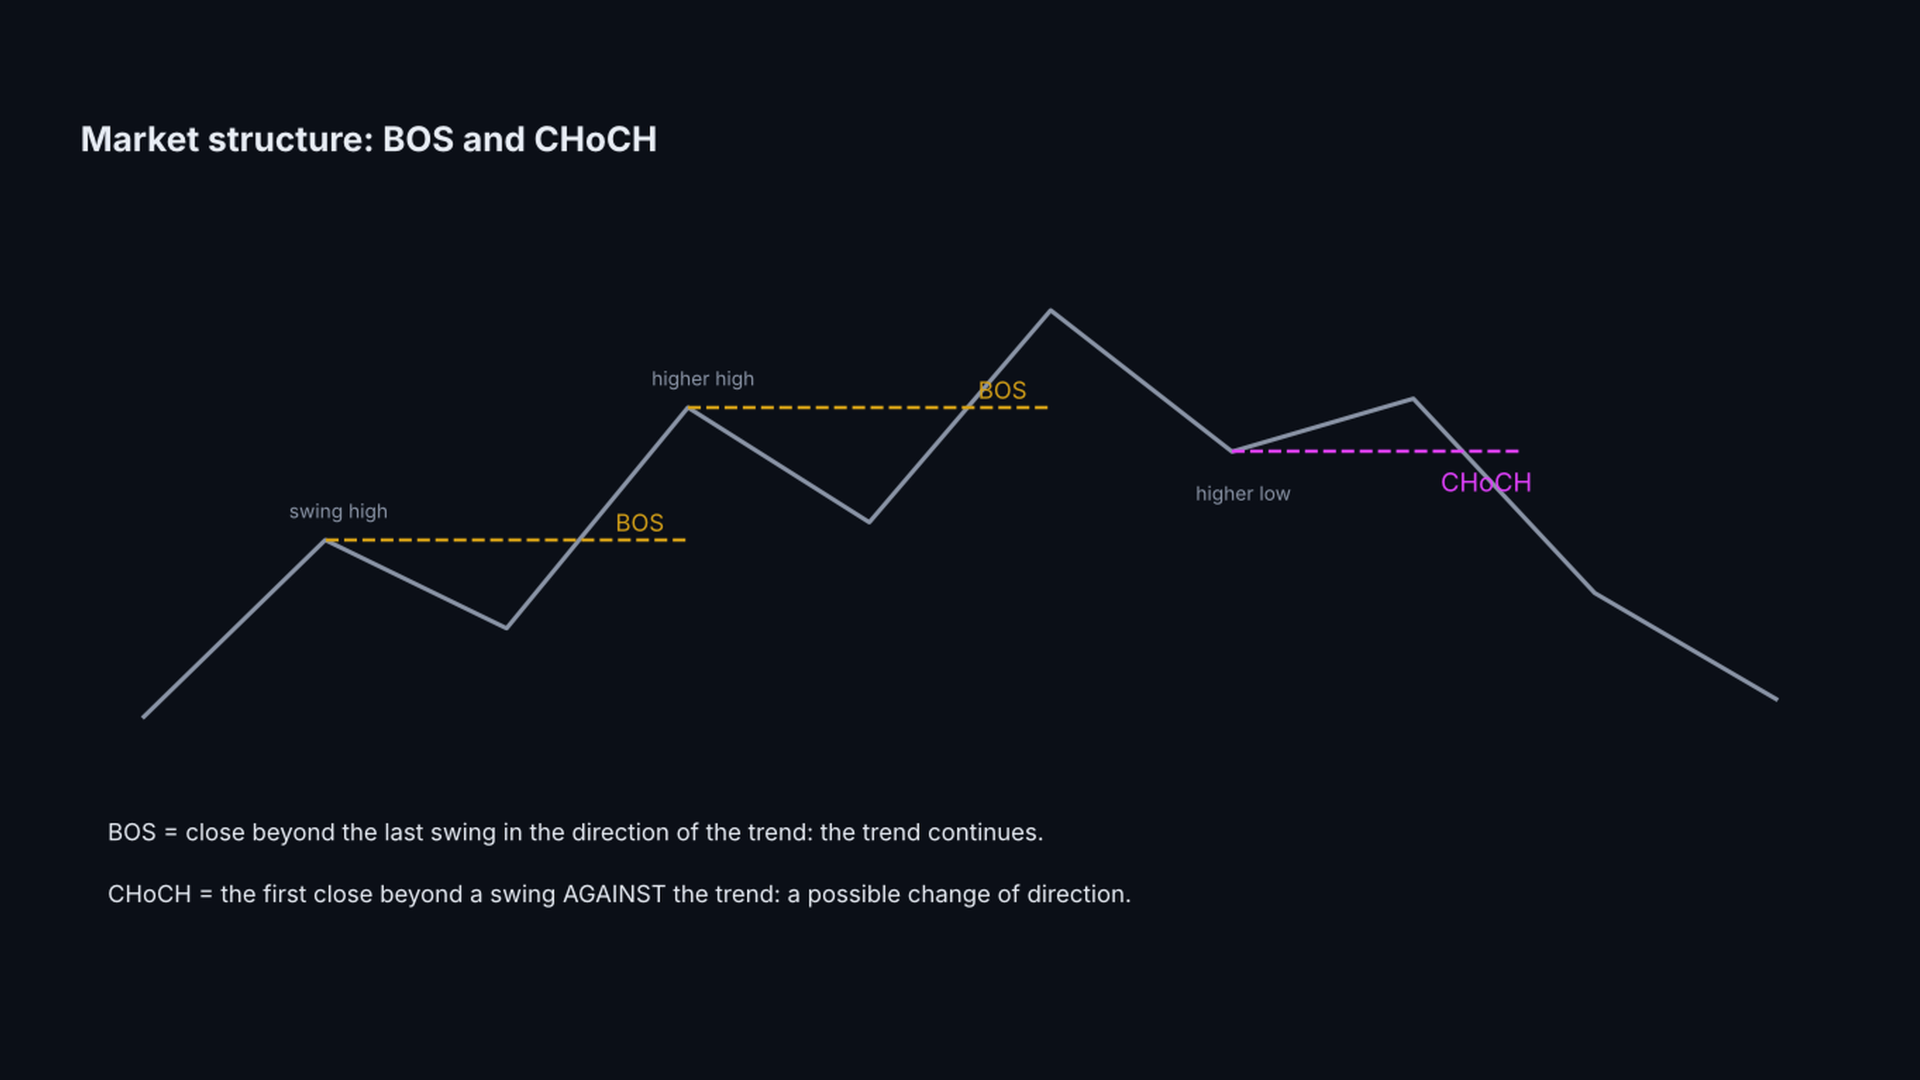
  • Market structure: break of structure (BOS) and change of character (CHoCH) lines.
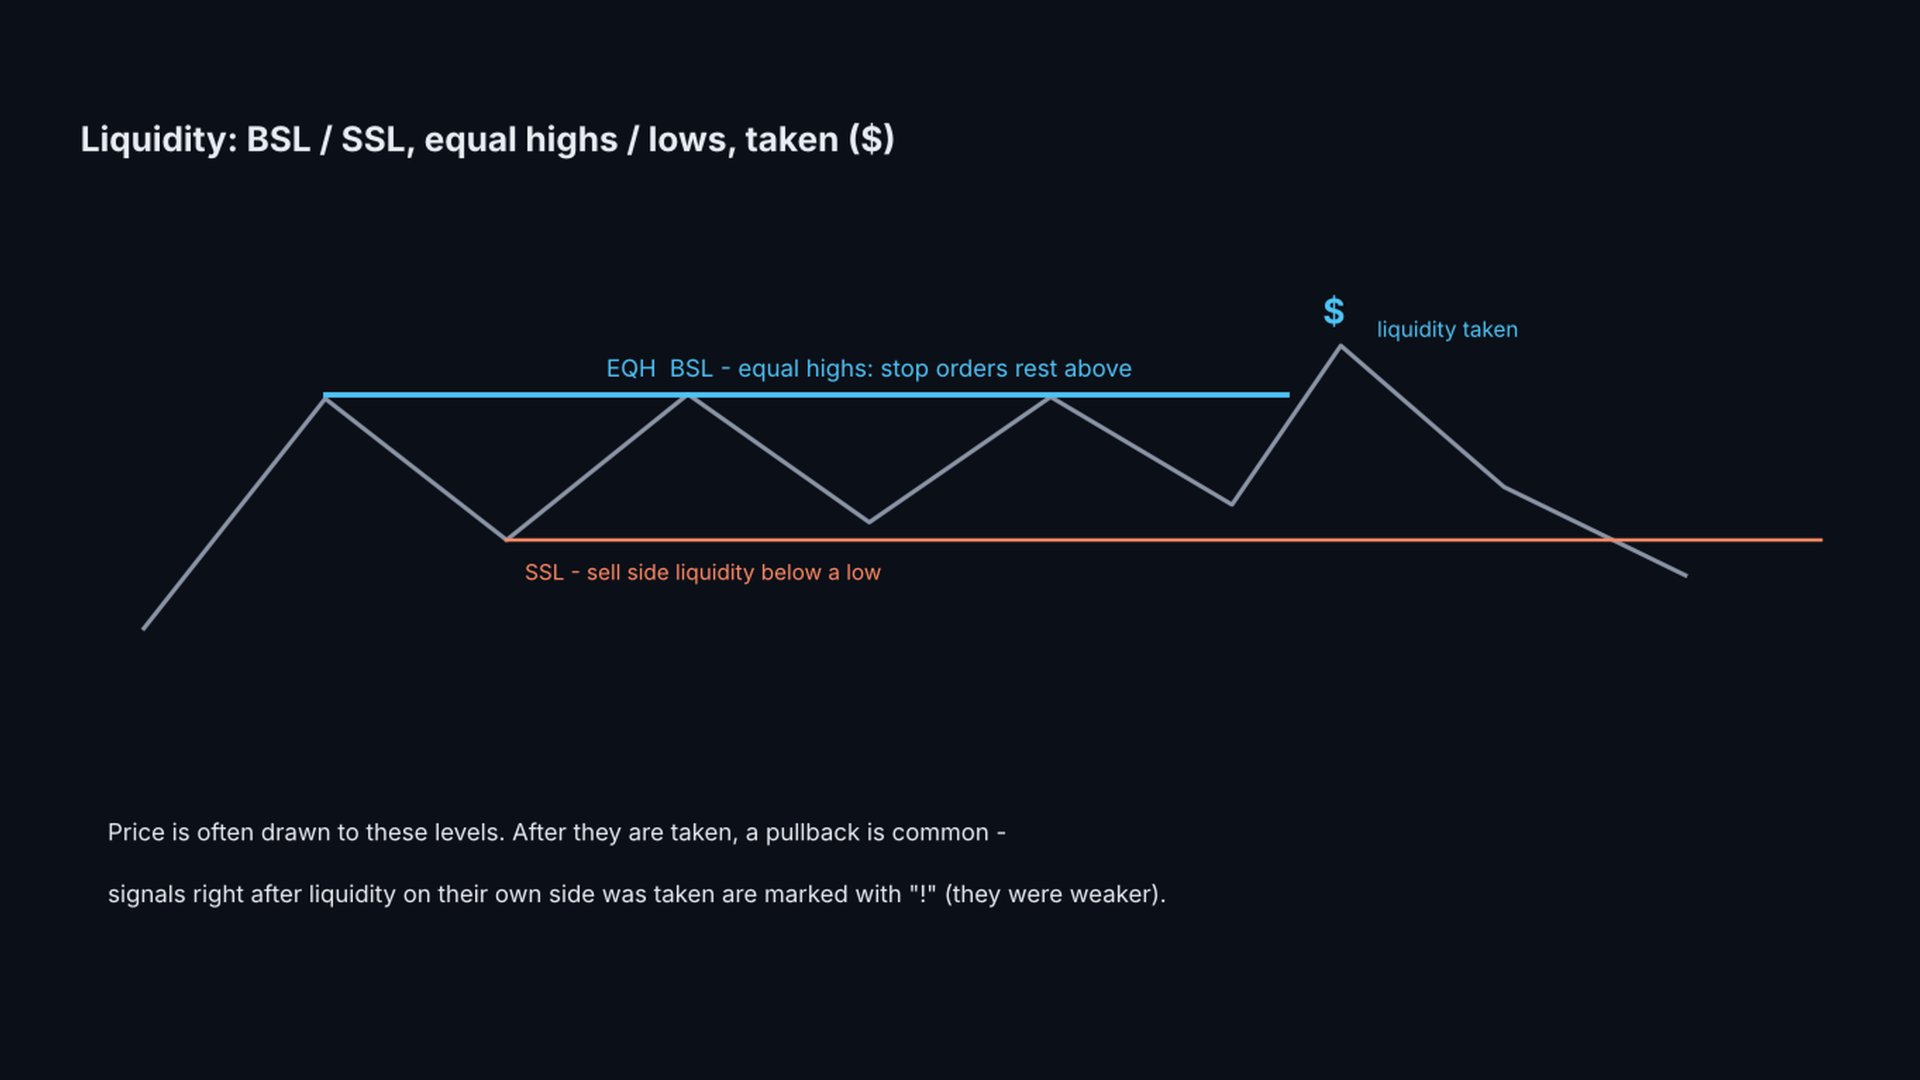
  • Liquidity: resting buy side / sell side liquidity (BSL / SSL), equal highs / lows (EQH / EQL) and where liquidity was taken ($).
  • Caution mark "!" on signals that come right after liquidity on the same side was taken.
  • Hover the mouse over any zone, arrow, line or label: a tooltip explains what it is, with the prices and the SL.
  • "OB ON / OB OFF" button to hide everything with one click. Popup and push alerts.
  • Works on any symbol and timeframe. Light and dark charts (colors adjust automatically).

USER GUIDE

1. QUICK START

1) Attach Smart Order Blocks to a chart. The default settings work on any symbol.
2) Wait a few seconds on the first load: the probability statistics are calculated on up to 50 000 bars (StatsBars).
3) Hover the mouse over anything that is drawn to read what it is.
4) For push notifications: Tools > Options > Notifications in MetaTrader 5, enter your MetaQuotes ID and enable push notifications.

2. THE ZONES

  • Bullish OB (green): the last bearish candle before a move up. Bearish OB (red): the last bullish candle before a move down.
  • An OB is shown only when the move is confirmed: the 2 candles after it move in the same direction and the 3rd candle has closed.
  • OB+FVG (with a frame): the move left a fair value gap (a gap between candle 1 and candle 3).
  • RANGE OB (very light box with a dashed frame): a consolidation of RangeBars bars not higher than RangeMaxATR x ATR, then a close beyond it.
  • States: untouched (normal color), used = already touched (faded), broken = price closed through it ("broken").
  • An untouched zone expires after ZoneMaxBars bars.
  • "new OB" marks the candle that confirmed a zone.

3. THE SIGNALS

  • BUY: a closed candle touched an untouched bullish zone and closed back above it. SELL: the mirror case.
  • The arrow is final after the close. The label shows the zone type, the session and the probability, for example:

  "RANGE OB · London · 1R 55% · 2R 37% (n 120)".

  • SL line: a short dotted line behind the zone (+ SLBufferATR x ATR) with the risk in money, for example "SL 152.569 (~11.40 USD @0.01 lot)". If the SL is hit later, the line is faded, runs to the candle that hit it and shows "x SL hit".
  • SLMode: behind the whole zone (default), behind the middle of the zone, or behind the zone but max SLMaxATR x ATR from its edge. In our tests the stop behind the whole zone was the best on every timeframe; smaller stops were hit more often and were weaker in R.
  • Hollow arrow = possible signal on the open candle. About 1 in 3 becomes a signal. Useful on lower timeframes to look at the chart before the close.
  • SkipInsideRange: no OB signal while the signal candle is still inside a consolidation.
  • The tooltip of every arrow names the zone it comes from (for example "BULLISH OB 4010.30 - 4025.10"). If a zone in the opposite direction is right in front of the signal, the tooltip says "Price is between two zones ... better wait". This happens often: a buy from a green zone just under a red zone is a valid signal by the rules, but the price has little room.
  • The tooltip of every arrow says whether the signal is with or AGAINST the market structure (last BOS / CHoCH). Signals against the structure were not worse on average in our tests, so they are shown by default; HideAgainstStructure hides them if you prefer.
  • Waiting for a confirmation on a lower timeframe (for example a BOS on M5 after an H1 signal) did not help in our tests: the confirmed signals were the good ones, but by the time of the confirmation the price had already moved and the later entry gave the advantage back.

4. THE PROBABILITY - WHAT IT MEANS

  • For every closed past case of the same type (OB, OB+FVG, RANGE OB, with or without rejection, after liquidity taken) the indicator checks what came first: 1R / 2R or the SL.
  • 1R = the SL distance, 2R = twice the SL distance. n = number of past cases. With fewer than MinCases cases it shows "not enough data".
  • It is calculated walk-forward: each case uses only what was known at that time. It is a description of the past on this symbol and timeframe, not a prediction.
  • Use it to compare: which zone types and timeframes have worked better on the symbol you trade.

5. FVG, STRUCTURE AND LIQUIDITY - THE CONTEXT

These show what just happened on the chart. In our tests they did not make the signals better on their own, so use them as context, not as filters:

  • FVG: a gap between candle 1 and candle 3 of a strong move. An OB with an FVG is drawn with a frame (OB+FVG).
  • BOS: a close beyond the last swing high / low in the direction of the structure - the trend continues.
  • CHoCH: the first close beyond a swing against the previous structure - a possible trend change.
  • BSL / SSL: untaken swing highs / lows where stop orders rest. EQH / EQL = equal highs / lows (thicker line).
  • Taken liquidity: a dotted faded line and "$" where price went beyond the level.
  • "!" next to an arrow: liquidity on the same side was taken on the signal candle or the candles before it (LiqCautionBars). In our tests these signals were weaker.

6. A PRACTICAL WAY TO USE IT

This is a tool for manual trading, not a system that takes every arrow. What we found when we developed it (XAUUSD, H1 2020-2026, M5 / M15 2025-2026, costs included):

  • Order block zones are real levels: price reacted from them clearly more often than from random candles, in every year we tested. Use them for where to look, where to put the stop and where to take profit.
  • Waiting for the rejection close was better than entering at the first touch.
  • RANGE OB on H1 was the strongest signal type. Many traders use H1 for the zones and the direction and a lower timeframe (M5 / M15) for the entry.
  • All signals together are only about breakeven after costs. Taking every arrow is not a strategy.
  • When signals come in both directions within a few candles, price is between two zones: better wait.
  • Signals with "!" (right after liquidity on the same side was taken) were weaker.

Past results do not guarantee future results. Check the probability on your own symbol and timeframe, and test on a demo account first.

7. RISK

  • The SL is behind the zone: typically about 1.3 ATR for an OB and about 3 ATR for a RANGE OB. On D1 / H4 this is a large distance in price, but it is normal for the timeframe - an H1 stop is many times smaller in price.
  • Size the position from the SL distance, not from a fixed lot: the tooltip and the SL label show the distance in price, in ATR and in money for MoneyLot (0.01 by default). Keep the money at risk the same on every timeframe.
  • Two or three losses in a row are normal with any setup that wins about half of the time.

8. RISK : REWARD - THE MATH

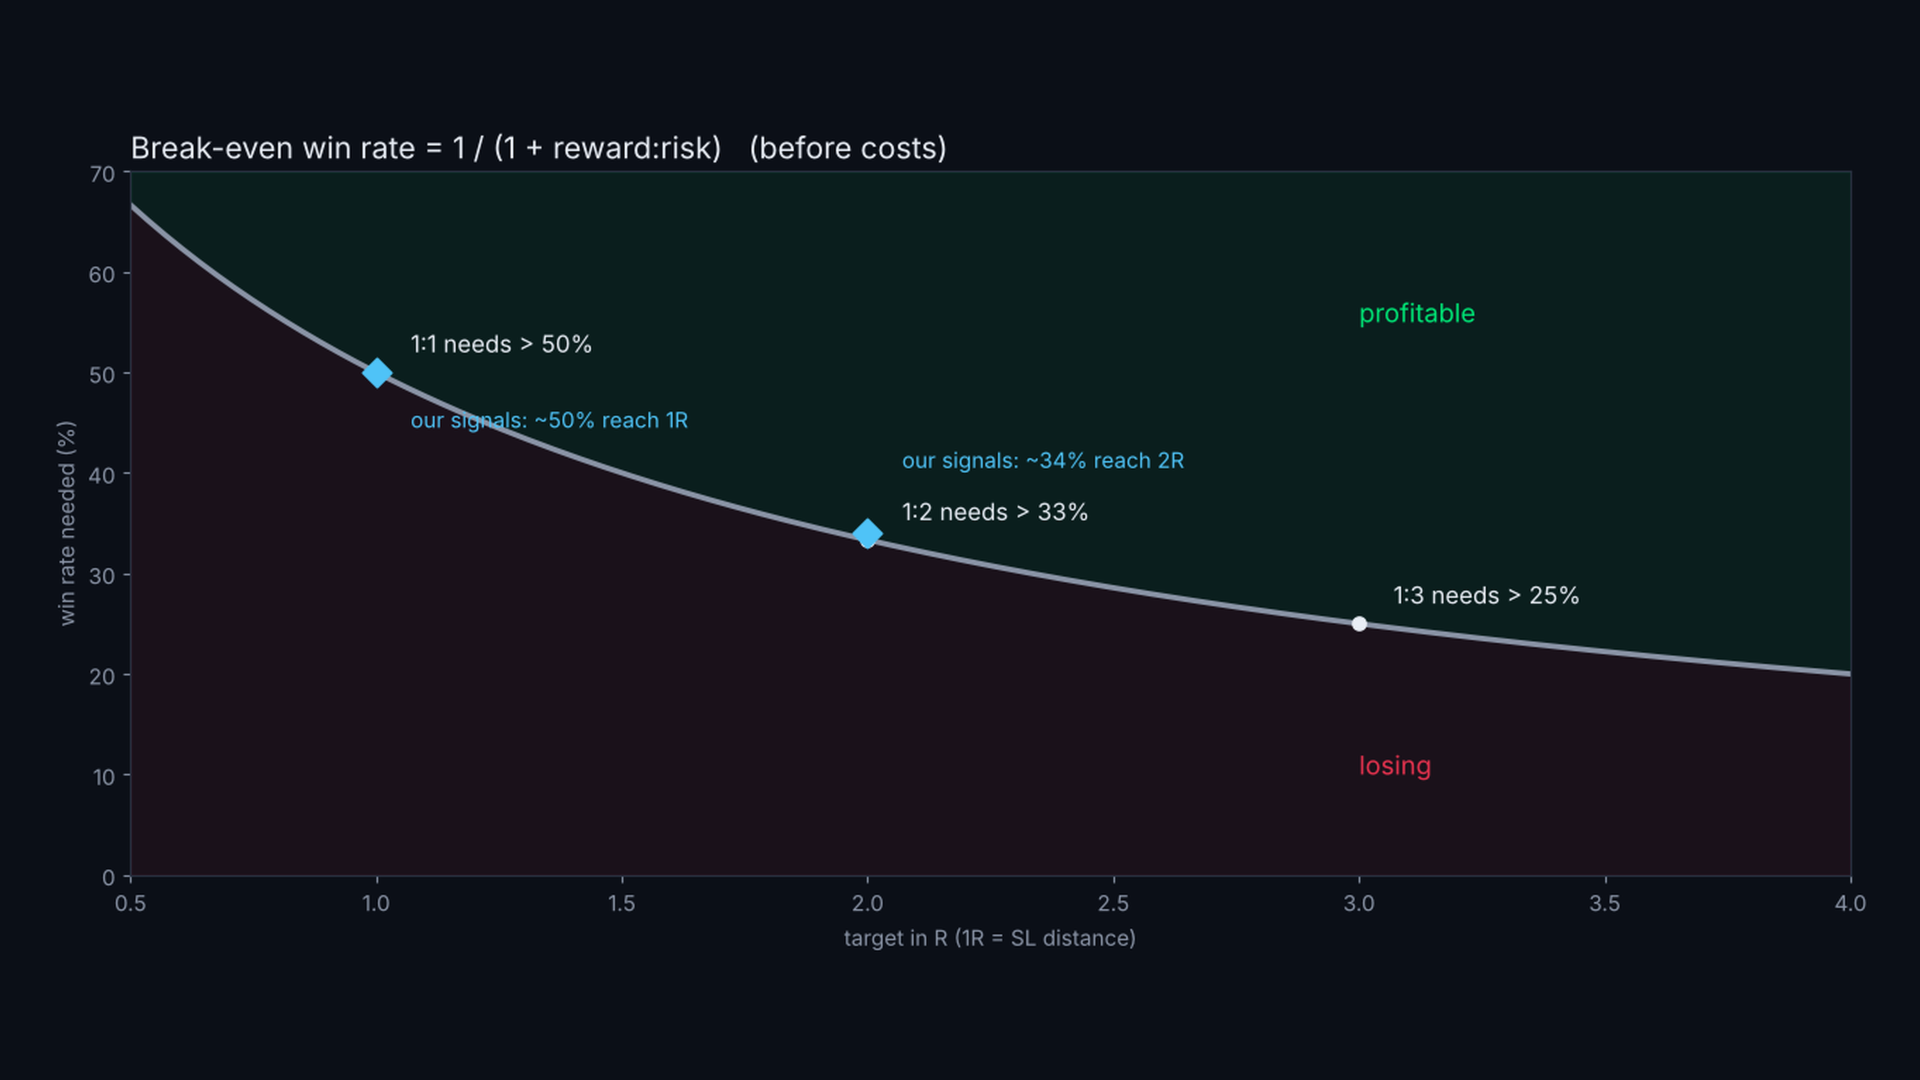
With a fixed target, a setup is profitable only if it wins more often than this (before costs):

  • 1:1 (target = 1 x SL distance): more than 50% of the trades
  • 1:2: more than 33%
  • 1:3: more than 25%

The signals of this indicator reached 1R in about 50% and 2R in about 34% of the cases in our tests - that is about breakeven with a 1:1 or 1:2 target once spread and commission are paid. So:

  • Do not use small targets. Aim for at least 1:2, better 1:3, and let the trade reach the next zone or liquidity level.
  • In our tests the best results came from RANGE OB on H1 (positive at 1:2 and 1:3) and from the higher timeframes (D1). Plain OB signals on M5 were negative at every target.
  • The probability in the label (1R % / 2R %) tells you which targets made sense on your symbol and timeframe: if 2R % is clearly above 33%, a 1:2 target has worked there.

9. FAQ

  • Does it repaint? No. Zones appear after the confirming candle closes, signals after the rejection candle closes. Only the hollow "possible" arrow on the open candle can disappear.
  • Why does the first load take a few seconds? The statistics are calculated on StatsBars bars. Reduce StatsBars for a faster start.
  • Why "not enough data"? There are fewer than MinCases past cases of this type on the chart. Load more history or use a lower timeframe.
  • The session names (Asia, London, NY) use the server time GMT+2 / GMT+3 that most brokers use.
  • Should I close the trade on a CHoCH against it? In our tests this did not help: it cut as many winning trades as losing ones. Use BOS / CHoCH as context.
  • What does the button do? It hides / shows everything the indicator draws. Signals, statistics and alerts keep working.

INPUT PARAMETERS

Order blocks

  • ShowZones, FVGMinATR (min gap size for OB+FVG), ZoneMaxBars (expiry), MaxZonesShown, UsedZonesShown, zone colors and transparency, FrameWidth, ZoneLabels, ShowNewOBMark.

Range order blocks

  • ShowRangeOB, RangeBars (12), RangeMaxATR (3.0), RangeZonesShown, colors, RangeTransparency, SkipInsideRange, HideAgainstStructure (off: hide signals against the last BOS / CHoCH; in tests this gave fewer signals, not better ones).

Signals

  • ShowSignals, SignalsShown (10), BuyColor, SellColor, ArrowSize, ShowSL, SLMode, SLMaxATR (1.5), SLBufferATR (0.1), MoneyLot (0.01), SLLineBars, SLWidth, ShowSignalLabel, LabelsShown, MarkAfterLiquidity, LiqCautionBars, CautionColor, ShowPossible, PossibleColor, PossibleBlink.

Probability

  • ShowProbability, MinCases (30), MaxHoldBars (300), ShowPanel (statistics panel), ShowButton, PanelFontSize.

Structure

  • ShowBOS, ShowCHoCH, PivotBars (3), colors, style, width, StructShown.

Liquidity

  • ShowLiquidity, LiqLevels, EqualTolATR, BSLColor, SSLColor, styles and widths, ShowTaken, TakenShown.

General

  • HistoryBars (objects only for the last N bars), StatsBars (statistics on the last N bars), TextColor (None = automatic).

Alerts

  • AlertPopup, AlertPush, AlertSignal, AlertPossible, AlertCancel, AlertNewOB, AlertTouch, AlertLiquidity.

IMPORTANT

Smart Order Blocks is an analysis tool. It does not open trades. The probabilities describe the past on your chart; they are not a promise for the future. The decision, the stop and the position size are yours.
Рекомендуем также
Contraction Expansion Meter — это четкий и мощный индикатор волатильности, который показывает сжатие и расширение рынка в реальном времени. Он создан на основе логики полос Боллинджера, измеряет относительную ширину полос и сравнивает ее с собственной скользящей средней, превращаясь в интуитивный осциллятор. Что отображается на графике Гистограмма: Синие бары означают расширение (рост волатильности), красные бары — сжатие (падение волатильности / сужение). Аквамариновая линия: Текущая ширина от
Hrum
Yvan Musatov
4 (1)
Индикатор Hrum - был создан для нейтрализации временных пауз и откатов. Он анализирует поведение цены и, если наблюдается временная слабость тренда, вы можите заметить это из показаний индикатора, как и в случае выраженной смены направления тренда. Войти в рынок не трудно, а вот удержаться в нем куда сложнее. С индикатором Giordano Bruno и его уникальной трендовой линией удержаться в тренде станет намного проще! Каждый рост и каждое падение отражается и на вашем эмоциональном состоянии: надежд
Heikin –  Smart Volume Support Overview It provides enhanced visualization of price trends and momentum, with advanced customization options, theme integration, and seamless compatibility with volume-based tools. Designed for manual traders, scalpers, and algorithmic analysts, this indicator offers superior clarity for trend detection, momentum strength, and reversal spotting — especially when combined with volume analysis. Key Features Pure Heikin Ashi Candles Generated natively (not overlays
AlgoKing Chandelier Exit Indicator (MT5) The Chandelier Exit Indicator is a volatility based indicator that maximizes returns using the Average True Range (ATR) value and the highest high or lowest low of a period. Benefits Should be used as a trailing stop. Helps you exit a position when you have a respectable profit. Identifies a high probability of a trend reversal when the price moves against the prevailing trend by a distance equal to 3x the average volatility. Join the AlgoKing Lightning
**News Monitor Allert** Trading the financial markets without being aware of the economic calendar is a critical mistake that leads to unnecessary losses. Even the best technical strategy can fail instantly during a high-impact news release. This utility provides the ultimate solution, acting as a safeguard for your capital. One of the most powerful features of this indicator is its ease of use. Unlike many other tools on the market, **you do not need to configure any external links, download
This indicator marks the relevant volume levels among the day. The two relevant levels are the candle with more volume and the period with more volume of lots transacted.  The filled red background is the range of price with the most relevant volume of the day (probably the big player that is command the game). The purple lines shows the range of price with most volume (probably a area where some big player is accumulating before force a market direction). There is also the dot lines that marks
Ichimoku Map (м гновенный взгляд на рынки ) - построен на базе легендарного индикатора Ichimoku Kinko Hyo. Задача Ichimoku Map давать информацию о силе рынка на выбранных временных периодах и инструментах,  с точки зрения индикатора Ишимоку . Индикатор отображает 7 степеней силы сигнала на покупку и 7 степеней силы сигнала на  продажу. Чем сильнее тренд, тем ярче сигнальный прямоугольник в таблице. Таблицу можно перетаскивать мышью. Размер таблицы зависит от размера шрифта, выбранного в наст
NeuronSniper is a complete ICT (Inner Circle Trader / smart-money) workspace and setup engine for MetaTrader 5 from Neuron Systems. It maps the whole picture, market structure, liquidity, order blocks, fair value gaps and premium/discount, and then marks one strict, high-quality reversal setup with a fixed risk:reward plan. It is an indicator for chart analysis only: it draws on the chart, it does not place, modify or close trades, it does not send orders, and it does not manage positions or acc
Этот индикатор представляет собой индикатор автоматического волнового анализа, который идеально подходит для практической торговли! Случай... Примечание.   Я не привык использовать западные названия для классификации волн. Из-за влияния соглашения об именах Тан Лунь (Тан Чжун Шуо Дзен) я назвал основную волну   ручкой   , а вторичную полосу волн —   сегментом   Ат. в то же время сегмент имеет направление тренда. Именование   в основном является трендовым сегментом   (этот метод именования буде
KT DMA is a modified and advanced version of the classic Displaced Moving Averages with buy/sell crossover alerts and a Multi-Timeframe scanner that shows DMA's direction across each real-time time frame. A Displaced Moving Average is a simple moving average that moves ahead or backward in a time frame (either short-term or long-term). It also allows you to predict price movement more accurately. Features Depicts the trend direction using the alignment of three moving averages. Buy/Sell signals
Осциллятор волатильности KT анализирует прошлые и текущие рыночные данные с помощью математической формулы, отображая результат в виде осциллятора. Растущие и снижающиеся волны соответствуют высокой и низкой волатильности актива.  Проще говоря, волатильность — это измерение колебаний цены актива за определённый период времени. Без волатильности на рынке было бы мало движения, и трейдеры не могли бы зарабатывать на изменениях цен. Использование волатильности на рынке Форекс Использование волатил
Indicator description of Yijing Guaxiang Oscillation Mean Indicator: (1) This Yijing Guaxiang change indicator is based on the Yin-Yang transformation thought of the "I Ching" philosophy in ancient Chinese culture, integrating the results of the long-short game in each candlestick K-line period of the financial trading K-line chart, using China's oldest prediction coding method, in the form of the 64 hexagrams of the I Ching, combining the Yin-Yang of each line of the hexagram with the Yin-Yang
Hurst-YZ Engine measures the one thing those indicators can't: whether the market is structurally trending or structurally mean-reverting, right now. It does this with two pieces of real quant math, the kind used on institutional research desks, not repackaged crossovers. Early-bird pricing active: Only $65 for the next 10 licenses. The price increases by $15 after every 10 copies sold to maintain premium value until it reaches its final target value of $150. Secure your copy at the lowest tie
Shqiponja Gold EA is an advanced automated trading system specifically designed and optimized for Gold (XAU/USD) scalping and trend-following strategies. Built with precise price action mechanics, it targets structural market movements to capture high-probability entries. Key Features: - Optimized for XAU/USD: Tailored specifically to handle the volatility and price action of Gold. - Smart Trend Filtering: Integrates multi-timeframe structural analysis to avoid false breakouts. - Risk Manageme
KT Connors RSI MT5
KEENBASE SOFTWARE SOLUTIONS
KT Connors RSI is a modified and more advanced version of the original Connors RSI developed by Larry Connors. It was designed to help traders generate trade signals based on short-term price movements. The Connors combine the standard RSI calculation with two additional elements: a short-term RSI, ROC, and a moving average. Features Provides more transparent and more actionable buy and sell signals using the overbought/oversold zones. Incorporates short-term RSI and moving average, providing
Horus Market Structure is an analysis indicator for MetaTrader 5. It combines price structure, liquidity and trend context in one chart. FEATURES - BOS and CHoCH structure marks, confirmed pivots and liquidity sweeps. - Automatic multi-swing and best-pair trendlines. - Scored analytical BUY/SELL marks with suggested Entry, SL and TP1-TP3 levels. - Multi-timeframe Order Blocks and Fair Value Gaps. - Adaptive MAX BUY/SELL zones, Stochastic K/D on price, swing zigzag and tick-volume profile. - Mul
VWAP Breakout Entry draws an anchored VWAP from market structure pivots and marks trade entries when price retests it after a breakout. Every signal comes with a stop loss and three take-profit levels, and the chart shows the full trade the way a charting platform would. Symbol : GBPUSD Timeframe : M15 / 15 Minutes Default settings are optimized for GBPUSD on M15 How it works The indicator detects swing highs and lows and anchors a VWAP to the latest structure leg. When price breaks structure a
Buy Sell Signal MTF - Advanced Reversal Indicator Buy Sell Signal MTF is a highly optimized, professional-grade trend reversal indicator designed for MetaTrader 5. It uses a sophisticated dual-layer algorithm combining Volatility (ATR) and Momentum (Stochastic Oscillator) to pinpoint highly accurate entry levels without cluttering your chart with false signals. Whether you are a scalper, day trader, or swing trader, this indicator is built to deliver precision and reliability. The signals are 1
FREE
Индикатор Crypto_Forex "Экспоненциальная гистограмма тренда" для MT5, без перерисовки. - Индикатор экспоненциальной гистограммы тренда очень эффективен для определения тренда. - Лучший способ использования — сочетать его с уровнями поддержки/сопротивления и техникой ретеста (см. изображения): - Как только индикатор обнаружит новый тренд, найдите локальный уровень поддержки/сопротивления и разместите соответствующий отложенный ордер, ожидая ретеста этой зоны. - Если новый тренд восходящий, разме
SMC Inducement Flow - это индикатор для MetaTrader 5, предназначенный для визуализации рыночной структуры, inducement sweep, Fair Value Gaps и compression momentum в одном чистом рабочем процессе. Основная идея: индикатор помогает отслеживать структурный поток, отмечая события BOS и CHoCH, отслеживая активные уровни inducement, выделяя sweep-события и предоставляя полезные буферы для дискреционного анализа или разработки EA. Стартовая цена: продукт публикуется с вводной промо-ценой. Цена может б
Avez-vous toujours rêvé de pouvoir entrer sur le marché juste après la clôture d'une bougie… et de voir le marché évoluer immédiatement dans votre sens ? Avez-vous toujours souhaité détecter les retournements de tendance plus tôt, éviter les faux signaux et, surtout, saisir les tendances longues avant la majorité des traders ? Aujourd'hui, je vais vous présenter mon nouvel indicateur : Prophète du retournement intelligent. Contrairement aux indicateurs traditionnels qui réagissent avec un certa
FlatOut Movings Robot: Absolute control of the flat. Confident navigation in the trend. Indicator strategies based on moving averages have one main nightmare. As soon as the market changes phase, your deposit begins to melt. Classic moving averages generate dozens of false crossovers in a flat. Standard filters are ruthlessly lagging. You sit up at night stressed at the terminal, entering at the very end of the movement. This software was created to solve a specific problem. The robot continuou
McGinley Trend Pullback Strategy - Multi-Average Trend and Pullback System McGinley Trend Pullback Strategy is an automated trading system that trades only when four averages line up in trend order and price confirms against the session VWAP. It enters on a fresh alignment and on pullback bounces off the McGinley Dynamic line, and it uses a Zero-Lag EMA filter to avoid catching the first move after a reversal. Every trade has a stop loss and a take profit. It does not use martingale, grid strat
Индикатор Your Trend не только сигнализирует о немедленной покупке или продаже. Он указывает краткосрочный и долгосрочный тренд. операций. Самым простым вариантом использования индикатора является открытие сделки в сторону существующего тренда. Индикатор позволяет вам подробнее изучить реальный и исторический рыночный тренды! Показывает точки открытия сделок на продажу или покупку, а также указывает направление тренда на: краткосрочном периоде и долгосрочном периодах. Анализ основан на выбраном
If you are unsure how to use this indicator, please feel free to reach out to me. I will explain it to you and provide reading materials to help you make the most of it. TD Sequential Scanner: An Overview The TD Sequential scanner is a powerful technical analysis tool designed to identify potential price exhaustion points and trend reversals in financial markets. Developed by Tom DeMark, this method is widely used by traders to gauge market cycles and potential turning points with precision. Ho
MetaForecast M5
Vahidreza Heidar Gholami
5 (3)
MetaForecast предсказывает и визуализирует будущее любого рынка на основе гармонии в данных о ценах. Хотя рынок не всегда предсказуем, если существует узнаваемый паттерн в ценах, то MetaForecast способен предсказать будущее с наибольшей точностью. По сравнению с другими аналогичными продуктами, MetaForecast способен генерировать более точные результаты, анализируя тренды на рынке. Входные параметры Past size (Размер прошлых данных) Указывает количество баров, которые MetaForecast использует для
# Momentum Curvature - Acceleration versus velocity *Category: Momentum | Difficulty: intermediate | Window: separate window below the chart | Markets: Universal (Forex, indices, commodities, crypto, stocks) | Suggested timeframes: M15, M30, H1, H4, D1* ## Short description > Measures price acceleration, the second derivative of the smoothed series, and compares it with velocity. It detects loss of thrust before direction changes. ### Overview Anyone who drives knows the brake pedal acts o
"Бои между быками и медведями продолжают оказывать влияние на цену даже после того, как бой закончился, оставляя при этом грязное поле, которое внимательные специалисты могут использовать для управления рисками и поиска возможностей. Используйте анализ "трендового зеркала" для изучения таких волатильных зон с поиском действий в прошлом, которые повлияли на текущий тренд, при которых цена разворачивается и пересекает границы". Индикатор RSI Mirrors and Reflections обеспечивает надежную методику с
Crypto Hades Adaptive-Swing  Dynamic Fibonacci Matrix & MTF Trend Alignment Crypto Hades Adaptive-Swing  is an elite institutional-grade Expert Advisor designed specifically for extreme cryptocurrency volatility (BTCUSD, ETHUSD). Named after Hades, the Greek god of the underworld, this EA waits patiently for deep pullbacks and strikes at the most advantageous "underworld" price levels using a dynamic mathematical matrix. Unlike standard trend followers that buy at the top, Hades uses a Multi-
С этим продуктом покупают
Trend Sniper X
Sarvarbek Abduvoxobov
4.86 (44)
Trend Sniper X — это трендовый индикатор для MetaTrader 5, работающий на нескольких таймфреймах, который помогает трейдерам точно и ясно определять направление тренда и потенциальные точки разворота. для MT4: https://www.mql5.com/en/market/product/193245 Информация о цене: Текущая цена является промо-ценой и может измениться по мере выхода предстоящих обновлений и новых функций. Бонусное предложение: Чтобы получить БЕСПЛАТНЫЙ авто-трейд советник Assistant EA для этого индикатора, пожалуйста, на
Новый король в городе — Индикатор + управление ордерами (TP1 + TP2 + TP3) + опциональный Telegram-сигнал-сендер ВКЛЮЧЁН (БЕСПЛАТНО) (ПОЛНОЦЕННАЯ ТОРГОВАЯ И СИГНАЛЬНАЯ СИСТЕМА) Gold Slayer EA Этот индикатор включает в себя продвинутую стратегию, торговую систему с настраиваемым управлением ордерами и систему mean reversion, которая сочетает расширения Envelope и поддерживается несколькими интеллектуальными фильтрами подтверждения, такими как RSI, для поиска высоковероятных точек разворота с сигн
Smart Trend Trading System — MetaTrader 5 После покупки напишите мне на MQL5, чтобы БЕСПЛАТНО получить Smart Universal Expert Advisor, а также доступ к онлайн-курсу, руководство в формате PDF и доступ к закрытой группе. STTS объединяет направление тренда, сигналы входа и выхода, зоны разворота и важные ценовые уровни прямо на графике. Торгуйте по системе вручную или подключите отдельный совместимый советник для автоматического исполнения с выбранными вами настройками. ОДНА СИСТЕМА. ЧЕТЫРЕ ТОРГОВ
Zoryk Gold
Reda El Koutbane
4.79 (19)
Скидка заканчивается через 24 часа — следующая цена $ 69 ZORYK — продвинутая сигнальная система для XAUUSD в MetaTrader 5 Вам знакомо это чувство. Вы долго анализируете золото. Ждёте подходящего момента для входа. Наконец открываете сделку — и цена сразу начинает двигаться против вас. Вы закрываете позицию слишком рано, передвигаете Stop Loss или сомневаетесь всего несколько секунд. После этого рынок достигает именно той цели, которую вы ожидали изначально, но уже без вас. Проблема не всегда за
Получите своё торговое преимущество в поле зрения! M5 Sniper — это новый индикатор от MeanFX. Он сочетает точные торговые сигналы с адаптивными уровнями TP/SL — в результате создавая лучшие возможные статистические сделки! Цена увеличивается каждые 5 покупок, следующая цена — 69$ Напишите мне после покупки, чтобы получить советы/руководство и бонусного EA Что выделяет его среди других? Проверенная статистическая эффективность на Gold XAUUSD ( работает практически на каждом активе , с акцентом н
Entry Points Pro показывает, где входить, где ставить стоп и каким лотом торговать — до того, как вы поставите ордер. ЦЕНА Сейчас 199 USD: 8 копий по этой цене, затем 249 USD. Финальная цена — 349 USD. Я зарабатываю торговлей на рынке и показываю это, поэтому мне не нужно продавать этот индикатор всем подряд. Это инструмент для трейдеров, которые думают своей головой, а не волшебная кнопка. Нет пробоя — нет сделки. Серая стрелка — отменённый сигнал: цена не пробила сигнальную свечу, значит, н
ULTRA - это технический индикатор, который который работает по принципу “Все включено” - самостоятельно анализирует рынок, дает торговые сигналы, показывает уровни для установки стоп лосс, а также подсказывает когда нужно закрывать сделки, чтобы получить профит или минимизировать убыток. То есть, не важно, что ты не умеешь анализировать рынок, определять уровни - где поставить SL или плохо совладаешь с мани-менеджментом. ULTRA все это сделает вместо тебя! БОНУС ДЛЯ ПОКУПАТЕЛЯ : После покупки ULT
Gann Made Easy   - это профессиональная, но при этом очень простая в применении Форекс система, основанная на лучших принципах торговли по методам господина У.Д. Ганна. Индикатор дает точные BUY/SELL сигналы, включающие в себя уровни Stop Loss и Take Profit. ПОЖАЛУЙСТА, СВЯЖИТЕСЬ СО МНОЙ ПОСЛЕ ПОКУПКИ, ЧТОБЫ ПОЛУЧИТЬ ТОРГОВЫЕ ИНСТРУКЦИИ И ОТЛИЧНЫЕ ДОПОЛНИТЕЛЬНЫЕ ИНДИКАТОРЫ БЕСПЛАТНО! Вероятно вы уже не раз слышали о торговли по методам Ганна. Как правило теория Ганна отпугивает от себя не только
SuperScalp Pro
Van Minh Nguyen
4.54 (37)
SuperScalp Pro - Professional Multi-Layer Confluence Scalping System SuperScalp Pro — это продвинутый индикатор для скальпинга, который расширяет возможности классического Supertrend с помощью нескольких интеллектуальных фильтров подтверждения. Он помогает выявлять торговые возможности Buy/Sell с более высокой вероятностью успеха и значительно сокращать количество ложных сигналов. Чёткие стрелки Buy и Sell отображаются непосредственно на графике вместе с автоматически рассчитываемыми в реальном
GoldenX Entry MT5
VividMind Digital Solutions
5 (17)
GoldenX Entry — это индикатор для MT5 с адаптивным алгоритмом Smart Entry Trend, системой оценки сигналов, детектором рыночных режимов и фильтром волатильности. Каждый сигнал включает рассчитанный уровень входа, три уровня Take-Profit (TP1, TP2, TP3) и уровень Stop-Loss. Он построен на нескольких аналитических слоях, предназначенных для адаптации к различным рыночным условиям, объединяя многоуровневую аналитическую систему со встроенным оптимизатором и системой статистического отслеживания. Инди
Gold Trend Coach MT5
Cristhian Alexander Gaibor Cuasquer
4.27 (11)
Сигналы на покупку и продажу по золоту (XAUUSD) для MetaTrader 5 без перерисовки. У каждого сигнала есть stop loss и три take profit. Фильтр Smart Money Concepts с BOS и CHoCH, чтобы вы торговали по структуре, а не против неё. Живой Ментор на панели ведёт вас на каждом шаге, от входа до TP3. И алерты прямо на телефон и в ваш собственный Telegram-канал. Это Gold Trend Coach. Больше никакой торговли в одиночку. БЕСПЛАТНЫЙ НАБОР ПОКУПАТЕЛЯ к вашей покупке: 1. Telegram Alert Bridge: ваши сигналы пр
SMC Intraday Formula
VividMind Digital Solutions
5 (26)
Давайте сначала будем честны. Ни один индикатор сам по себе не сделает вас прибыльным. Если кто-то говорит вам обратное — он продаёт вам мечту. Любой индикатор, который показывает идеальные стрелки покупки/продажи, можно сделать безупречным — просто увеличьте нужный участок истории и сделайте скриншот успешных сделок. Мы так делать не будем. SMC Intraday Formula — это инструмент. Он считывает структуру рынка за вас, определяет зоны с наивысшей вероятностью движения цены и точно показывает, как
Boba Analysis Suite
Trade Ready Solutions LLC
5 (2)
Boba Analysis Suite Boba Analysis Suite — аналитический индикатор для MetaTrader 5. Он объединяет структуру рынка, значимые ценовые зоны и общий рыночный контекст в одном представлении на графике. Индикатор разработан на основе практического опыта трейдера и наставника по трейдингу. Он помогает выстроить последовательный процесс анализа: оценивать направление рынка, определять важные уровни и рассматривать несколько таймфреймов в совокупности. Анализ с учётом контекста Значение отдельных сигнало
Следующее обновление — версия 2.52 уже скоро! [НОВОЕ] Приготовьтесь к 4 новым важным функциям, призванным улучшить ваш анализ рынка и торговый процесс. Мы выводим анализ рынка на новый уровень с помощью 4 новых функций, разработанных с учётом ваших потребностей в трейдинге. Представляем: 1. TRADE OVERVIEW DASHBOARD 2. CONFLUENCE AT ZONE 3. STRONG & WEAK HIGH/LOW 4. OTE 1. TRADE OVERVIEW DASHBOARD Панель, которая помогает легче понимать общую картину рынка, предоставляя рекомендации для поддержк
FX Power: Анализируйте силу валют для более эффективной торговли Обзор FX Power — это ваш незаменимый инструмент для понимания реальной силы валют и золота в любых рыночных условиях. Определяя сильные валюты для покупки и слабые для продажи, FX Power упрощает принятие торговых решений и выявляет высоковероятные возможности. Независимо от того, хотите ли вы следовать за трендами или предсказывать развороты с использованием экстремальных значений дельты, этот инструмент идеально адаптируется под
M1 SNIPER   — это простая в использовании торговая система. Это стрелочный индикатор, разработанный для тайм фрейма M1. Индикатор можно использовать как отдельную систему для скальпинга на тайм фрейме M1, а также как часть вашей существующей торговой системы. Хотя эта торговая система была разработана специально для торговли на M1, ее можно использовать и с другими тайм фреймами. Первоначально я разработал этот метод для торговли XAUUSD и BTCUSD. Но я считаю этот метод полезным и для торговли на
FiboSniper Pro – Multi-Filter Fibonacci System with Auto SL/TP and Control Panel FiboSniper Pro — это технический индикатор, который объединяет динамические Fibonacci Envelopes с несколькими фильтрами подтверждения для формирования отборных сигналов Buy и Sell. Уровни Fibonacci рассчитываются на основе Moving Average и ATR, а затем фильтруются с помощью ADX, EMA, RSI, ATR, Volume, Time и структуры свечи. Индикатор отображает на графике автоматические уровни Stop Loss и Take Profit на основе ATR,
Auto Optimized SpeedAngle — это система векторизации импульса институционального уровня, которая исключает подгонку под исторические данные (curve-fitting) за счет непрерывной форвард-оптимизации (Walk-Forward Optimization, WFO). Вместо того чтобы полагаться на статические входные параметры, которые теряют эффективность при смене рыночных режимов, индикатор динамически перекалибрует свои настройки, используя валидацию на вневыборочных данных (Out-of-Sample, OOS). Это гарантирует, что отображаемы
Sqn Max Indicator Sqn Max is an exclusive indicator to trade the market with high effectiveness. The indicator is based on price action, volatility and trend. This indicator is as simple as possible but not too simple. The indicator can generate alerts to ease the trading process. You don't have to stay all day in front of your screen. The indicator can be used with any class of assets and with any time frame. It is possible to achieve better results trading our list of selected assets. We achi
Smc Pro ToolKit
Talal N Z Aljarusha
5 (14)
SMC PRO TOOLKIT — SMART MONEY ANALYSIS & STRUCTURED TRADE PLANNING SMC Pro ToolKit is a professional Smart Money Concepts analysis workspace for MetaTrader 5. It combines market structure, multi-timeframe analysis, institutional price zones, setup evaluation, confirmation tools, volume context, alerts, and risk planning inside one organized chart environment. One workspace. Multiple layers of confirmation. One structured trading plan. OPEN COMPLETE USER GUIDE MULTI-CONDITION SETUP ENGINE At
SIO Oscillator: самооптимизирующийся осциллятор дисбаланса семивариаций Купите индикатор и получите советник (EA) на его основе БЕСПЛАТНО. Большинство осцилляторов воспринимают любое движение цены одинаково. SIO разделяет давление покупателей и продавцов и измеряет дисбаланс между ними, показывая, какая сторона действительно контролирует рынок. Когда дисбаланс достигает экстремума, SIO выдаёт чёткий сигнал с уровнями входа, Stop Loss и Take Profit. Главное отличие SIO в том, что он не полагается
Power Candles V3 — самооптимизирующийся индикатор силы Power Candles V3 преобразует силу валюты и инструмента в готовый к использованию торговый план на каждом графике, к которому он прикреплен. Вместо того, чтобы просто раскрашивать свечи, он выполняет автоматическую оптимизацию в режиме реального времени в фоновом режиме и предоставляет вам оптимальные значения Stop Loss, Take Profit и порог сигнала для выбранного вами символа. Один клик — и все готово для реальной торговли: на графике появляю
Atomic Analyst — MetaTrader 5 После покупки напишите мне на MQL5, чтобы БЕСПЛАТНО получить Smart Universal Expert Advisor, а также доступ к онлайн-курсу, руководство в формате PDF и доступ к закрытой группе. Atomic Analyst объединяет анализ ценового движения, направление тренда, сигналы входа и выхода, уровни Stop Loss и несколько уровней Take Profit прямо на графике. УВИДЬТЕ СИГНАЛ. ОЦЕНИТЕ ТОРГОВУЮ СИТУАЦИЮ. Atomic Analyst представляет результаты анализа в понятном визуальном виде: • Стрелки п
Unix Scalper — MetaTrader 5 После покупки напишите мне на MQL5, чтобы БЕСПЛАТНО получить Smart Universal Expert Advisor, а также доступ к онлайн-курсу, руководство в формате PDF и доступ к закрытой группе. Найдите торговую ситуацию. Оцените план. Выберите способ торговли. UNIX Scalper объединяет анализ рынка, решения BUY/SELL/WAIT и уровни Entry, Stop Loss, TP1 и TP2 в одной удобной панели. УВИДЬТЕ СИГНАЛ И ТОРГОВЫЙ ПЛАН • Понятные решения: BUY, SELL или WAIT. • Определённые уровни: Entry, Stop
Индикатор Tokyo Indicator обеспечивает наглядное представление о направлении тренда, потенциальных торговых сигналах и текущей рыночной ситуации. Его ступенчатая линия тренда с цветовой индикацией позволяет различать «бычьи» фазы (выделены синим цветом) и «медвежьи» фазы (выделены пурпурным цветом). Соответствующие стрелки указывают на возможные точки входа в рынок (покупку или продажу) при смене тренда. Встроенная информационная панель объединяет данные о текущем сигнале, рыночном настроении,
Astral Structure Оцените сетап. Посмотрите его первоначальный план. Специальная цена запуска - $99. $149 после запуска. Структурный сетап ставит сразу несколько вопросов: согласуется ли общая картина, где находится ориентир стопа и как определены цели? Astral Structure объединяет эти вопросы в одном рабочем пространстве для трейдеров, самостоятельно принимающих решения на основе структуры рынка. Сосредоточьтесь на актуальном сетапе. Рассматривайте последний подходящий сетап, его направление и кв
Crystal Heikin Ashi Signals—Professional Trend & Signal Detection Indicator Advanced Heikin Ashi Visualization with Intelligent Signal System for Manual & Automated Trading Final Price: $149 ---------> Price goes up $10 after every 10 sales . Limited slots available — act fast . Overview User Guide PDF Crystal Heikin Ashi Signals is a professional-grade MetaTrader 5 indicator that combines pure Heikin Ashi candle visualization with an advanced momentum-shift detection system. Designed for both m
Trend Catcher   анализирует движения рыночных цен, используя комбинацию собственных и индивидуально разработанных адаптивных индикаторов анализа тренда. Он определяет истинное направление рынка, отфильтровывая краткосрочные шумы и фокусируясь на силе импульса, расширении волатильности и поведении ценовой структуры. Он также использует комбинацию сглаживающих и фильтрующих тренд индикаторов, таких как скользящие средние, RSI и фильтры волатильности. Мониторинг реальных операций, а также другие
Мультивалютный индикатор силы и импульса MT5 Dynamic Forex28 Navigator — развитие наших давно популярных индикаторов, объединяющее силу пяти в одном: Advanced Currency Strength28 Indicator (700 отзывов) Advanced Currency IMPULSE with ALERT (530 отзывов) Currency Strength EXOTICS GOLD Impulse with Alert CS28 Combo Signals (текущий бонус) Не нужно покупать четыре индикатора и ставить их на графики. Всё объединено в одном мощном индикаторе: сила 28 пар Forex, импульс рынка, который их ведёт, и опов
Scalper Vault — это мощная, полноценная торговая система, созданная для трейдеров, которые стремятся к стабильным результатам в внутридневной торговле. Этот высокоточный индикатор представляет собой комплексное, самостоятельное торговое решение, обеспечивающее аналитику профессионального (институционального) уровня как для торговли на рынке Forex, так и для работы с бинарными опционами. Пожалуйста, свяжитесь со мной после покупки, чтобы получить мои торговые советы, а также отличный бонус! Исклю
Другие продукты этого автора
MACD Adaptive is a MACD that adjusts its periods to the market and never repaints. Every bar is calculated only with the data available up to that bar. If you reload the chart or restart the terminal, the history looks exactly the same as it did live. What you see in the past is what you would have seen in real time. MAIN FEATURES Adaptive periods: shorter in a clean trend, longer in choppy noise. Can be switched off for a classic MACD. Buy / Sell arrows on a CLOSED bar (final, never disappear)
FREE
Plan, test and track your trades directly on the MT5 chart: a long / short position tool with partial take profits, a moving stop loss, a trading journal, statistics and alerts. Click LONG or SHORT, click on the chart where the entry should be, drag the SL and TP - and you see the risk and the reward in money, the R:R and the lot for your risk %. Press SAVE and the tool stays on the chart: it is tracked candle by candle on the history and live, and every saved trade goes into the statistics and
A free long / short position tool for MetaTrader 5: click where the entry should be, drag the stop loss and the take profit, and see the risk and the reward in money, the R:R and the lot for your risk % of the balance. No more counting points and pip values before every trade: the tool shows the lot that keeps your risk at the % you choose, with the commission included. The indicator does not open or close trades. It is a planning tool, the decision is yours. MAIN FEATURES Click to place: press
FREE
A free chart-pattern indicator for MetaTrader 5 that tells you the truth about each pattern: how often it really reached 1R and 2R on your symbol and timeframe, next to what a random entry with the same stop did. Most pattern indicators only draw arrows. This one measures them. Every signal shows its historical win % and the "random %" for the same direction and stop size, so you can see at once whether a pattern has an edge on the chart you trade - or not. The indicator does not open or close t

FREE
Фильтр:
Нет отзывов
Ответ на отзыв