Smart Order Blocks
- Indicateurs
- Version: 1.32
- Activations: 10

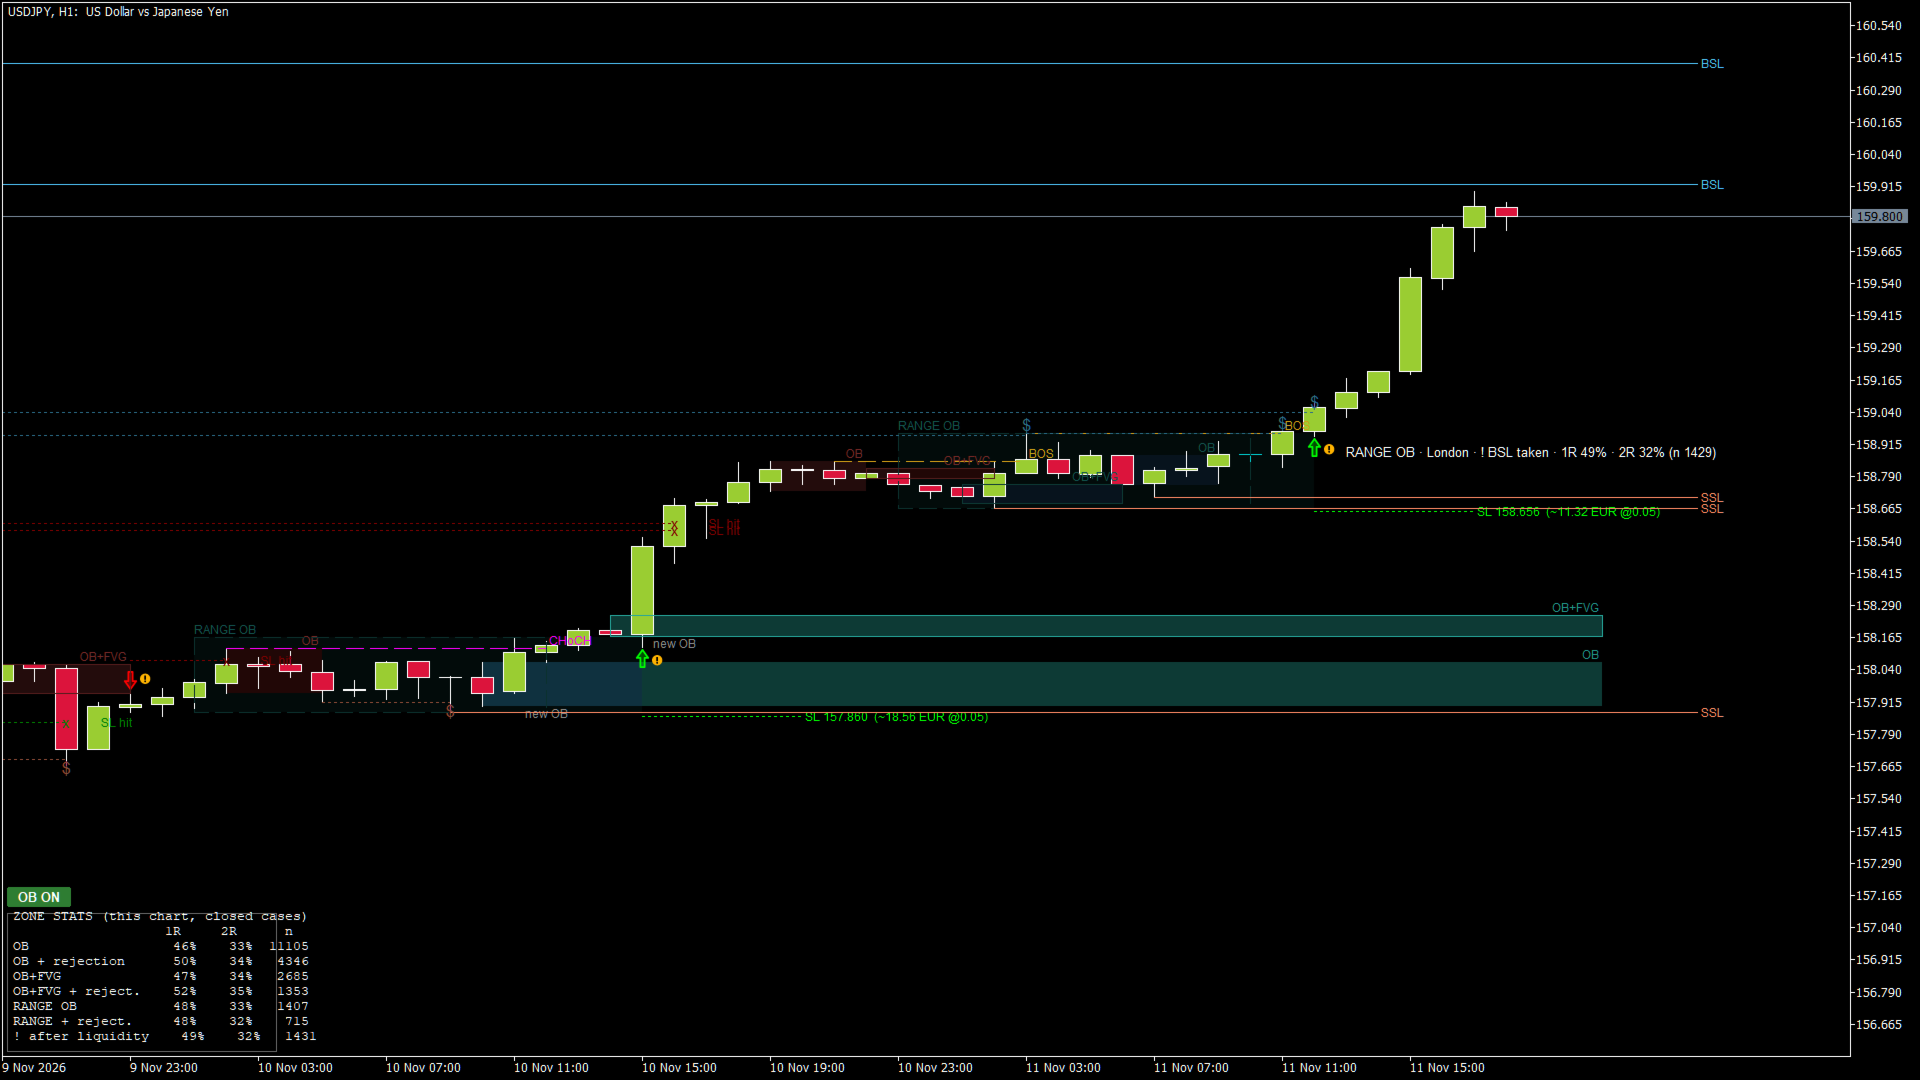
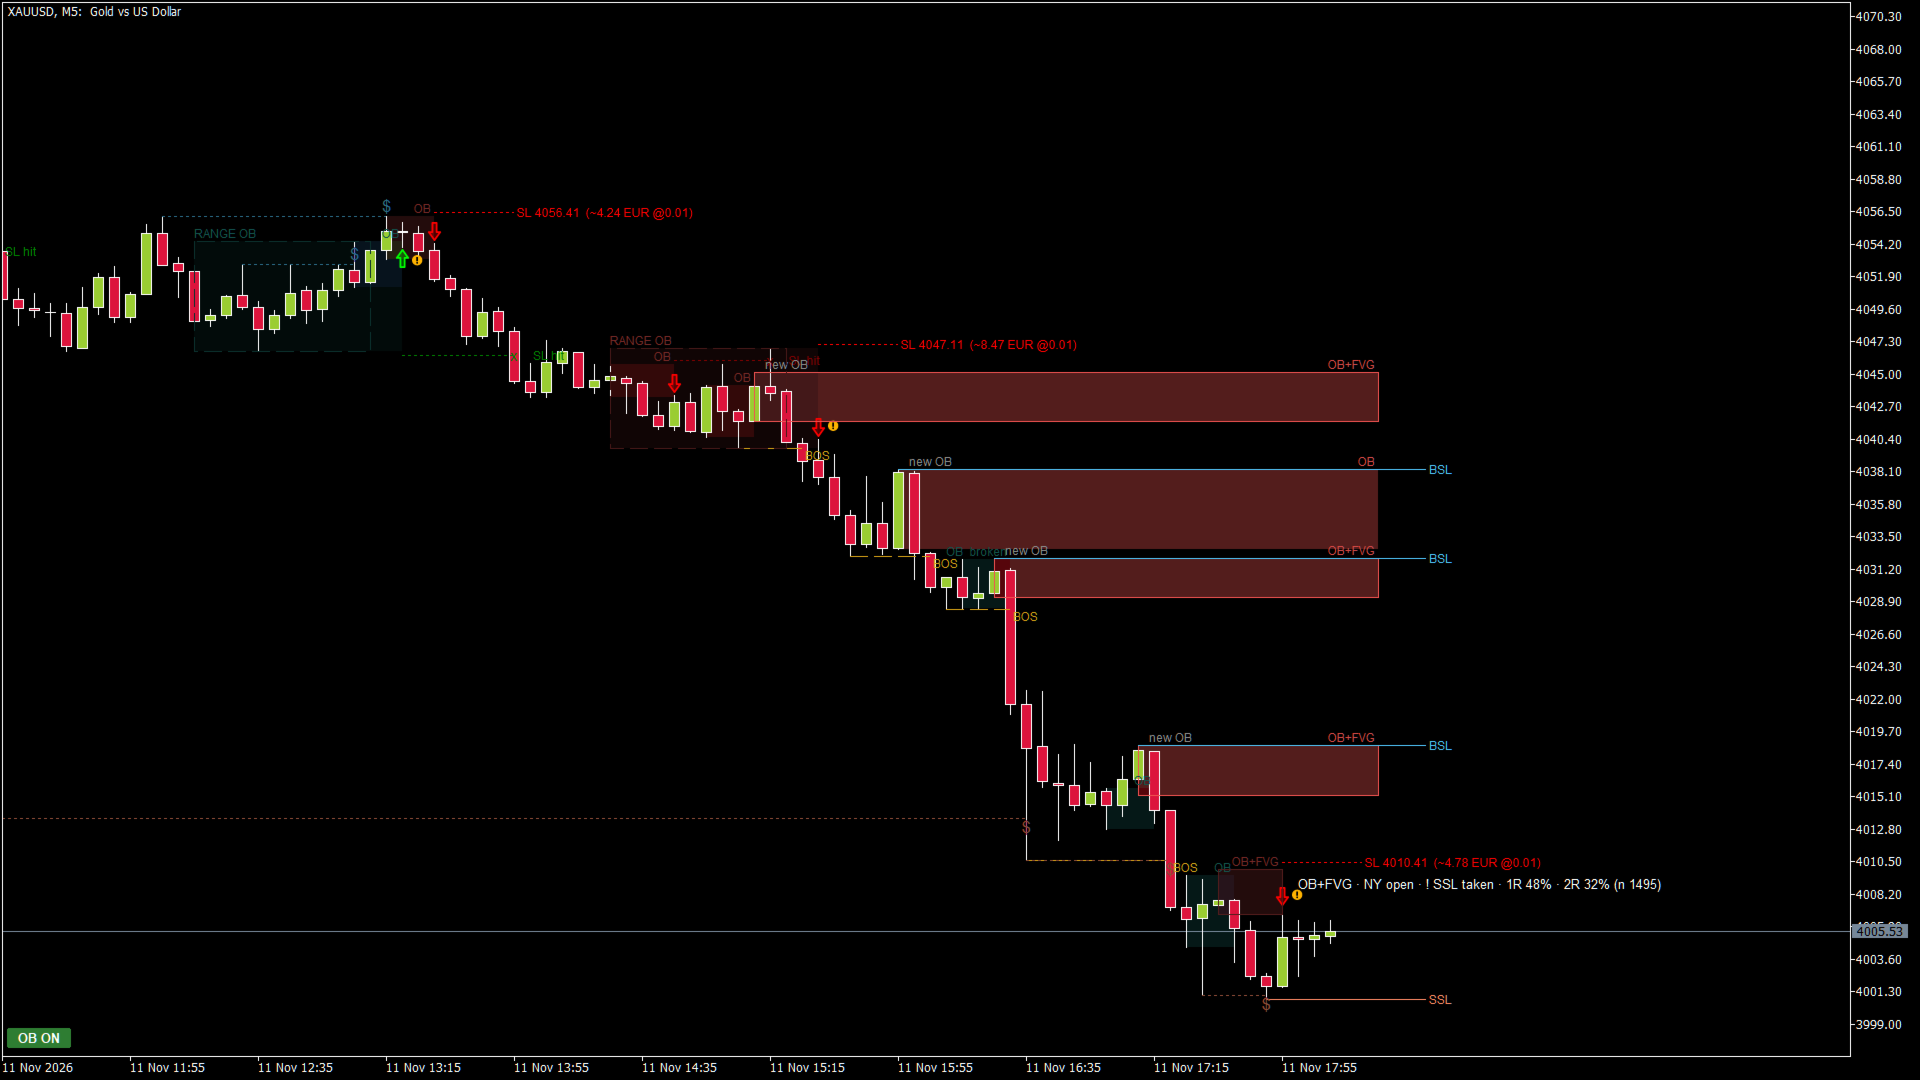
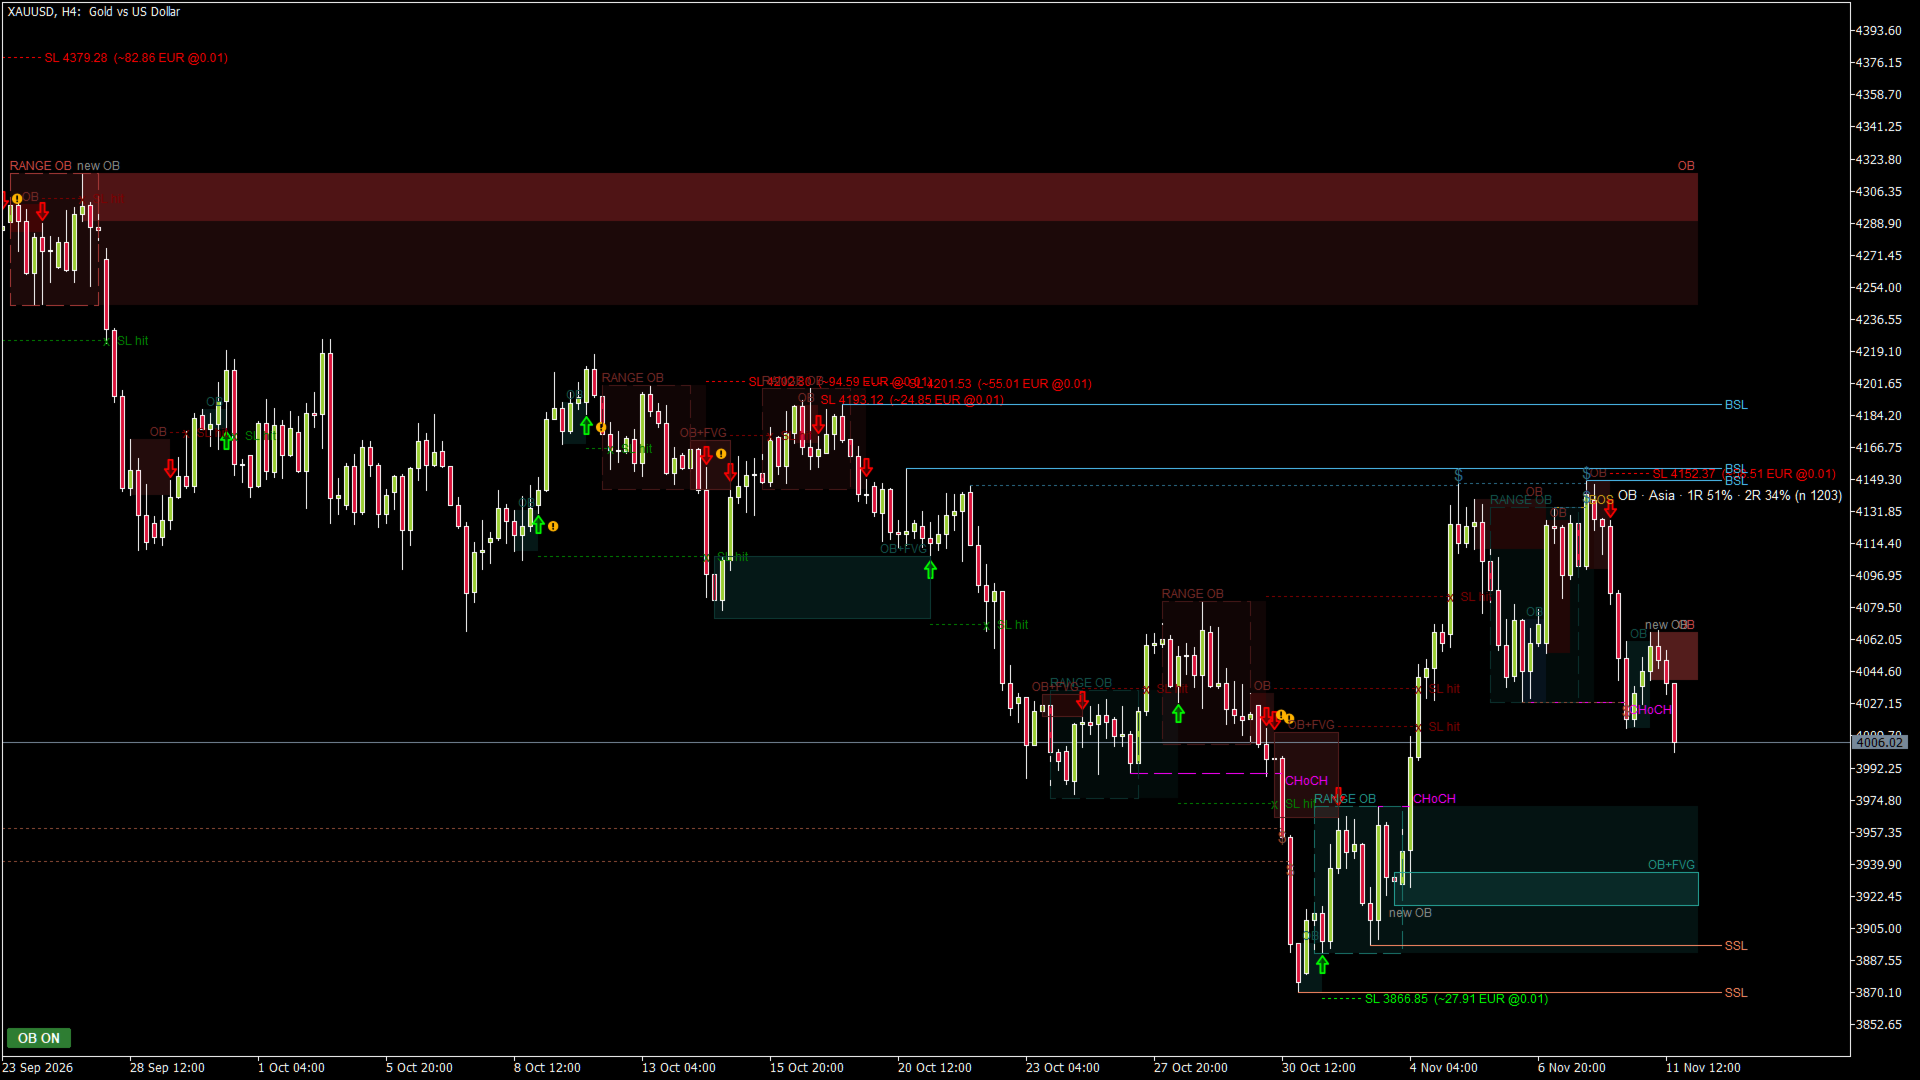
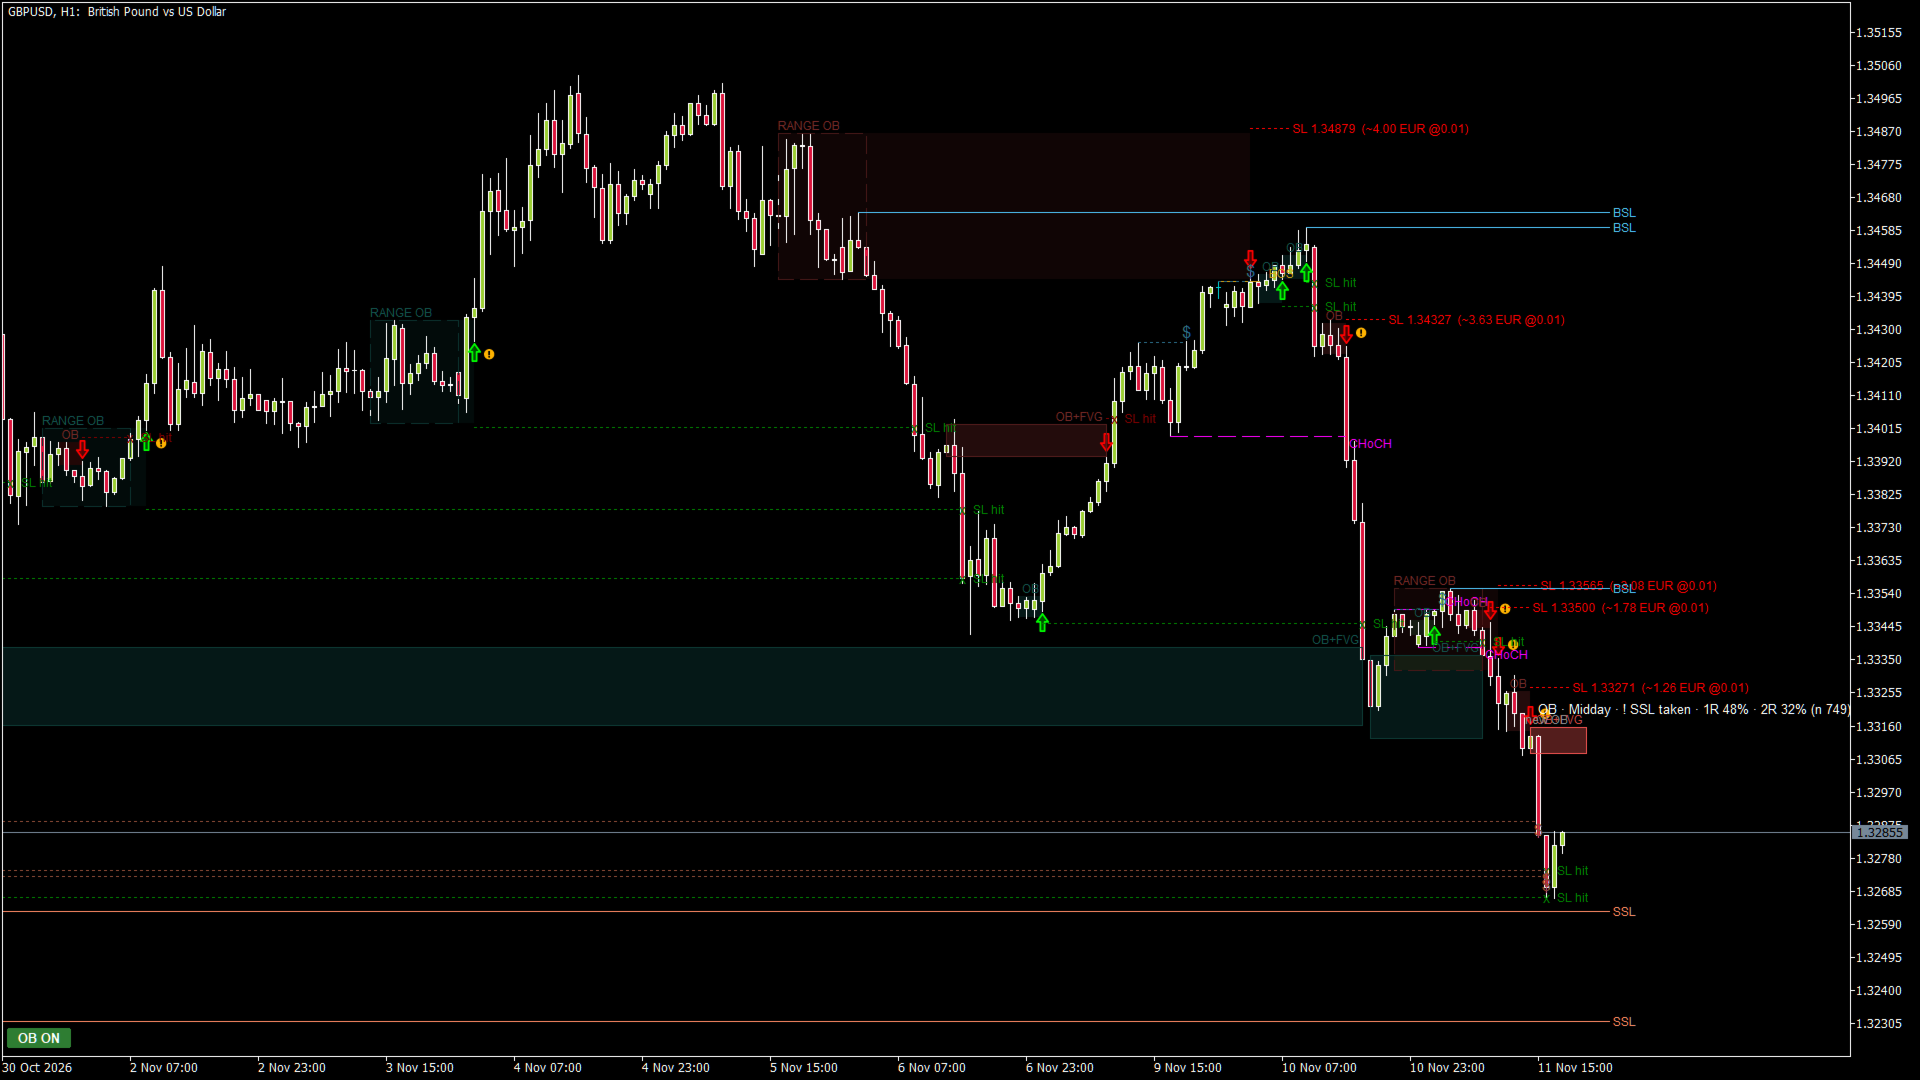
Smart Order Blocks puts the main Smart Money Concepts on one clean chart: order blocks, fair value gaps (FVG), range order blocks, market structure (BOS / CHoCH) and liquidity (BSL / SSL, equal highs / lows, liquidity taken). It gives a signal when price touches a zone and rejects it, and shows how often that type of signal worked in the past ON YOUR CHART.
Nothing is drawn before it happened and nothing repaints: a zone appears only after the candle that confirms it has closed, and a signal only after the rejection candle has closed.
Great for learning Smart Money Concepts: hover the mouse over any zone, arrow or line and a short explanation tells you what it is, why it is there and where the SL would be. You see the concepts on real charts instead of reading about them.
HOW TO USE IT IN 5 STEPS
1) Attach it to an H1 chart and look at the zones: green = bullish order blocks (possible support), red = bearish (possible resistance). The light box is a RANGE OB, the strongest zone type.
2) Check the context: BOS / CHoCH show the direction of the structure, BSL / SSL show where stop orders rest above highs and below lows.
3) Wait for an arrow: a candle touched a zone and closed back outside it. The label shows the zone type and how often this type worked on your chart.
4) Use the dotted SL line behind the zone for your stop and size the position from that distance (the label shows the risk in money). Many traders take the entry on M5 / M15 in the direction of the H1 zone.
5) Skip signals marked with "!" and wait when arrows come in both directions within a few candles.
MAIN FEATURES
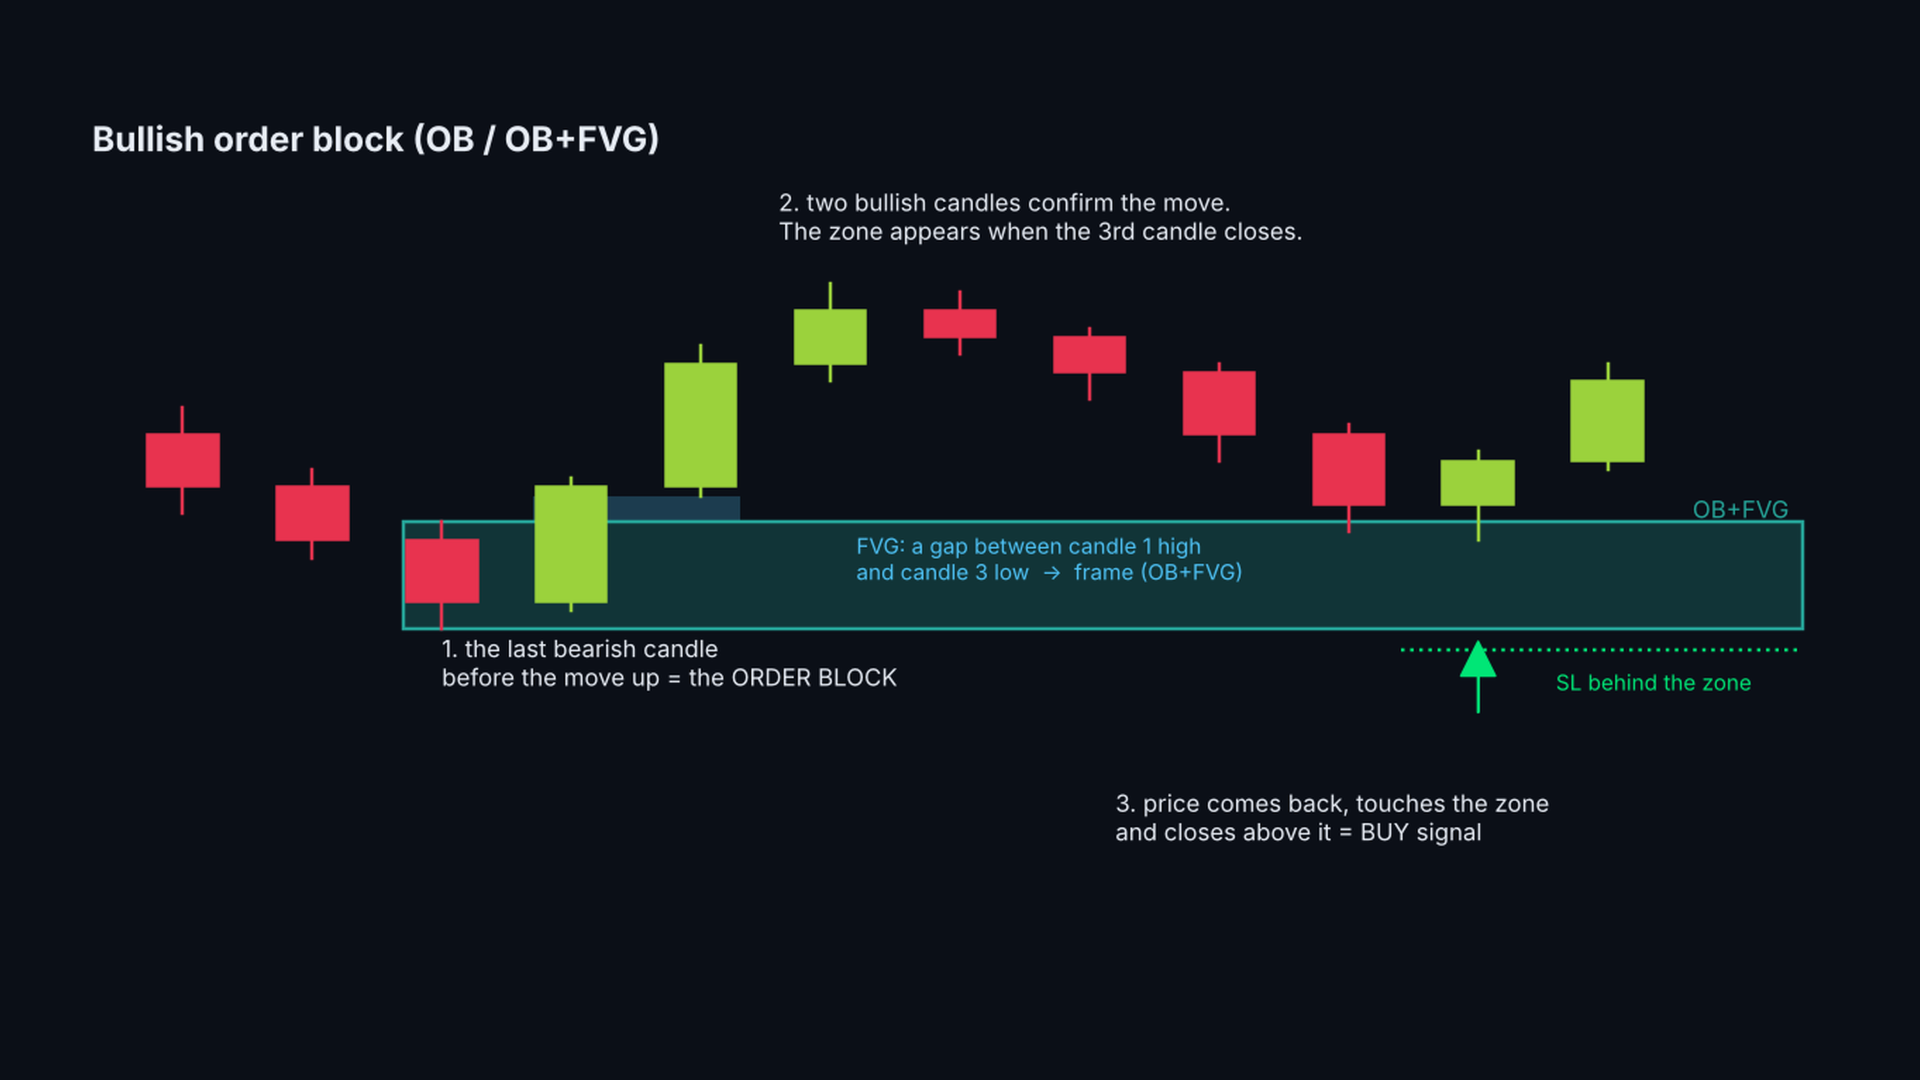
- Order blocks (OB): the last opposite candle before a move, confirmed when the 3rd candle closes.
- OB + fair value gap: order blocks whose move left a price gap are marked with a frame.
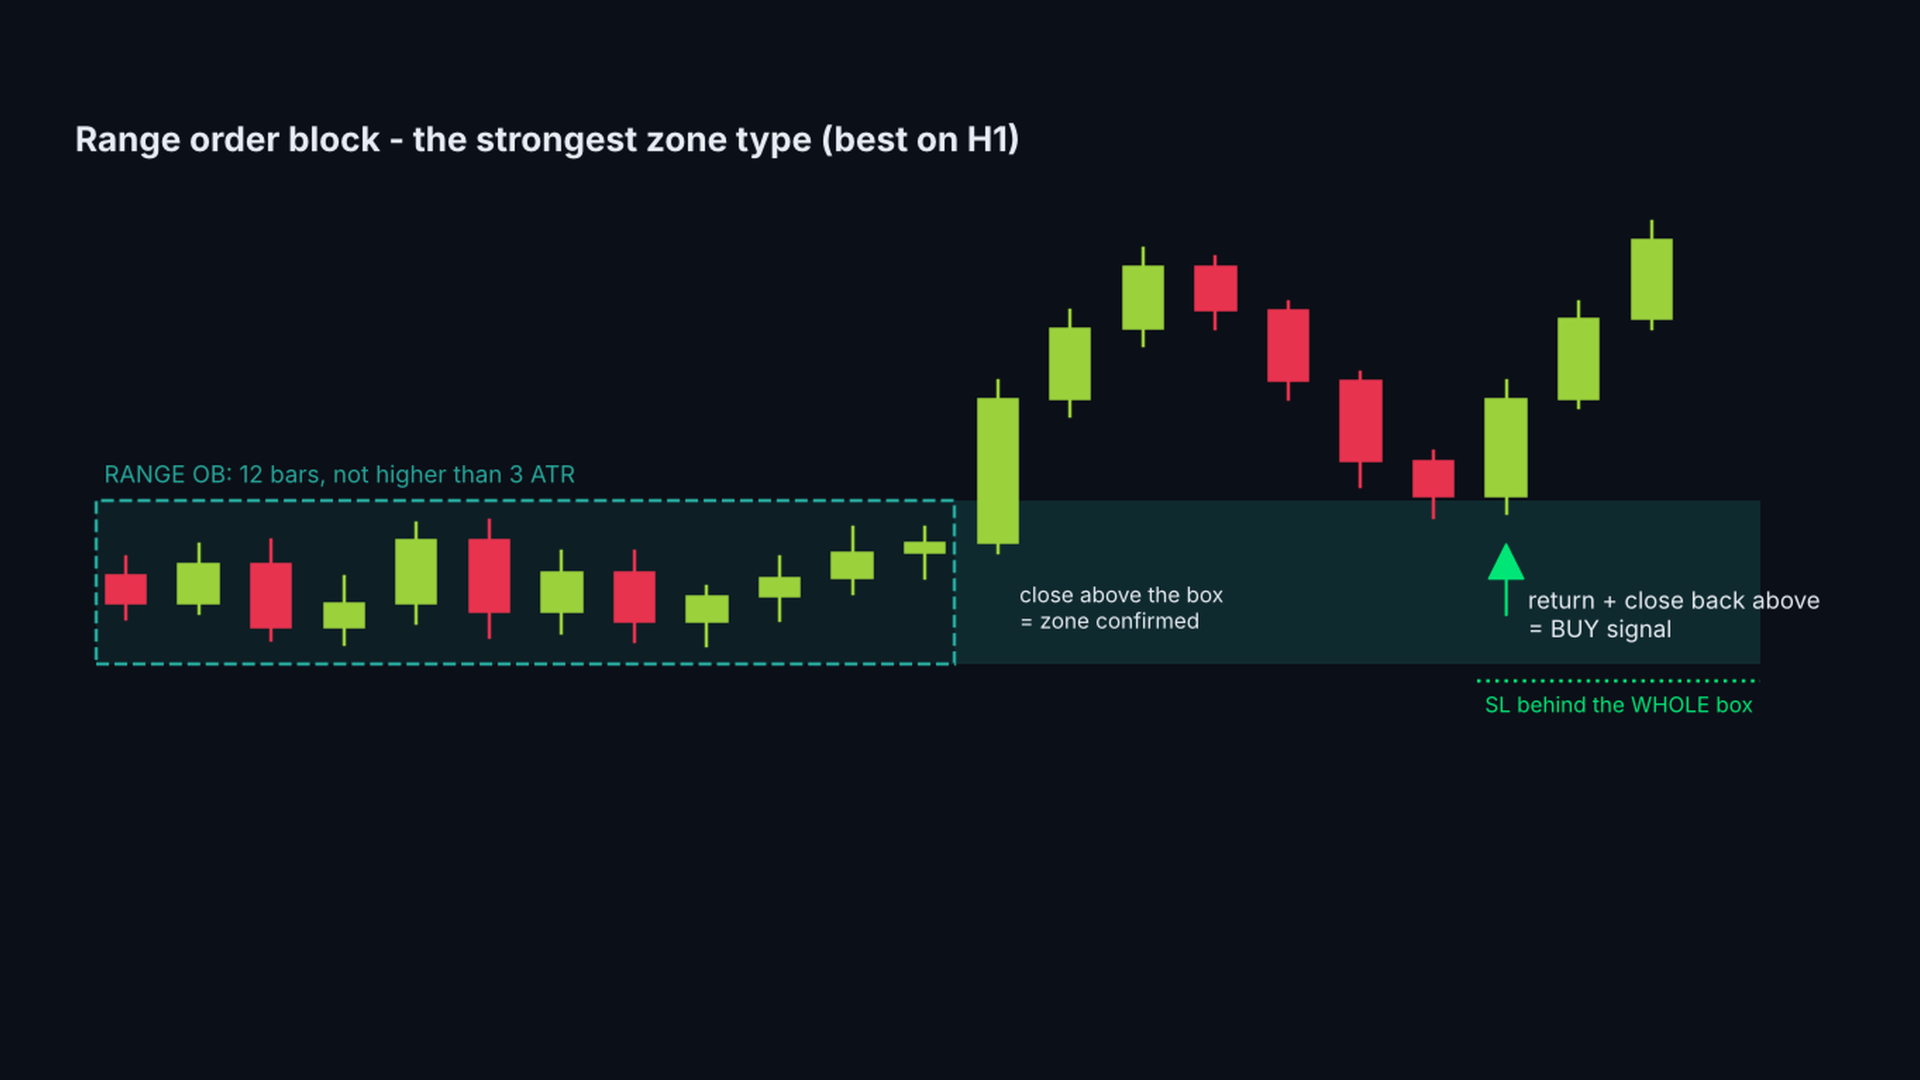
- Range order blocks: a consolidation of 12 bars followed by a close beyond it. The whole box is the zone.
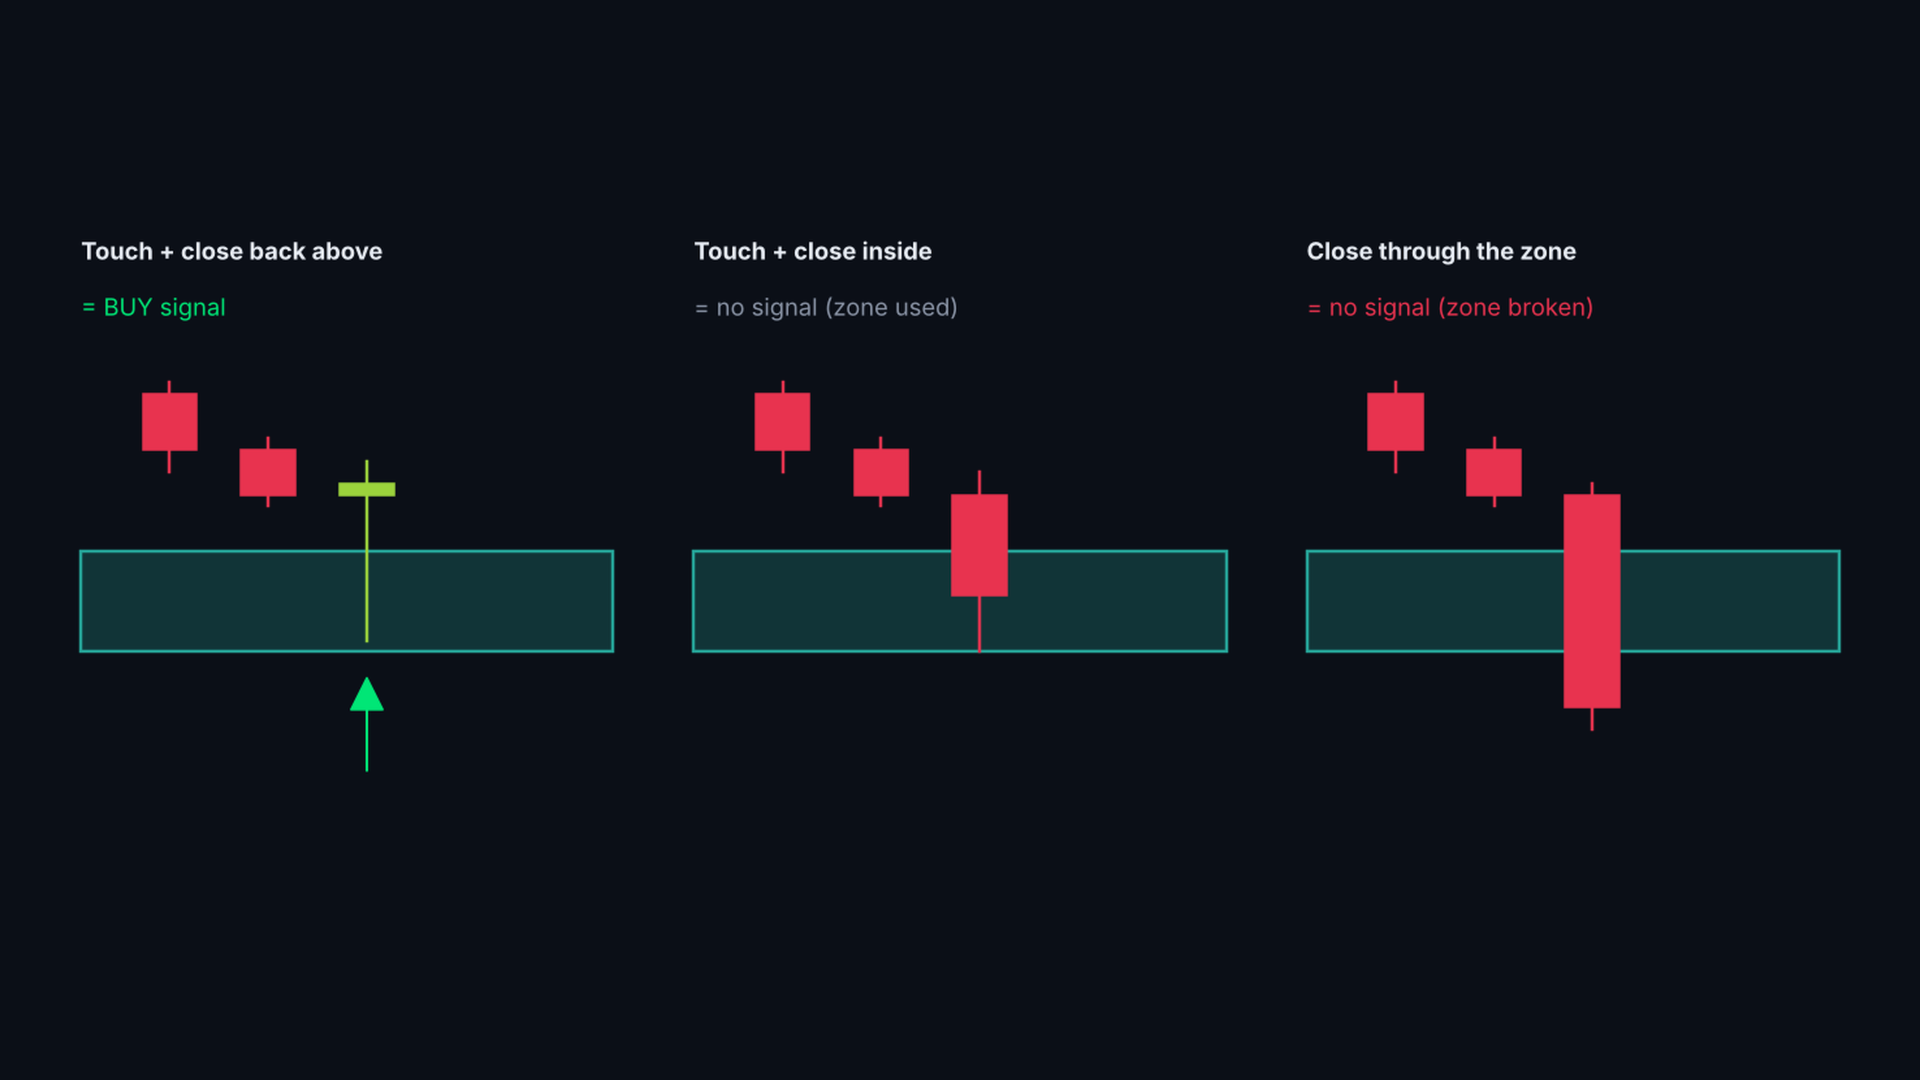
- Rejection signals: a closed candle that touched an untouched zone and closed back outside it. Arrow + SL line behind the zone.
- Possible signal: a hollow arrow while the candle is still open and touching a zone. It becomes a signal on the close or disappears.
- Honest probability: for every signal type the indicator counts how often price reached 1R and 2R before the SL in the past cases on this chart (walk-forward, no look-ahead).
- Fair value gaps: order blocks whose move left an FVG get a frame (OB+FVG), FVGMinATR sets the minimum gap size.
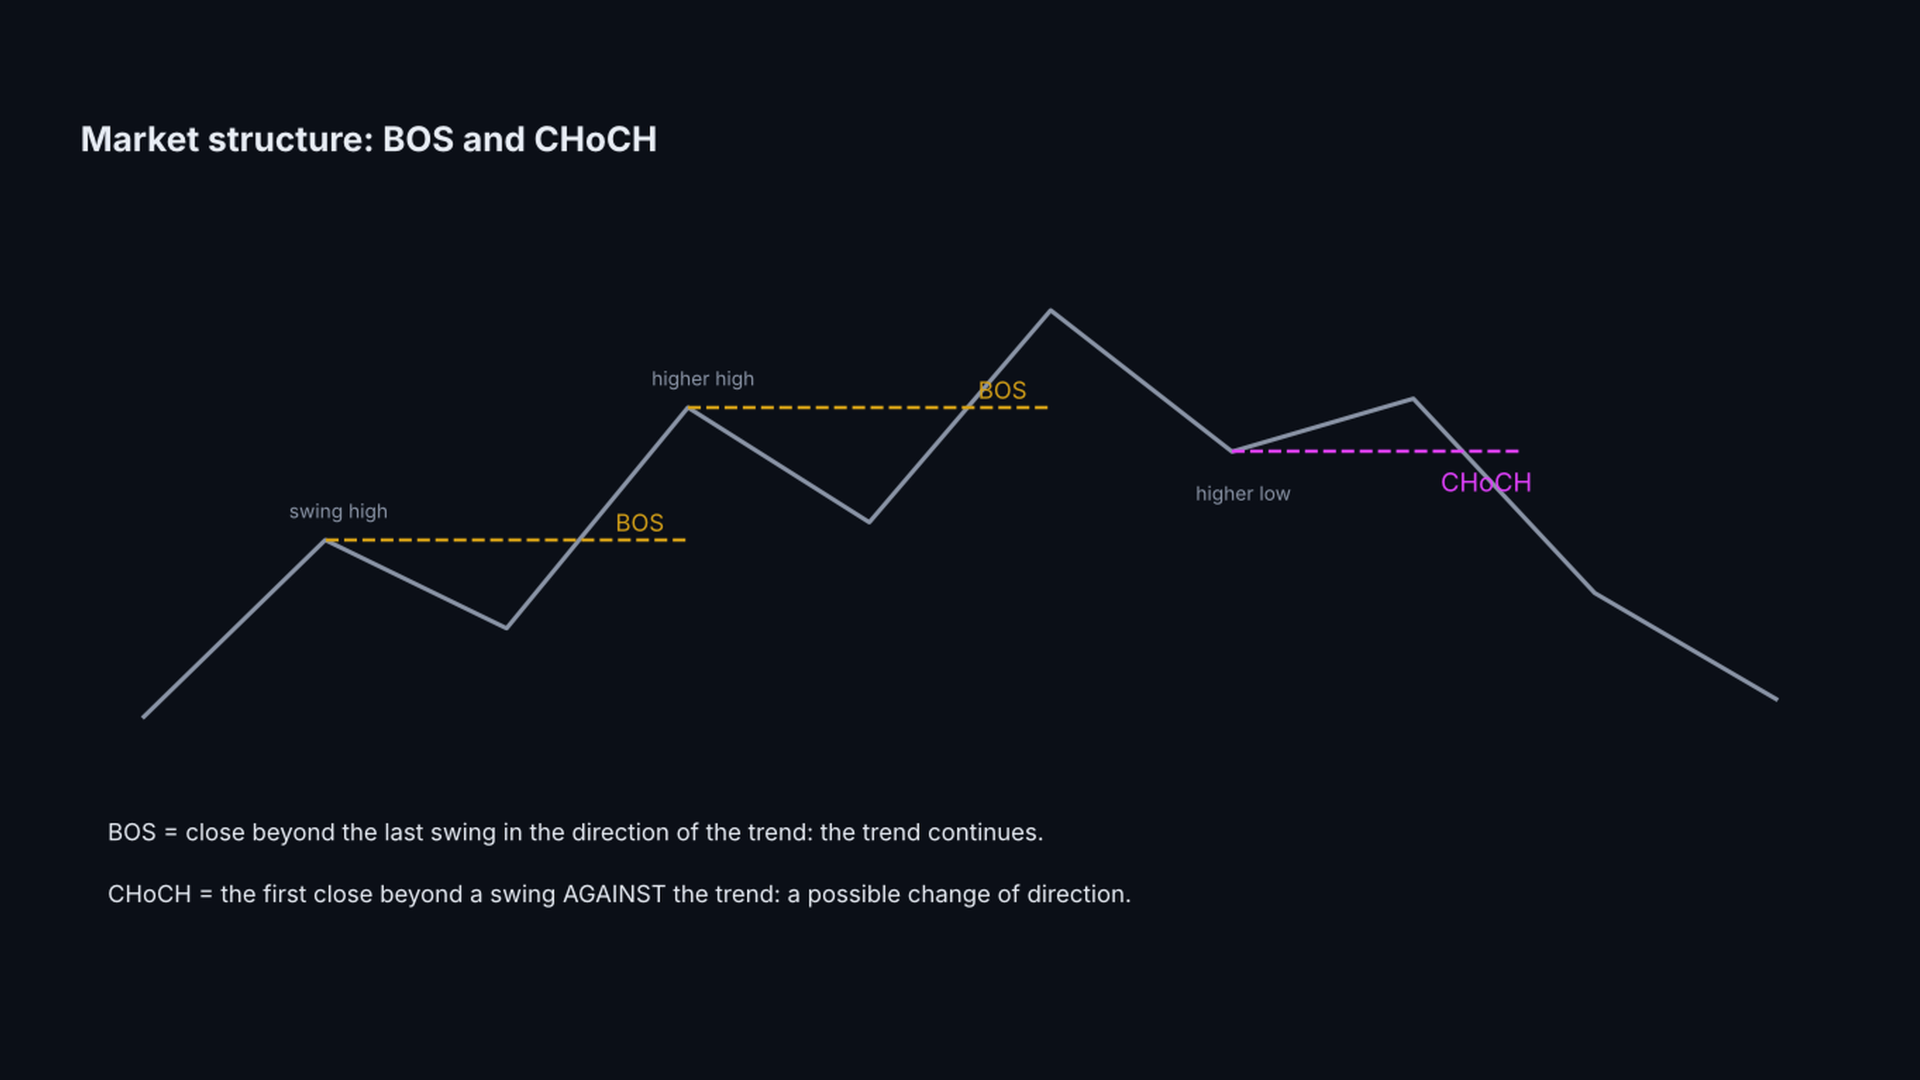
- Market structure: break of structure (BOS) and change of character (CHoCH) lines.
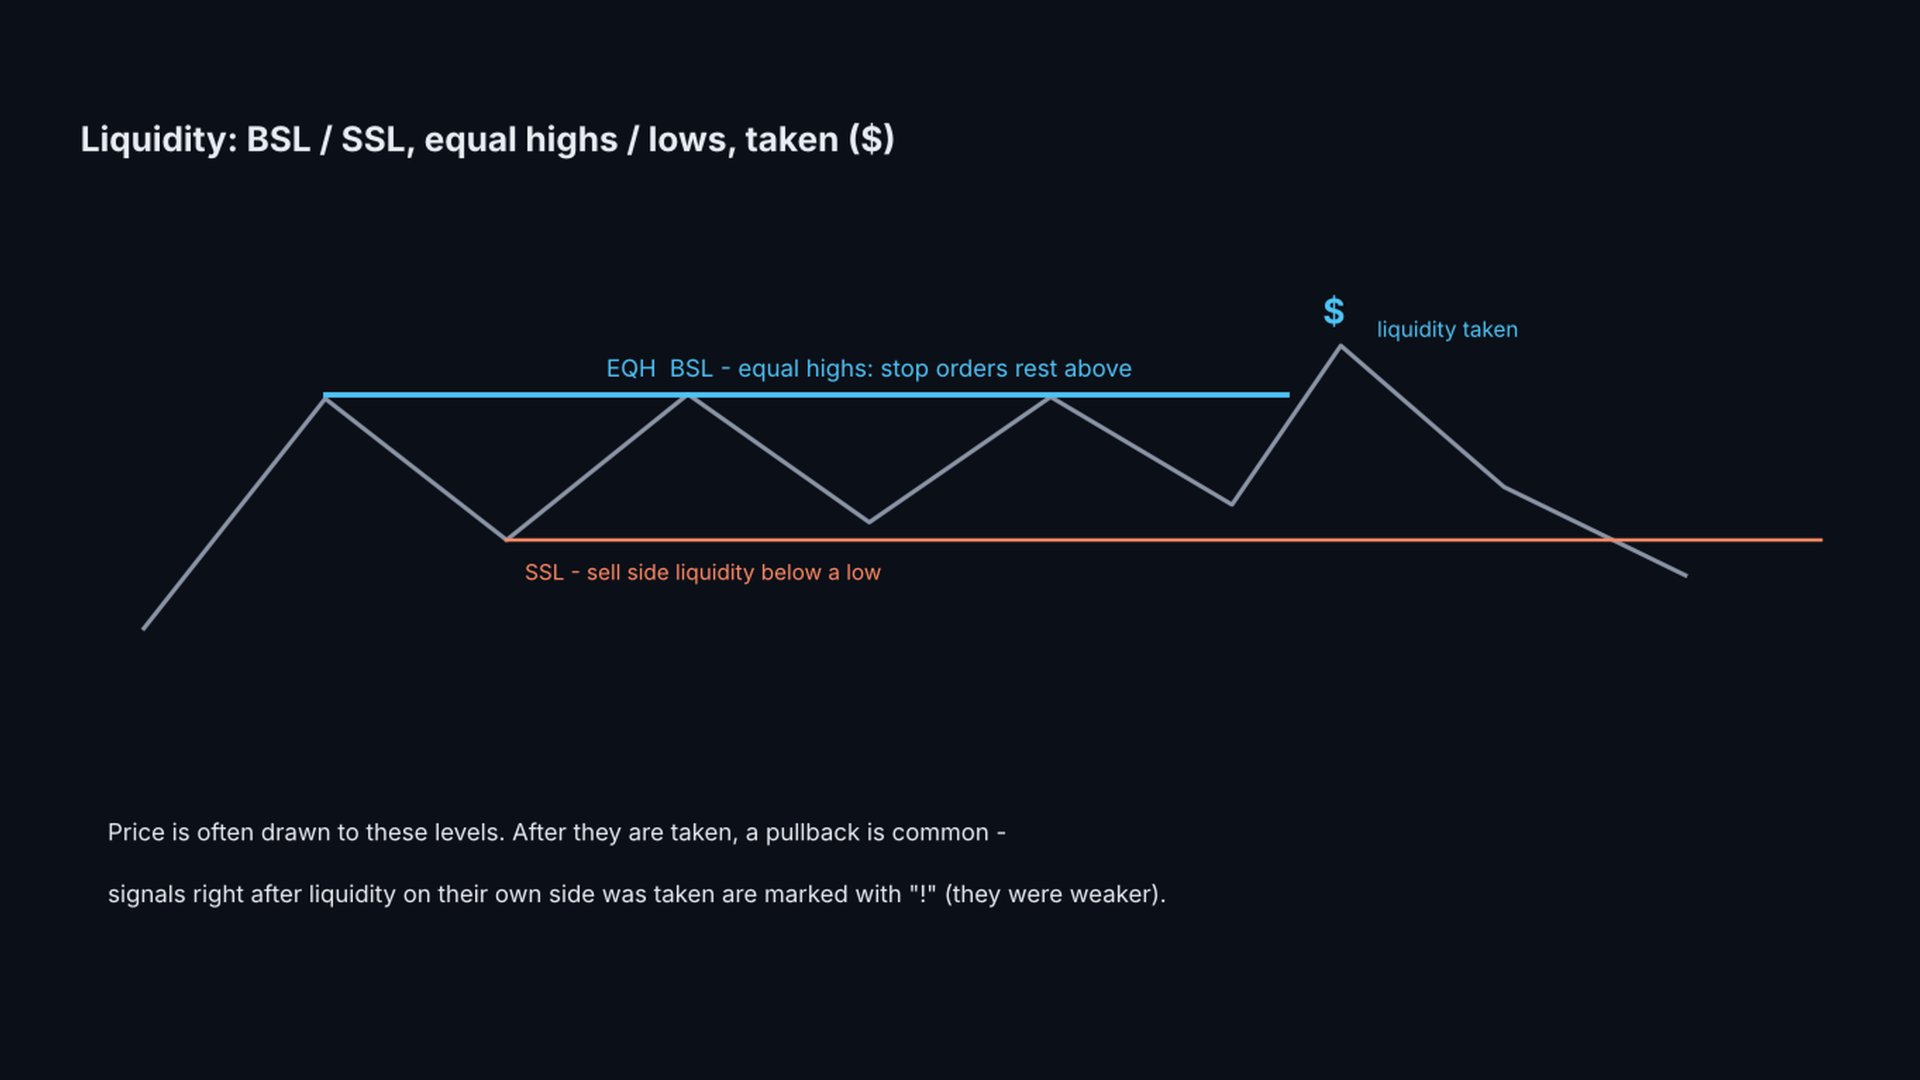
- Liquidity: resting buy side / sell side liquidity (BSL / SSL), equal highs / lows (EQH / EQL) and where liquidity was taken ($).
- Caution mark "!" on signals that come right after liquidity on the same side was taken.
- Hover the mouse over any zone, arrow, line or label: a tooltip explains what it is, with the prices and the SL.
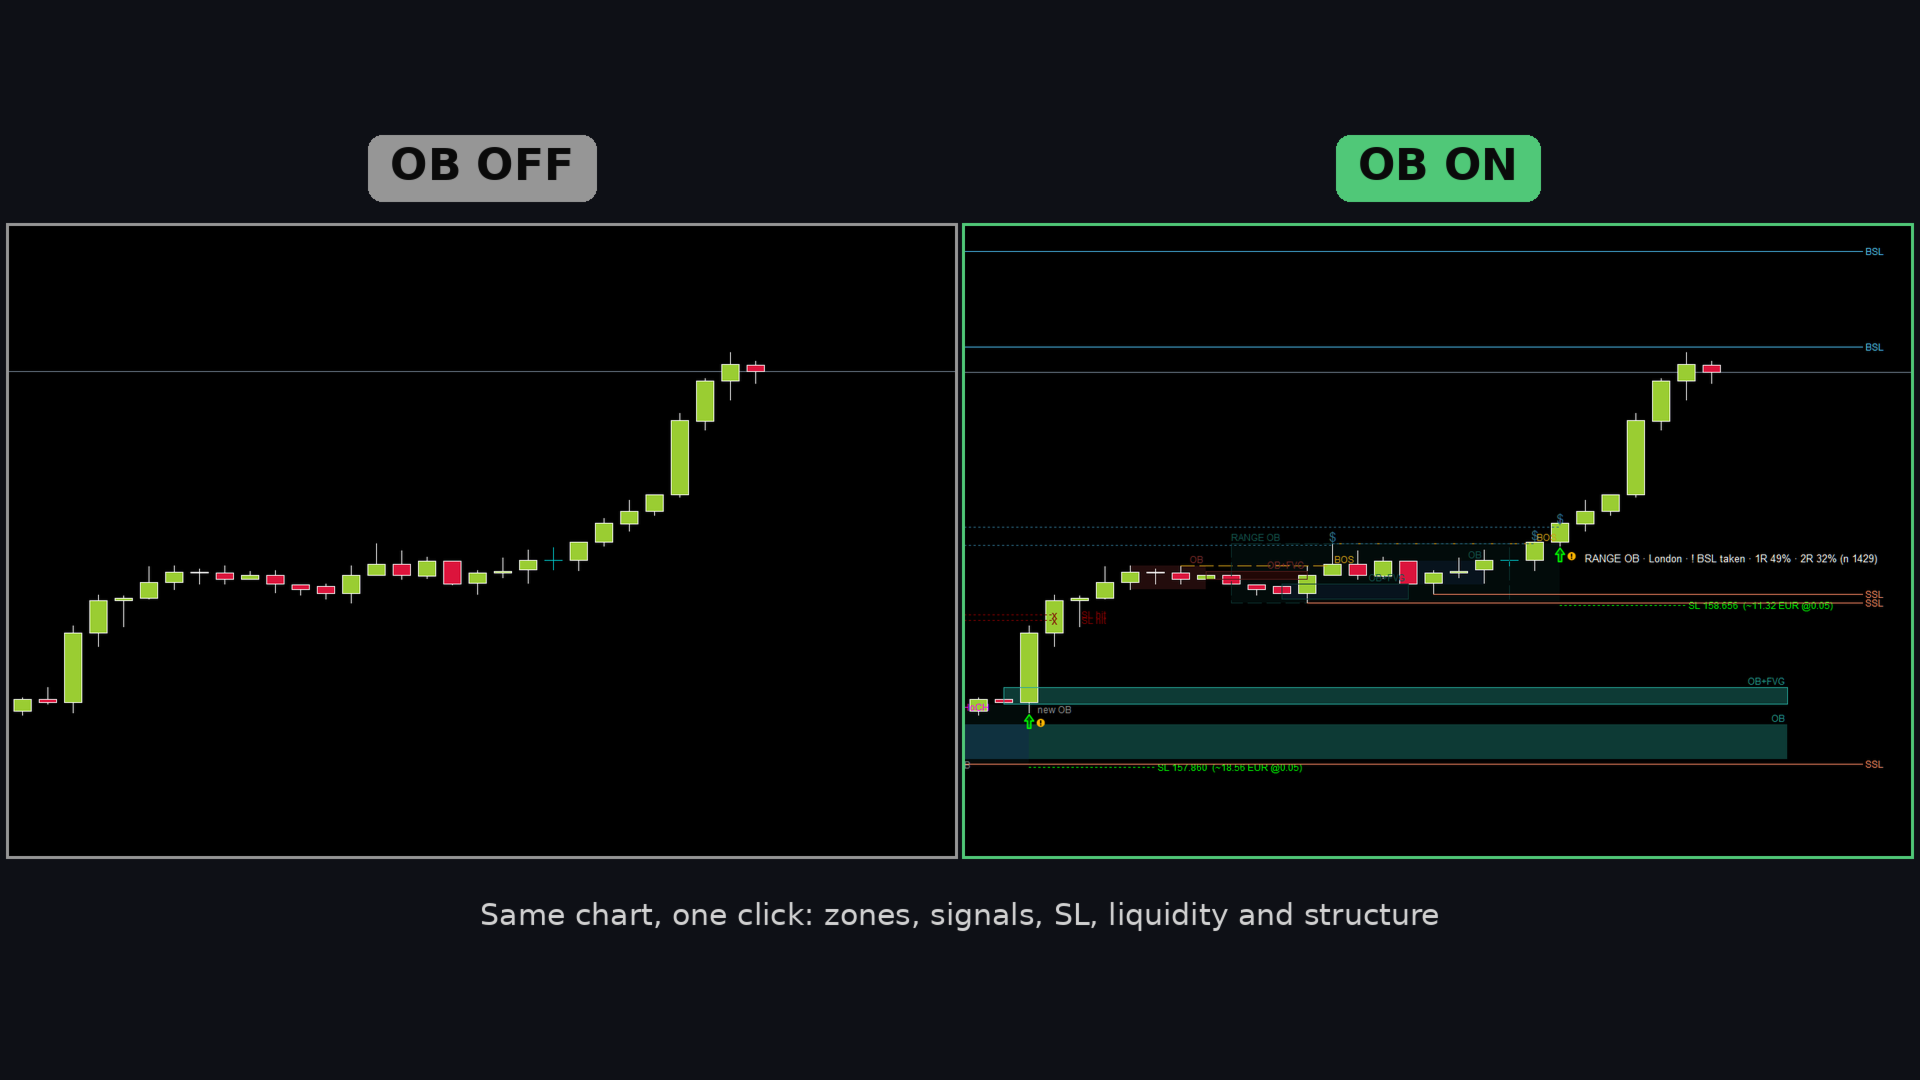
- "OB ON / OB OFF" button to hide everything with one click. Popup and push alerts.
- Works on any symbol and timeframe. Light and dark charts (colors adjust automatically).
USER GUIDE
1. QUICK START
1) Attach Smart Order Blocks to a chart. The default settings work on any symbol.
2) Wait a few seconds on the first load: the probability statistics are calculated on up to 50 000 bars (StatsBars).
3) Hover the mouse over anything that is drawn to read what it is.
4) For push notifications: Tools > Options > Notifications in MetaTrader 5, enter your MetaQuotes ID and enable push notifications.
2. THE ZONES
- Bullish OB (green): the last bearish candle before a move up. Bearish OB (red): the last bullish candle before a move down.
- An OB is shown only when the move is confirmed: the 2 candles after it move in the same direction and the 3rd candle has closed.
- OB+FVG (with a frame): the move left a fair value gap (a gap between candle 1 and candle 3).
- RANGE OB (very light box with a dashed frame): a consolidation of RangeBars bars not higher than RangeMaxATR x ATR, then a close beyond it.
- States: untouched (normal color), used = already touched (faded), broken = price closed through it ("broken").
- An untouched zone expires after ZoneMaxBars bars.
- "new OB" marks the candle that confirmed a zone.
3. THE SIGNALS
- BUY: a closed candle touched an untouched bullish zone and closed back above it. SELL: the mirror case.
- The arrow is final after the close. The label shows the zone type, the session and the probability, for example:
"RANGE OB · London · 1R 55% · 2R 37% (n 120)".
- SL line: a short dotted line behind the zone (+ SLBufferATR x ATR) with the risk in money, for example "SL 152.569 (~11.40 USD @0.01 lot)". If the SL is hit later, the line is faded, runs to the candle that hit it and shows "x SL hit".
- SLMode: behind the whole zone (default), behind the middle of the zone, or behind the zone but max SLMaxATR x ATR from its edge. In our tests the stop behind the whole zone was the best on every timeframe; smaller stops were hit more often and were weaker in R.
- Hollow arrow = possible signal on the open candle. About 1 in 3 becomes a signal. Useful on lower timeframes to look at the chart before the close.
- SkipInsideRange: no OB signal while the signal candle is still inside a consolidation.
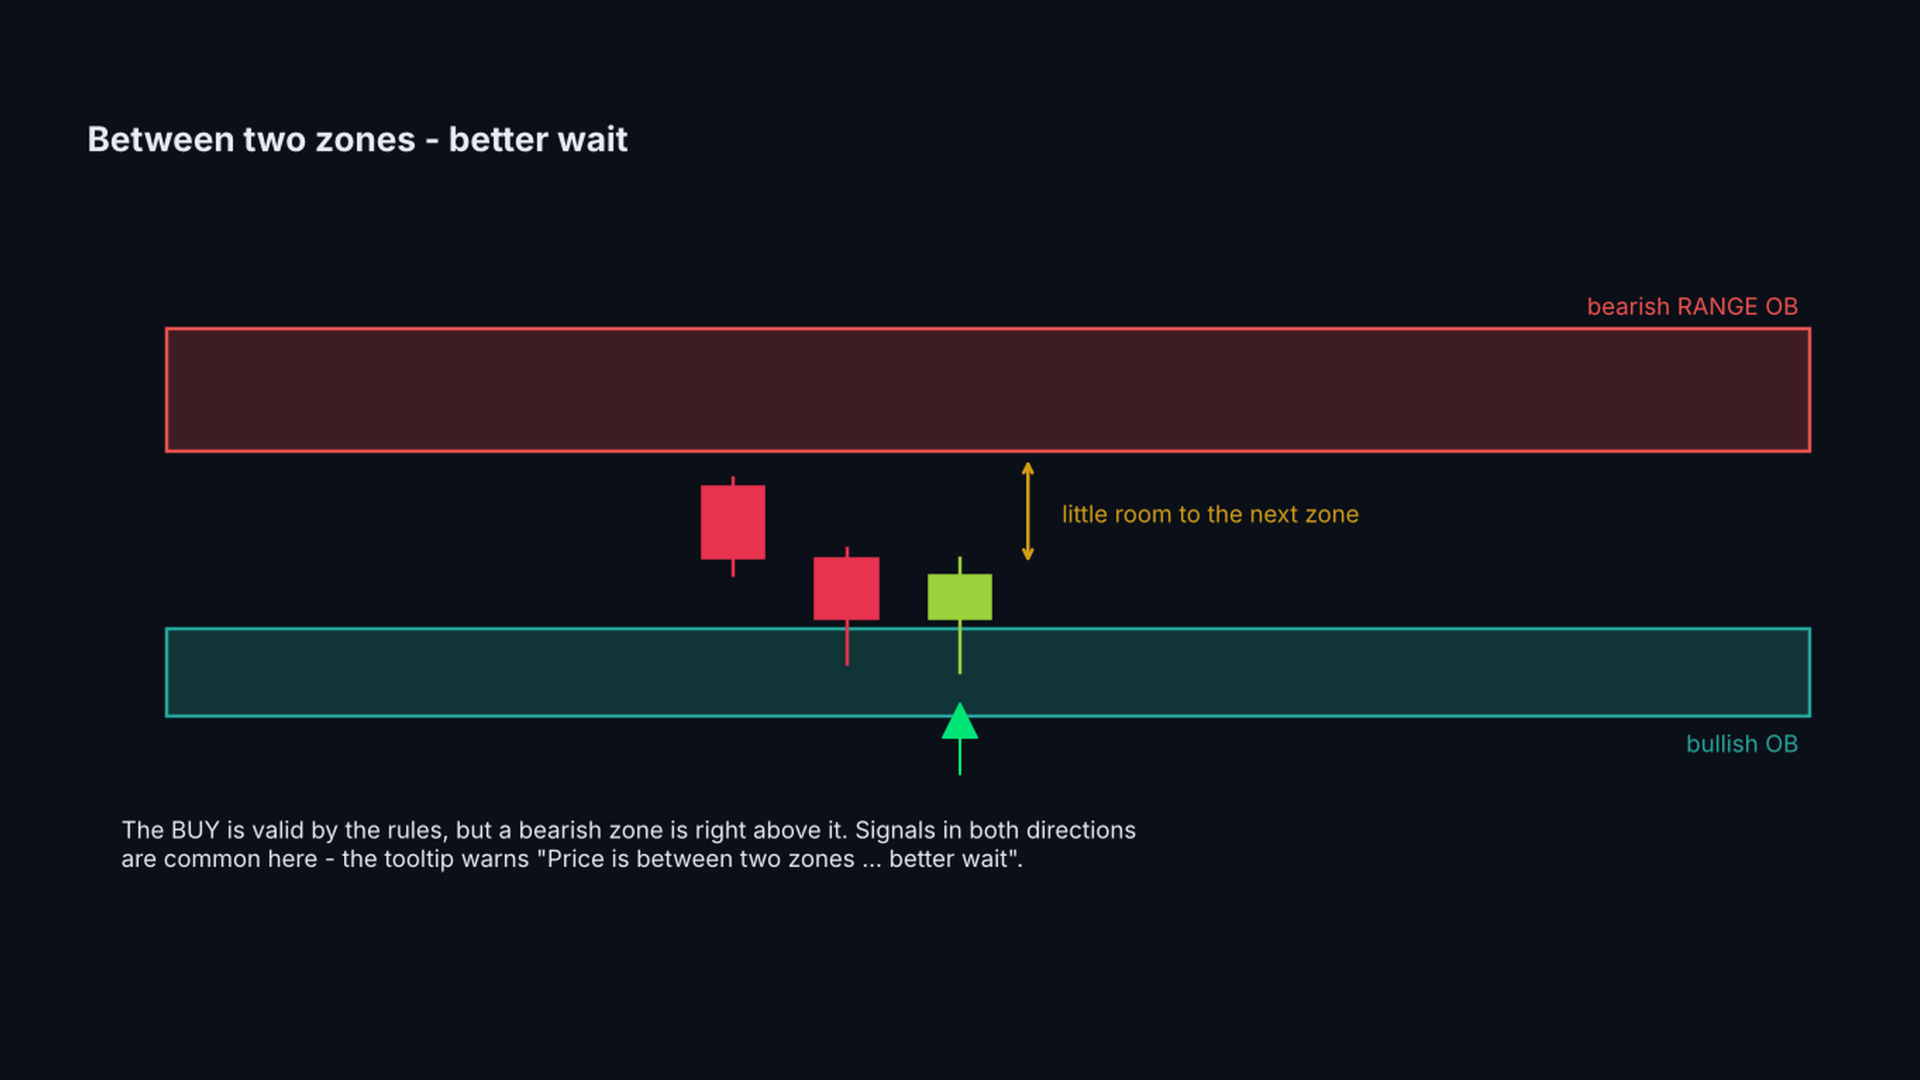
- The tooltip of every arrow names the zone it comes from (for example "BULLISH OB 4010.30 - 4025.10"). If a zone in the opposite direction is right in front of the signal, the tooltip says "Price is between two zones ... better wait". This happens often: a buy from a green zone just under a red zone is a valid signal by the rules, but the price has little room.
- The tooltip of every arrow says whether the signal is with or AGAINST the market structure (last BOS / CHoCH). Signals against the structure were not worse on average in our tests, so they are shown by default; HideAgainstStructure hides them if you prefer.
- Waiting for a confirmation on a lower timeframe (for example a BOS on M5 after an H1 signal) did not help in our tests: the confirmed signals were the good ones, but by the time of the confirmation the price had already moved and the later entry gave the advantage back.
4. THE PROBABILITY - WHAT IT MEANS
- For every closed past case of the same type (OB, OB+FVG, RANGE OB, with or without rejection, after liquidity taken) the indicator checks what came first: 1R / 2R or the SL.
- 1R = the SL distance, 2R = twice the SL distance. n = number of past cases. With fewer than MinCases cases it shows "not enough data".
- It is calculated walk-forward: each case uses only what was known at that time. It is a description of the past on this symbol and timeframe, not a prediction.
- Use it to compare: which zone types and timeframes have worked better on the symbol you trade.
5. FVG, STRUCTURE AND LIQUIDITY - THE CONTEXT
These show what just happened on the chart. In our tests they did not make the signals better on their own, so use them as context, not as filters:
- FVG: a gap between candle 1 and candle 3 of a strong move. An OB with an FVG is drawn with a frame (OB+FVG).
- BOS: a close beyond the last swing high / low in the direction of the structure - the trend continues.
- CHoCH: the first close beyond a swing against the previous structure - a possible trend change.
- BSL / SSL: untaken swing highs / lows where stop orders rest. EQH / EQL = equal highs / lows (thicker line).
- Taken liquidity: a dotted faded line and "$" where price went beyond the level.
- "!" next to an arrow: liquidity on the same side was taken on the signal candle or the candles before it (LiqCautionBars). In our tests these signals were weaker.
6. A PRACTICAL WAY TO USE IT
This is a tool for manual trading, not a system that takes every arrow. What we found when we developed it (XAUUSD, H1 2020-2026, M5 / M15 2025-2026, costs included):
- Order block zones are real levels: price reacted from them clearly more often than from random candles, in every year we tested. Use them for where to look, where to put the stop and where to take profit.
- Waiting for the rejection close was better than entering at the first touch.
- RANGE OB on H1 was the strongest signal type. Many traders use H1 for the zones and the direction and a lower timeframe (M5 / M15) for the entry.
- All signals together are only about breakeven after costs. Taking every arrow is not a strategy.
- When signals come in both directions within a few candles, price is between two zones: better wait.
- Signals with "!" (right after liquidity on the same side was taken) were weaker.
Past results do not guarantee future results. Check the probability on your own symbol and timeframe, and test on a demo account first.
7. RISK
- The SL is behind the zone: typically about 1.3 ATR for an OB and about 3 ATR for a RANGE OB. On D1 / H4 this is a large distance in price, but it is normal for the timeframe - an H1 stop is many times smaller in price.
- Size the position from the SL distance, not from a fixed lot: the tooltip and the SL label show the distance in price, in ATR and in money for MoneyLot (0.01 by default). Keep the money at risk the same on every timeframe.
- Two or three losses in a row are normal with any setup that wins about half of the time.
8. RISK : REWARD - THE MATH
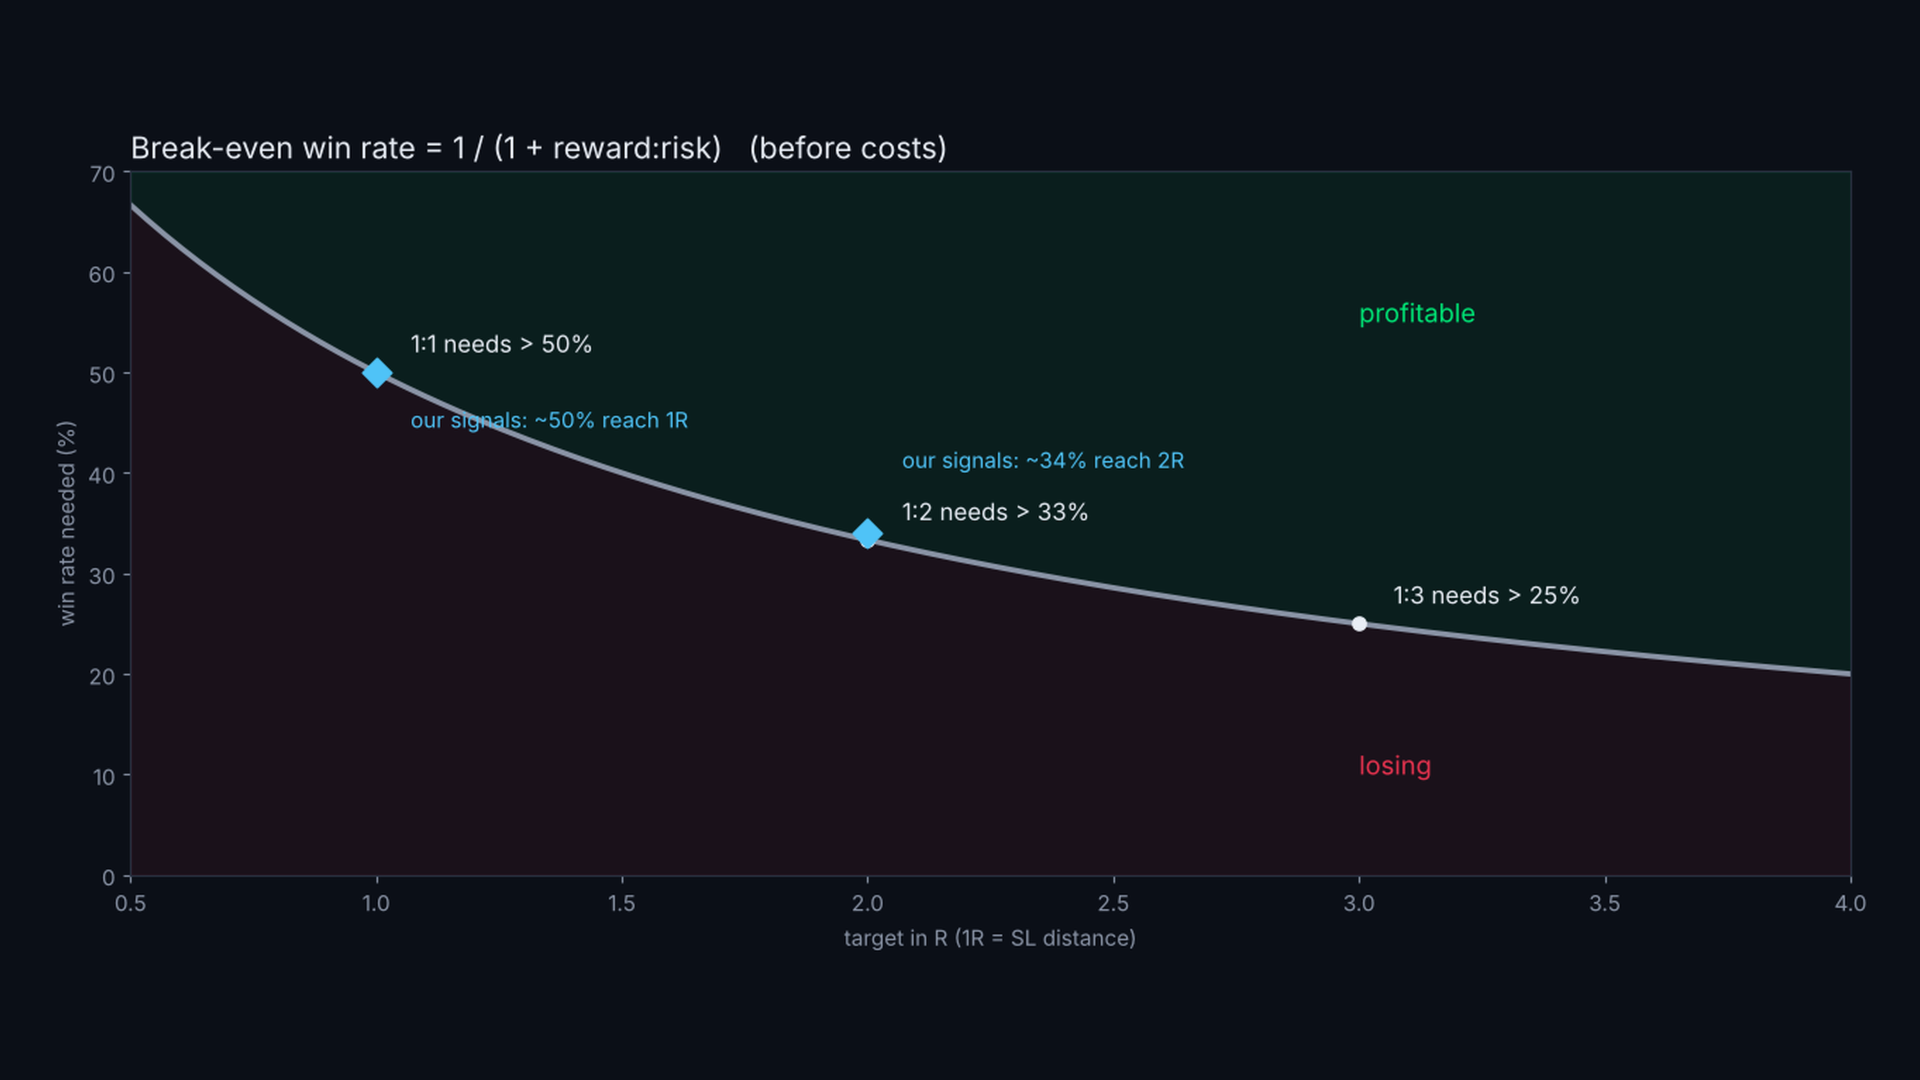
With a fixed target, a setup is profitable only if it wins more often than this (before costs):
- 1:1 (target = 1 x SL distance): more than 50% of the trades
- 1:2: more than 33%
- 1:3: more than 25%
The signals of this indicator reached 1R in about 50% and 2R in about 34% of the cases in our tests - that is about breakeven with a 1:1 or 1:2 target once spread and commission are paid. So:
- Do not use small targets. Aim for at least 1:2, better 1:3, and let the trade reach the next zone or liquidity level.
- In our tests the best results came from RANGE OB on H1 (positive at 1:2 and 1:3) and from the higher timeframes (D1). Plain OB signals on M5 were negative at every target.
- The probability in the label (1R % / 2R %) tells you which targets made sense on your symbol and timeframe: if 2R % is clearly above 33%, a 1:2 target has worked there.
9. FAQ
- Does it repaint? No. Zones appear after the confirming candle closes, signals after the rejection candle closes. Only the hollow "possible" arrow on the open candle can disappear.
- Why does the first load take a few seconds? The statistics are calculated on StatsBars bars. Reduce StatsBars for a faster start.
- Why "not enough data"? There are fewer than MinCases past cases of this type on the chart. Load more history or use a lower timeframe.
- The session names (Asia, London, NY) use the server time GMT+2 / GMT+3 that most brokers use.
- Should I close the trade on a CHoCH against it? In our tests this did not help: it cut as many winning trades as losing ones. Use BOS / CHoCH as context.
- What does the button do? It hides / shows everything the indicator draws. Signals, statistics and alerts keep working.
INPUT PARAMETERS
Order blocks
- ShowZones, FVGMinATR (min gap size for OB+FVG), ZoneMaxBars (expiry), MaxZonesShown, UsedZonesShown, zone colors and transparency, FrameWidth, ZoneLabels, ShowNewOBMark.
Range order blocks
- ShowRangeOB, RangeBars (12), RangeMaxATR (3.0), RangeZonesShown, colors, RangeTransparency, SkipInsideRange, HideAgainstStructure (off: hide signals against the last BOS / CHoCH; in tests this gave fewer signals, not better ones).
Signals
- ShowSignals, SignalsShown (10), BuyColor, SellColor, ArrowSize, ShowSL, SLMode, SLMaxATR (1.5), SLBufferATR (0.1), MoneyLot (0.01), SLLineBars, SLWidth, ShowSignalLabel, LabelsShown, MarkAfterLiquidity, LiqCautionBars, CautionColor, ShowPossible, PossibleColor, PossibleBlink.
Probability
- ShowProbability, MinCases (30), MaxHoldBars (300), ShowPanel (statistics panel), ShowButton, PanelFontSize.
Structure
- ShowBOS, ShowCHoCH, PivotBars (3), colors, style, width, StructShown.
Liquidity
- ShowLiquidity, LiqLevels, EqualTolATR, BSLColor, SSLColor, styles and widths, ShowTaken, TakenShown.
General
- HistoryBars (objects only for the last N bars), StatsBars (statistics on the last N bars), TextColor (None = automatic).
Alerts
- AlertPopup, AlertPush, AlertSignal, AlertPossible, AlertCancel, AlertNewOB, AlertTouch, AlertLiquidity.
IMPORTANT
Smart Order Blocks is an analysis tool. It does not open trades. The probabilities describe the past on your chart; they are not a promise for the future. The decision, the stop and the position size are yours.