Smart Order Blocks

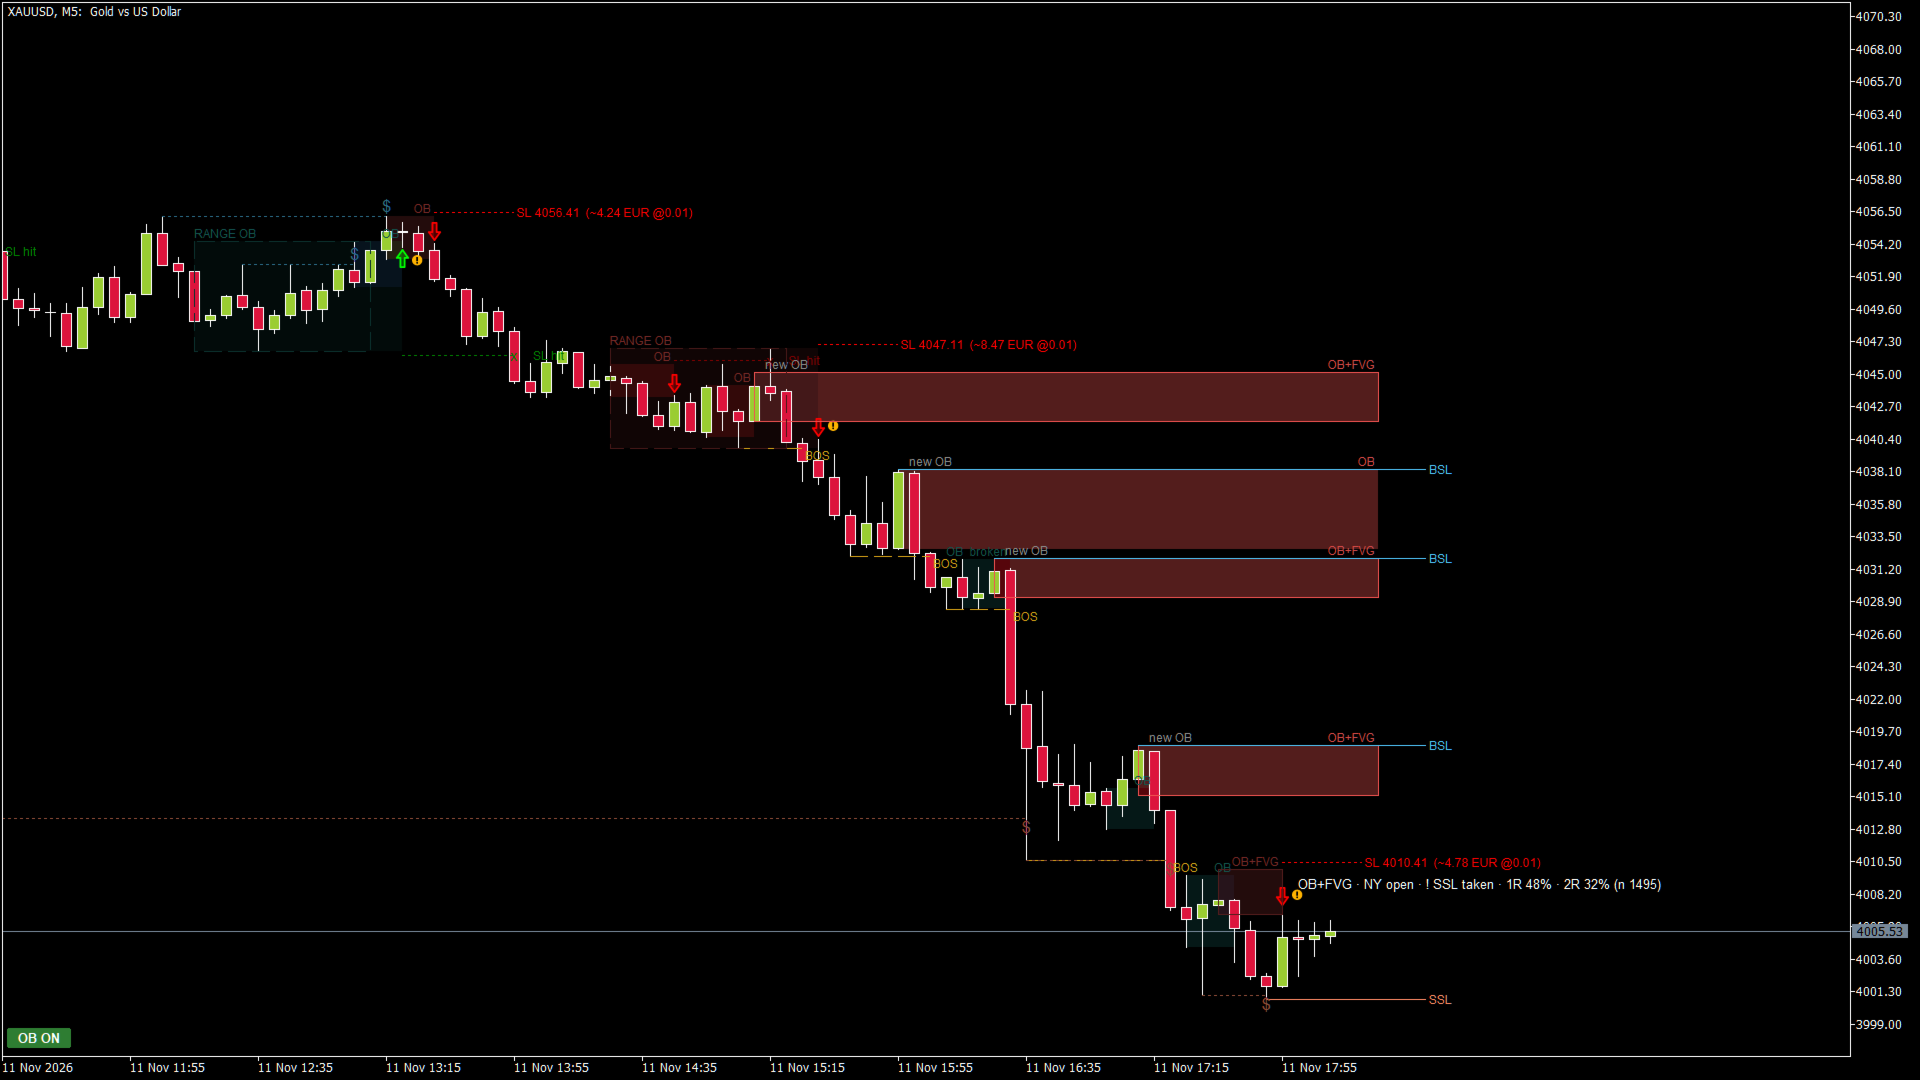
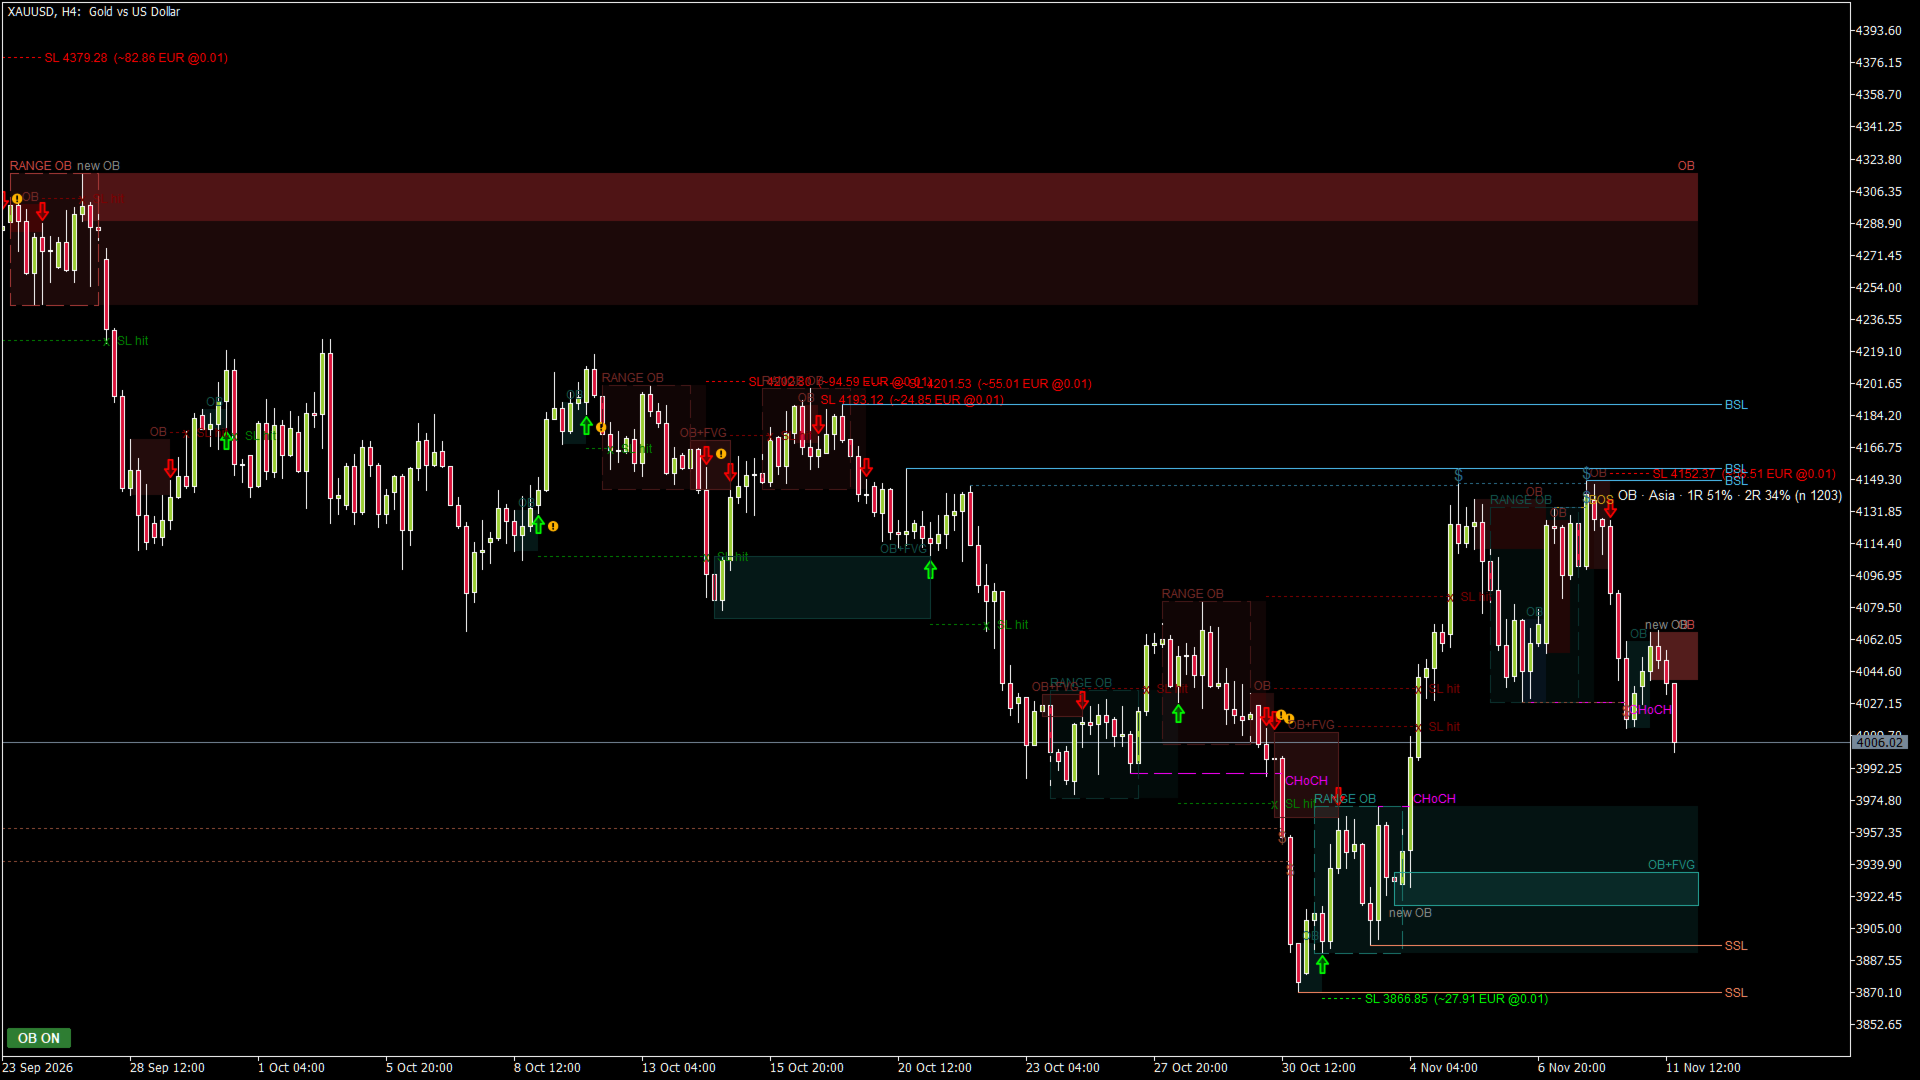
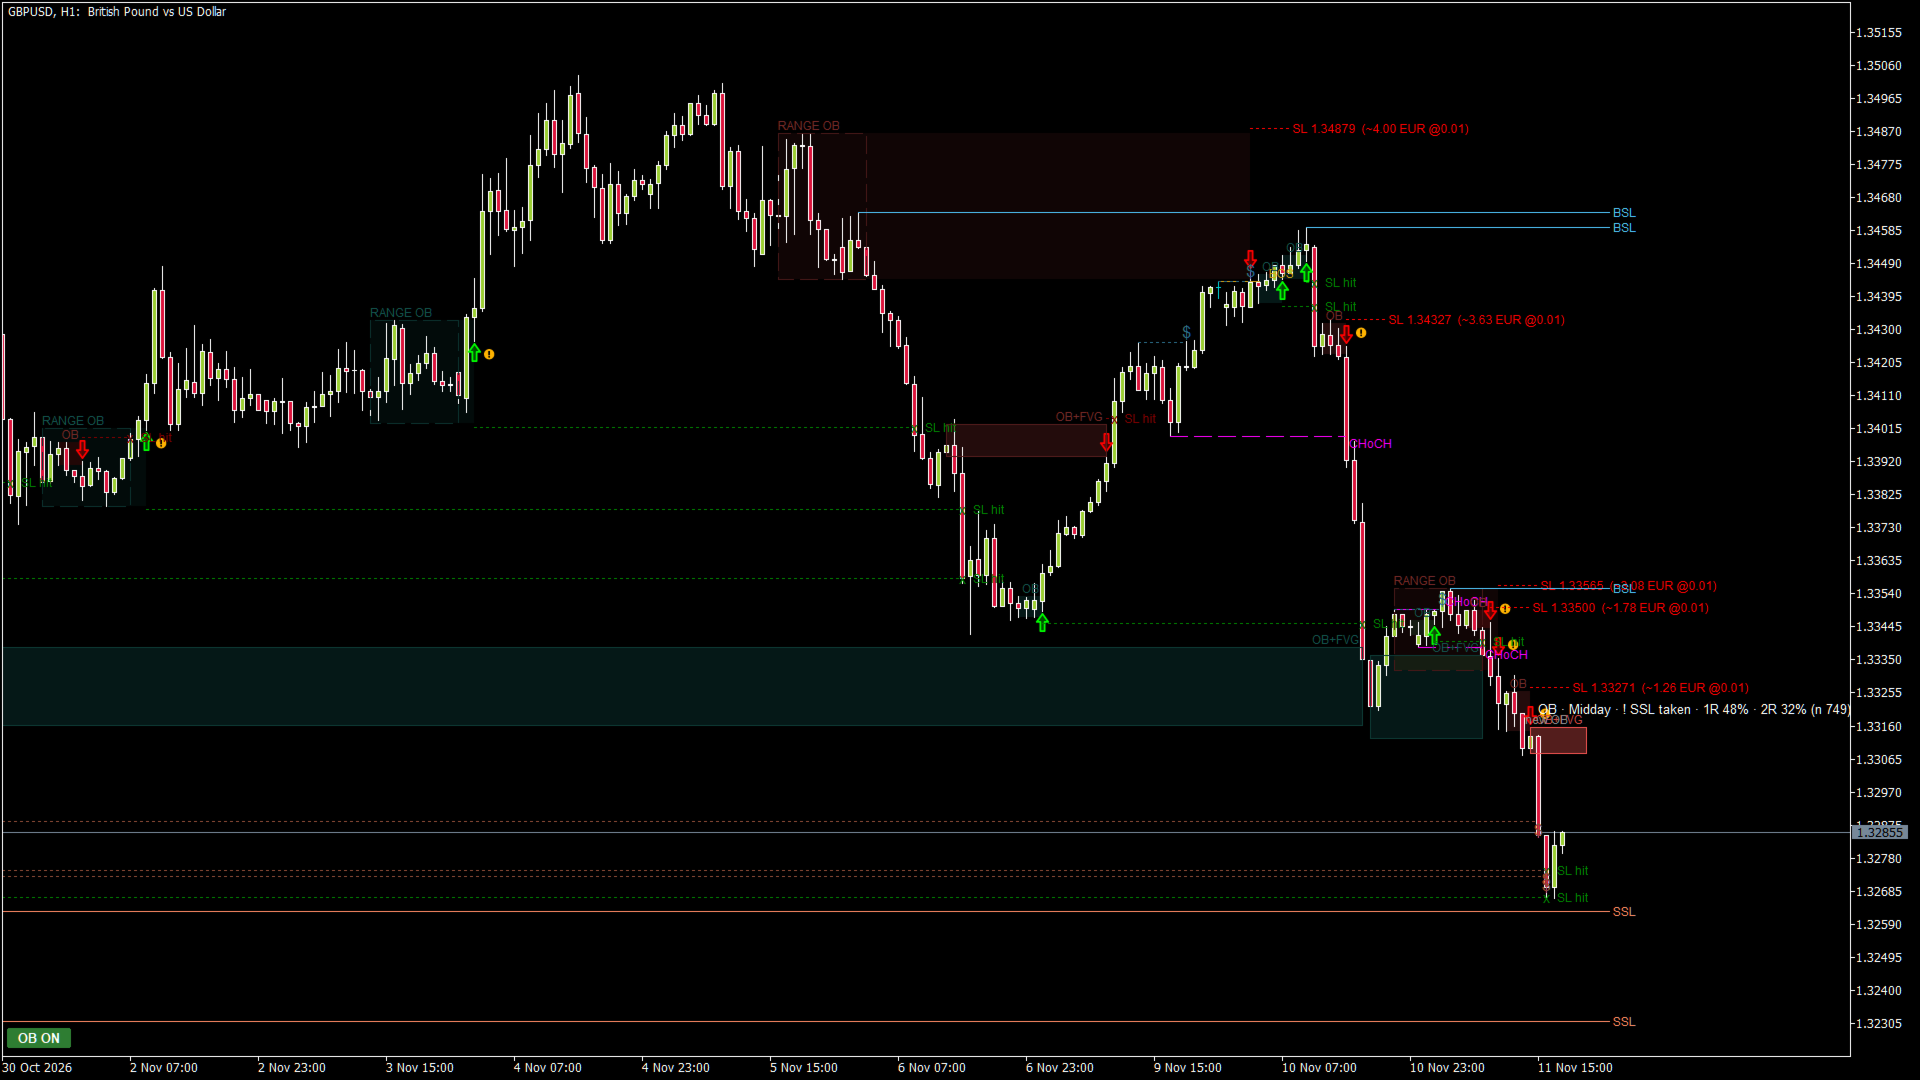
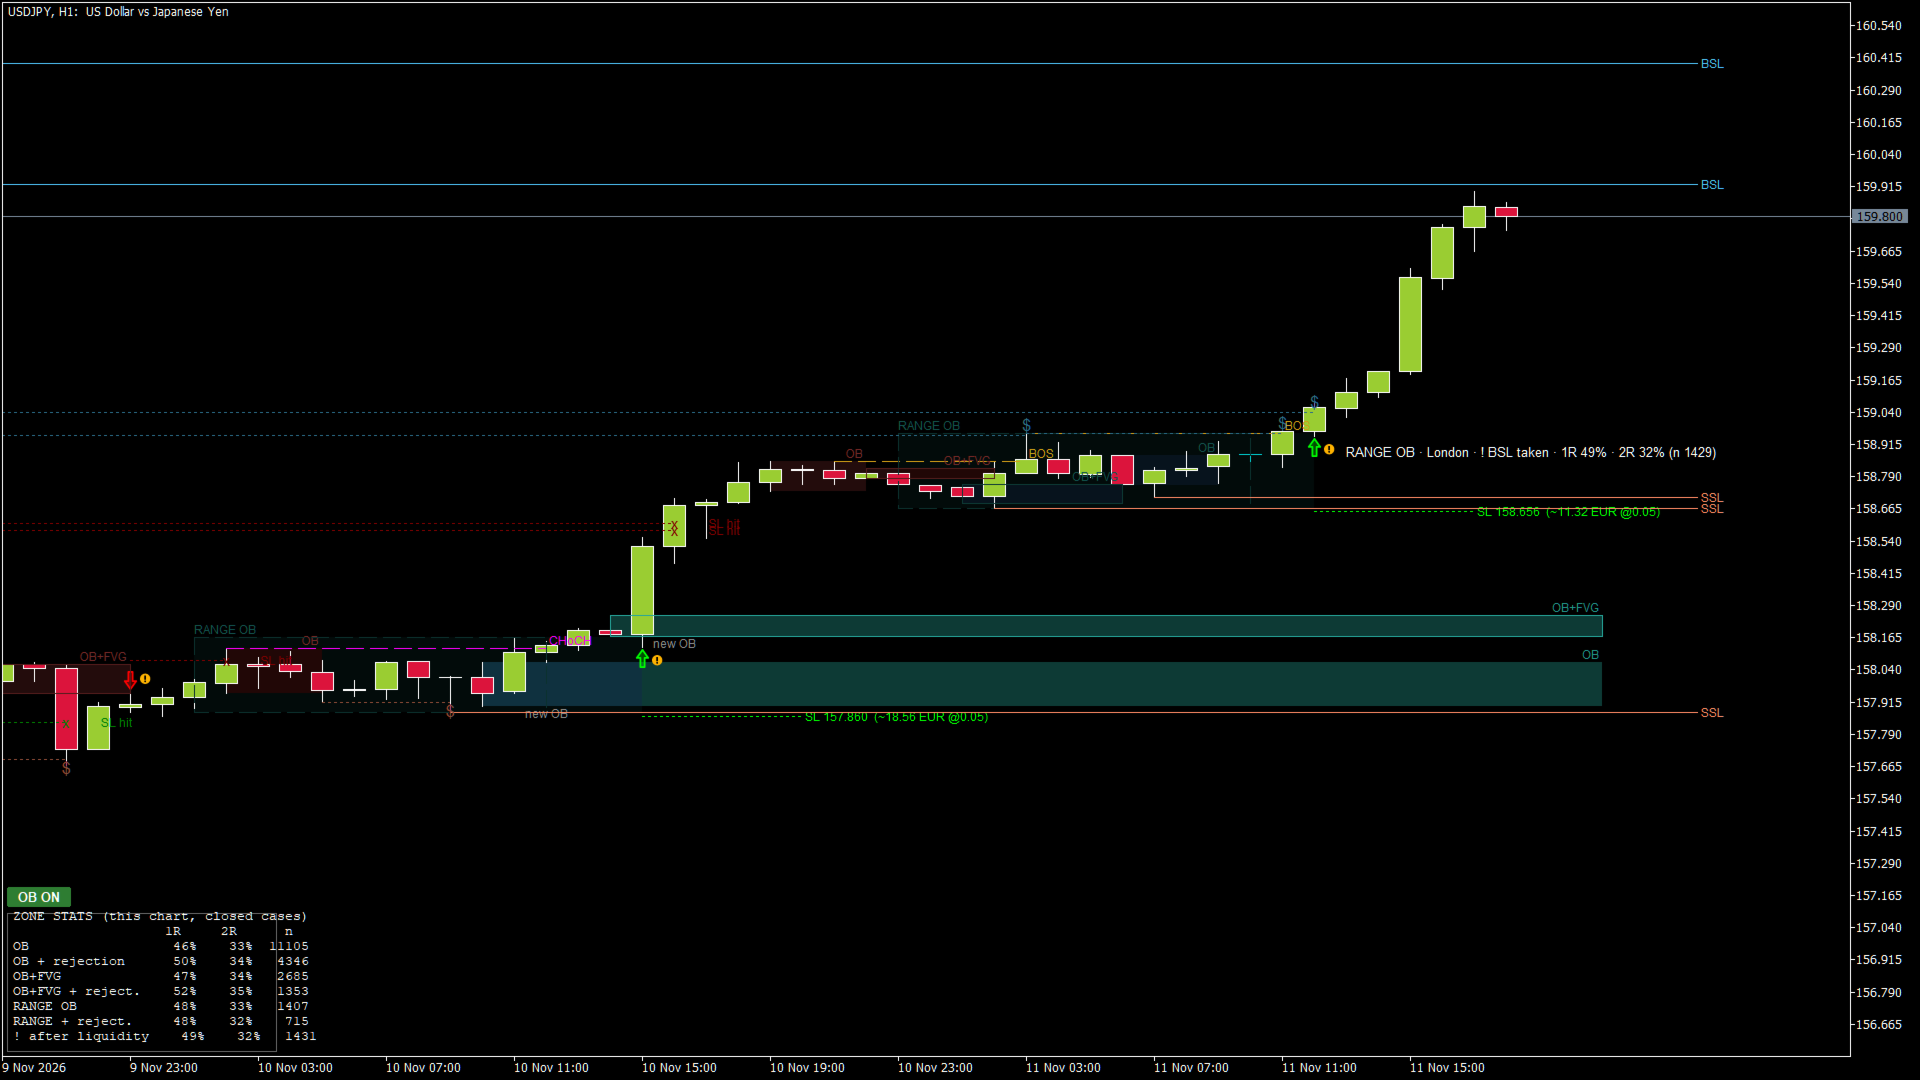
Smart Order Blocks puts the main Smart Money Concepts on one clean chart: order blocks, fair value gaps (FVG), range order blocks, market structure (BOS / CHoCH) and liquidity (BSL / SSL, equal highs / lows, liquidity taken). It gives a signal when price touches a zone and rejects it, and shows how often that type of signal worked in the past ON YOUR CHART.

Nothing is drawn before it happened and nothing repaints: a zone appears only after the candle that confirms it has closed, and a signal only after the rejection candle has closed.

Great for learning Smart Money Concepts: hover the mouse over any zone, arrow or line and a short explanation tells you what it is, why it is there and where the SL would be. You see the concepts on real charts instead of reading about them.

HOW TO USE IT IN 5 STEPS

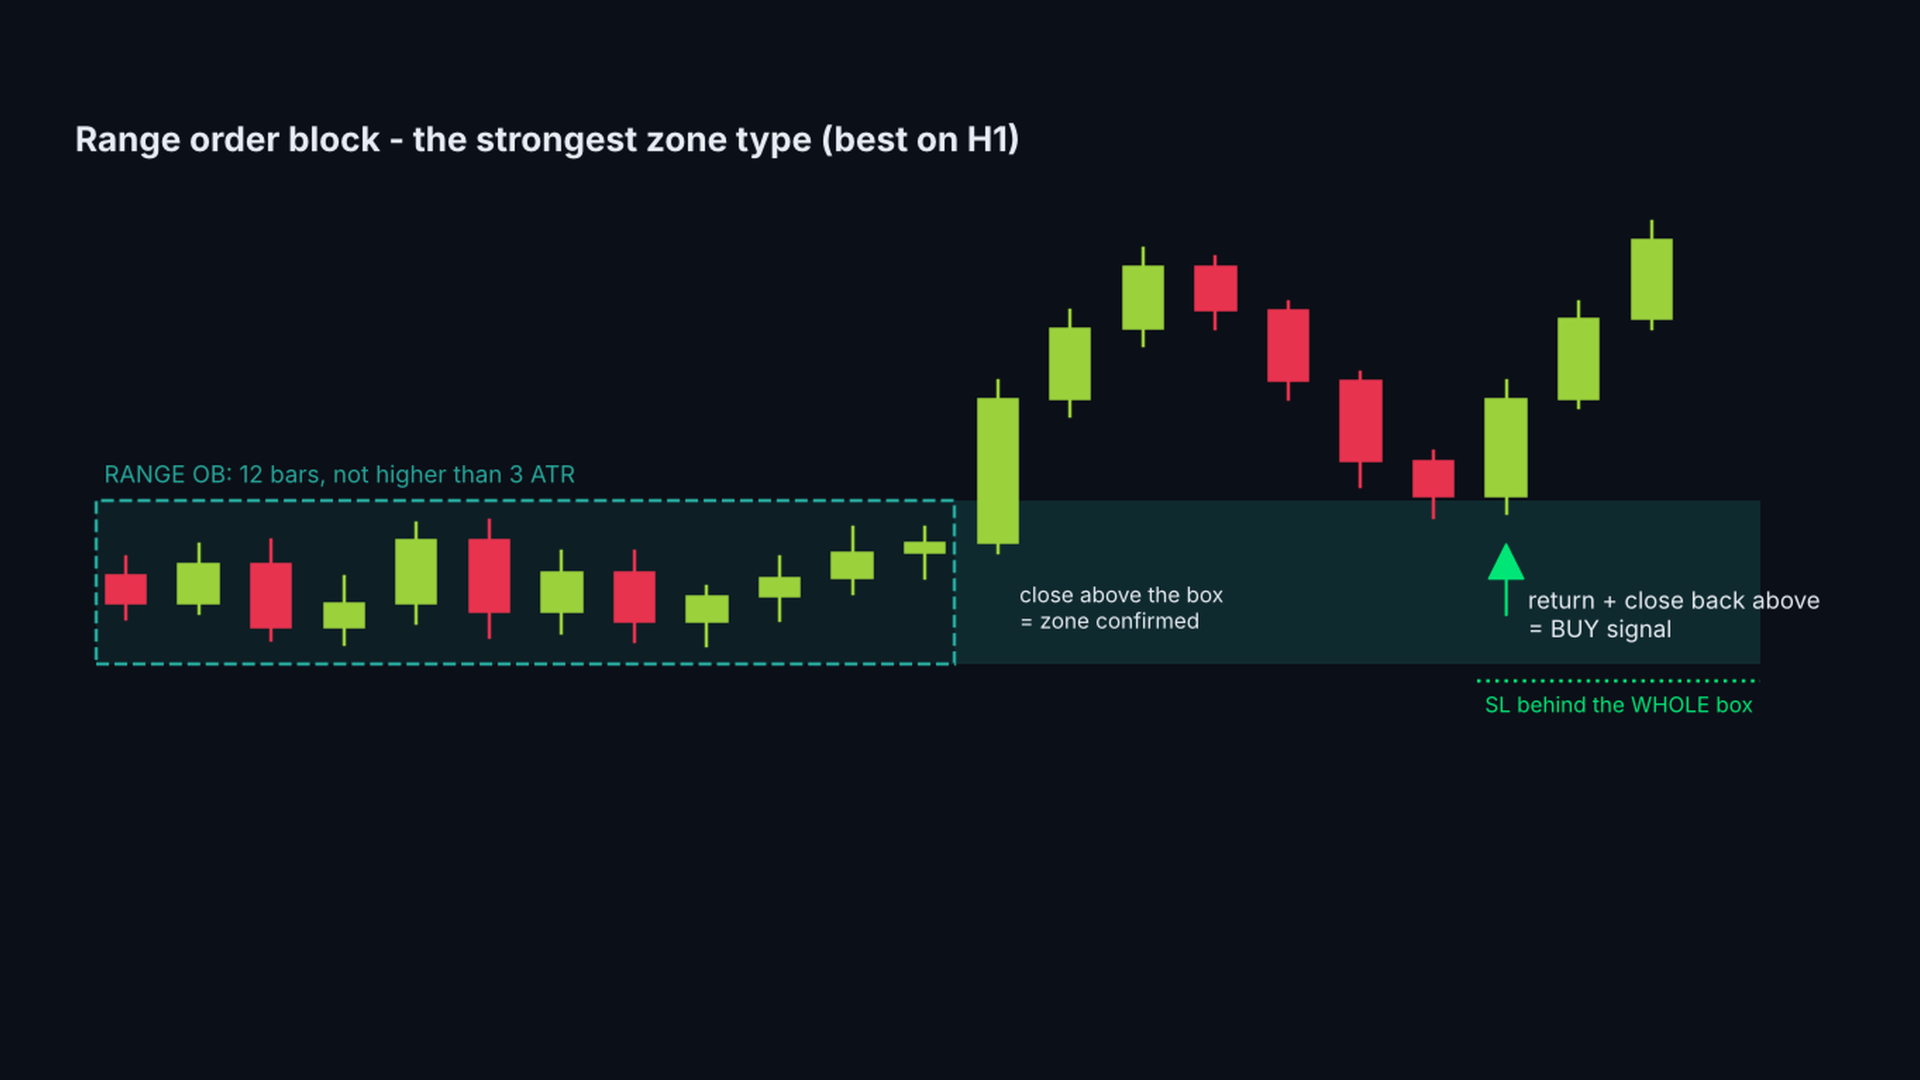
1) Attach it to an H1 chart and look at the zones: green = bullish order blocks (possible support), red = bearish (possible resistance). The light box is a RANGE OB, the strongest zone type.
2) Check the context: BOS / CHoCH show the direction of the structure, BSL / SSL show where stop orders rest above highs and below lows.
3) Wait for an arrow: a candle touched a zone and closed back outside it. The label shows the zone type and how often this type worked on your chart.
4) Use the dotted SL line behind the zone for your stop and size the position from that distance (the label shows the risk in money). Many traders take the entry on M5 / M15 in the direction of the H1 zone.
5) Skip signals marked with "!" and wait when arrows come in both directions within a few candles.

MAIN FEATURES

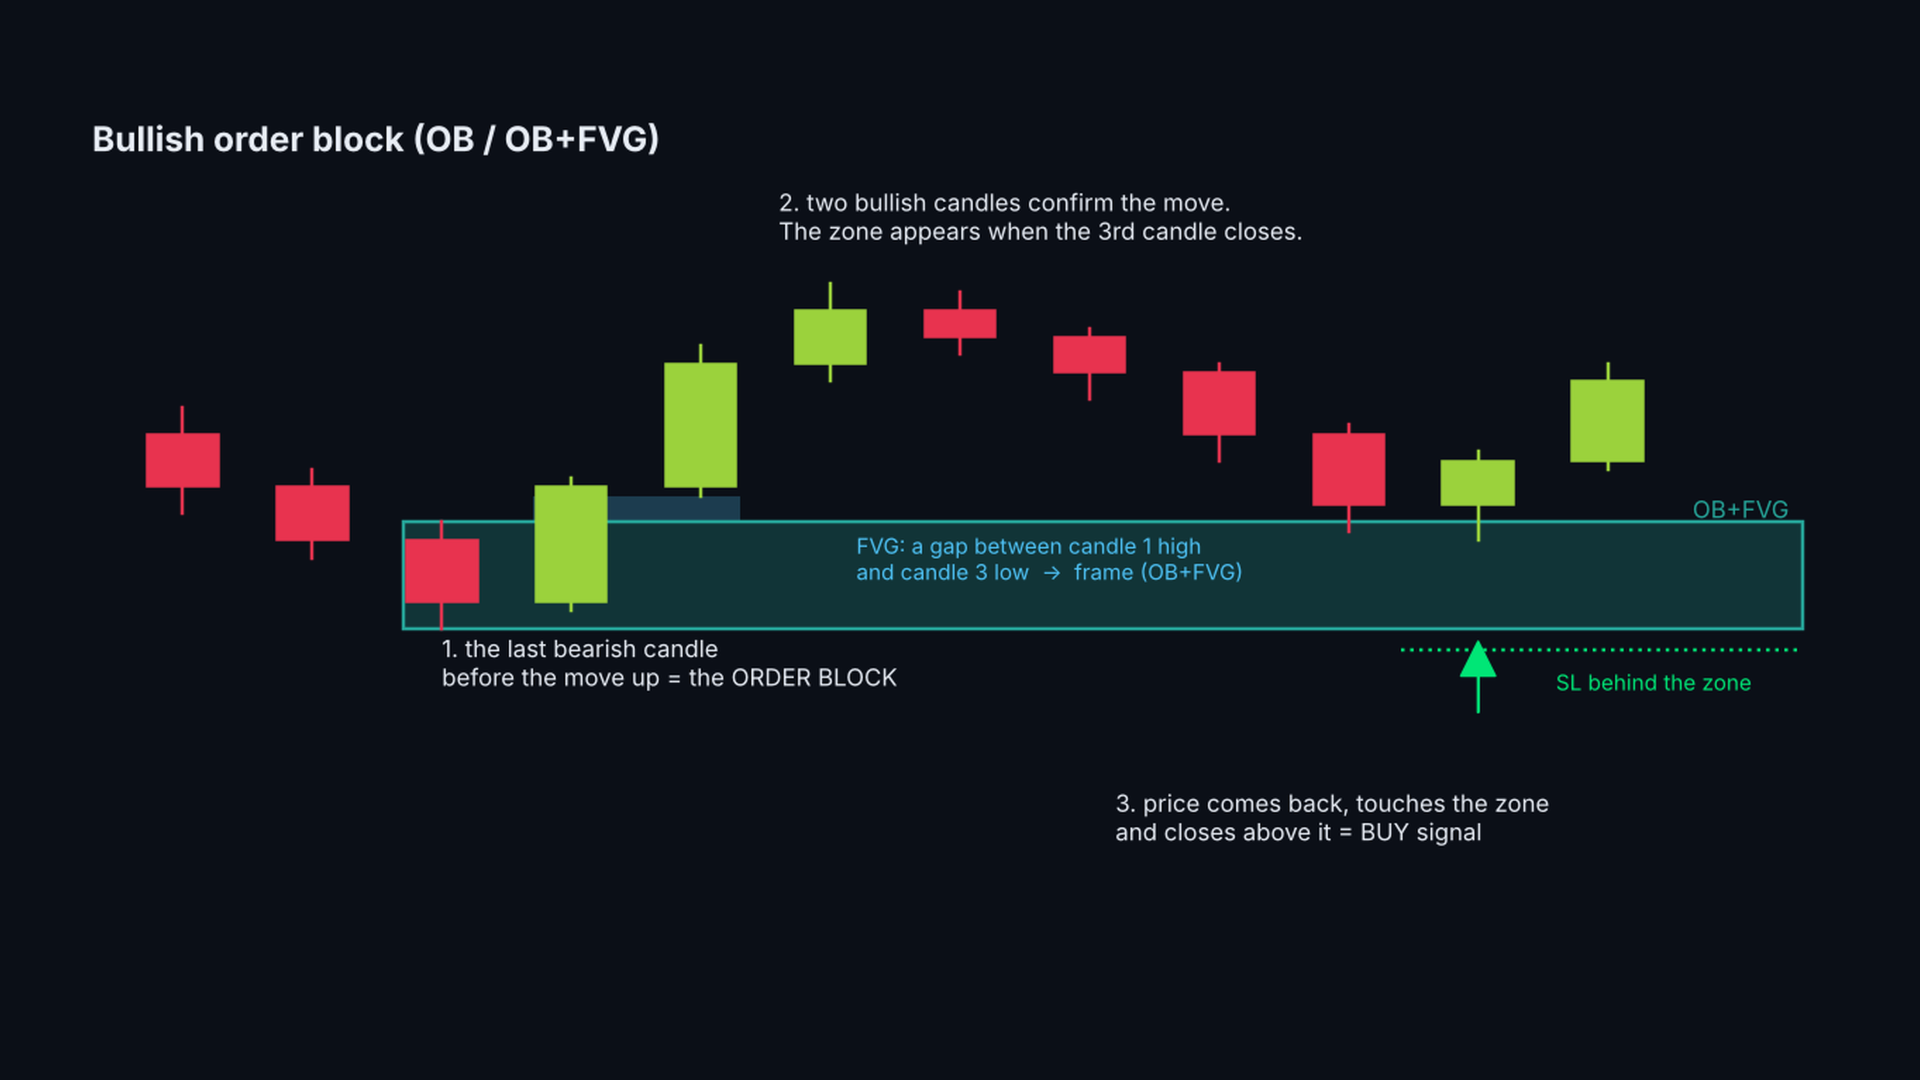
  • Order blocks (OB): the last opposite candle before a move, confirmed when the 3rd candle closes.
  • OB + fair value gap: order blocks whose move left a price gap are marked with a frame.
  • Range order blocks: a consolidation of 12 bars followed by a close beyond it. The whole box is the zone.
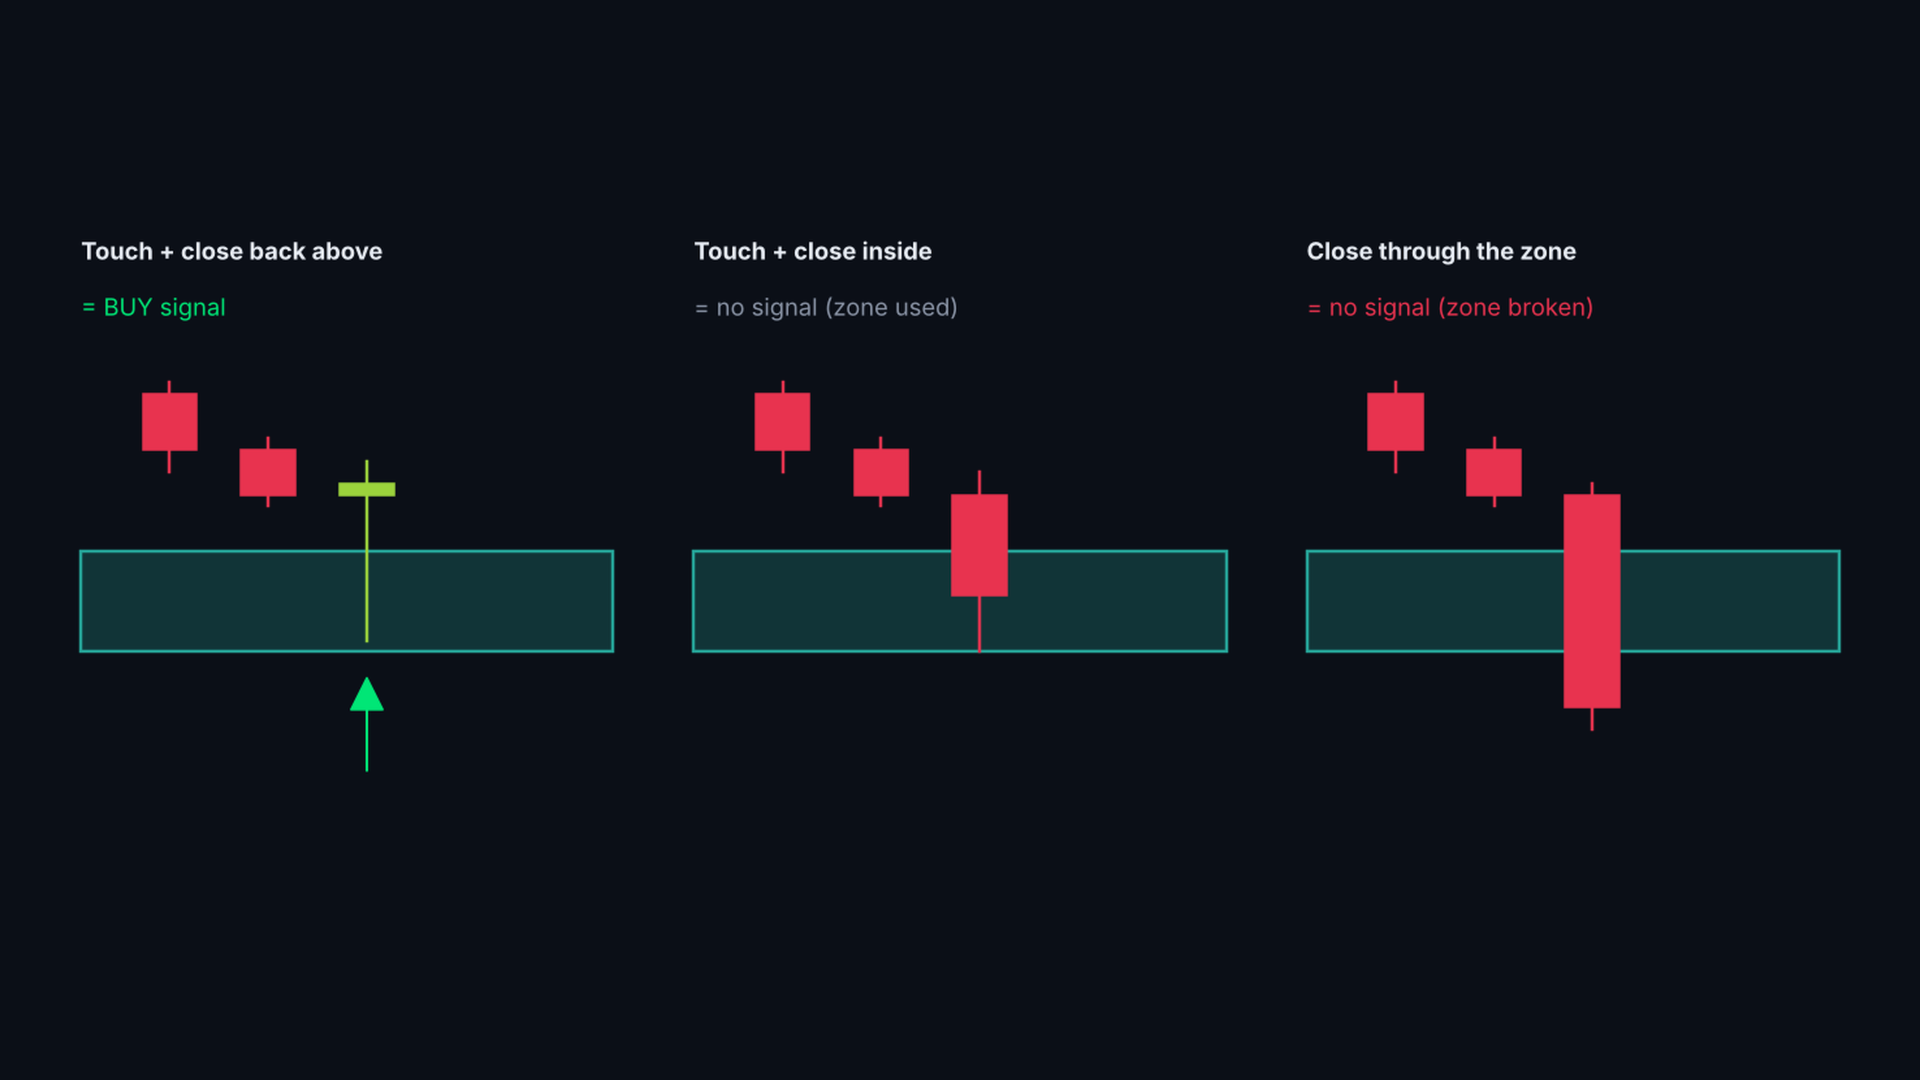
  • Rejection signals: a closed candle that touched an untouched zone and closed back outside it. Arrow + SL line behind the zone.
  • Possible signal: a hollow arrow while the candle is still open and touching a zone. It becomes a signal on the close or disappears.
  • Honest probability: for every signal type the indicator counts how often price reached 1R and 2R before the SL in the past cases on this chart (walk-forward, no look-ahead).
  • Fair value gaps: order blocks whose move left an FVG get a frame (OB+FVG), FVGMinATR sets the minimum gap size.
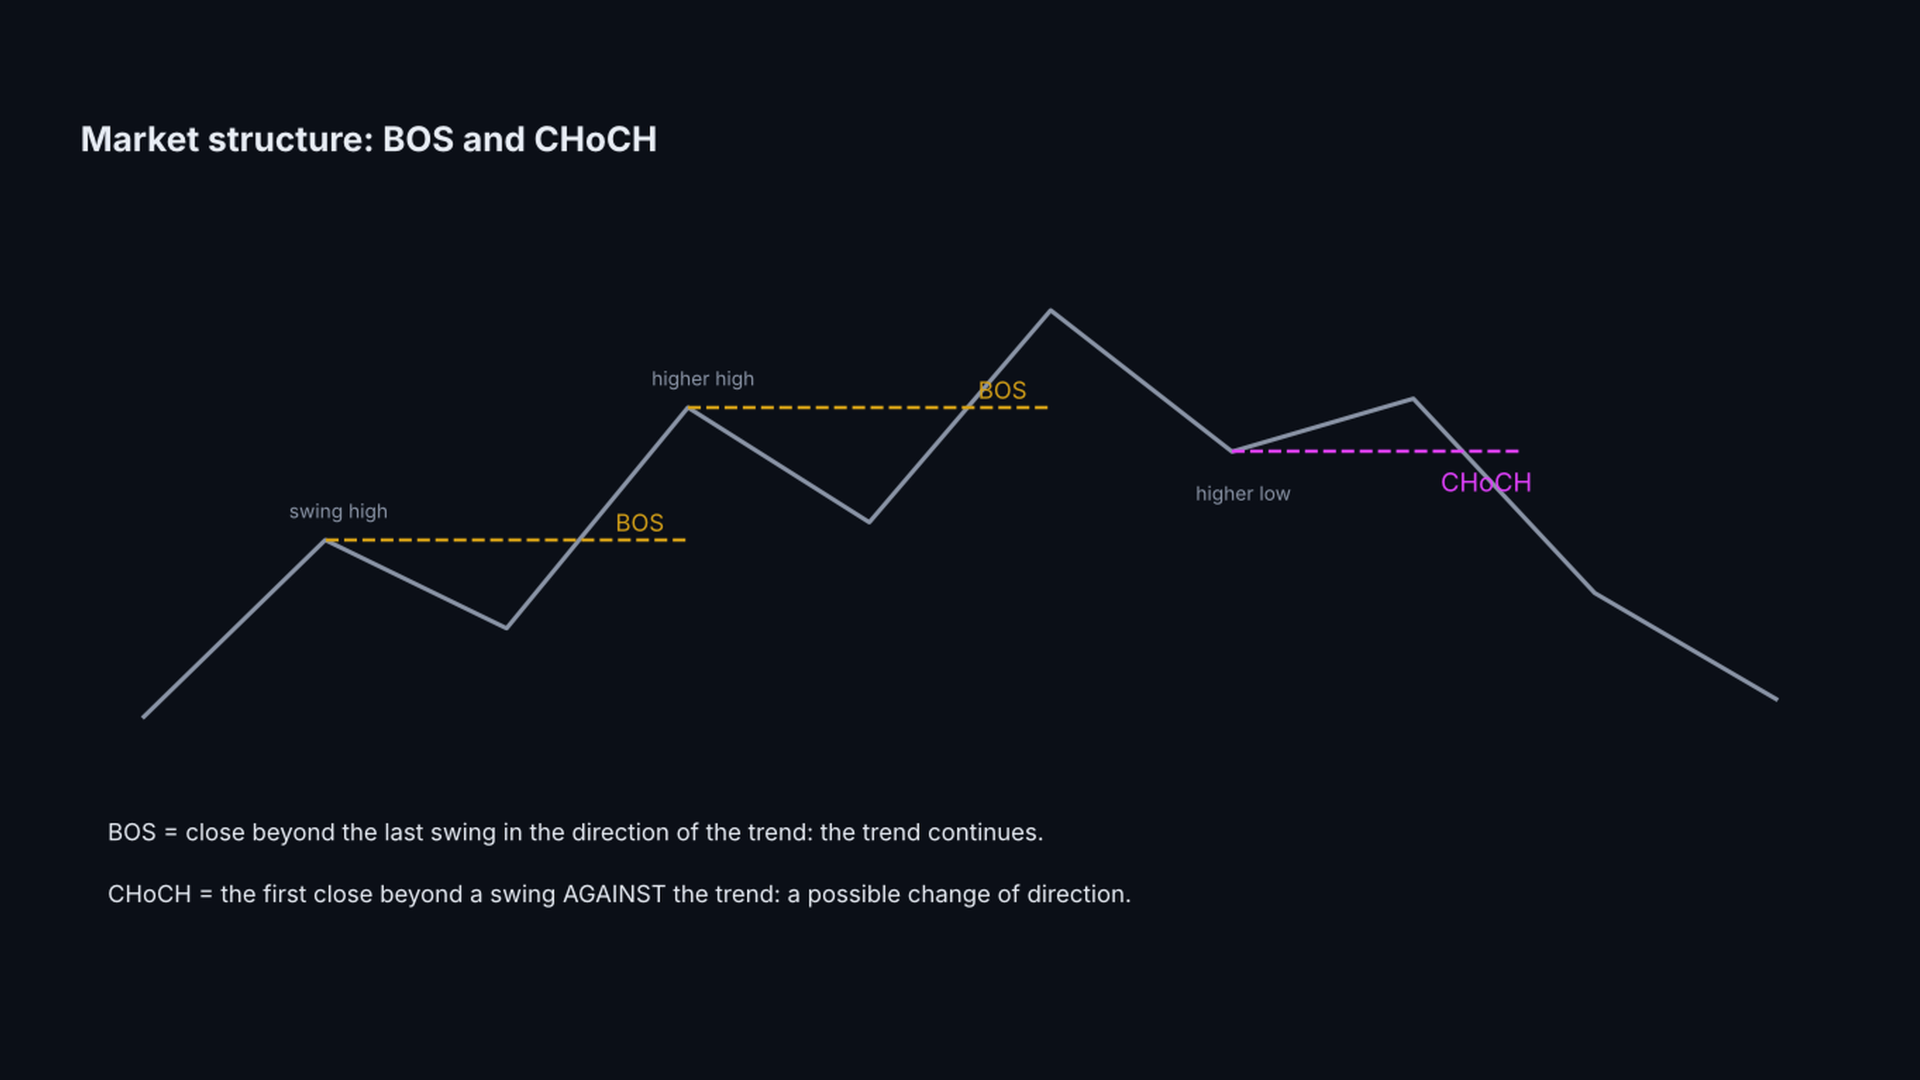
  • Market structure: break of structure (BOS) and change of character (CHoCH) lines.
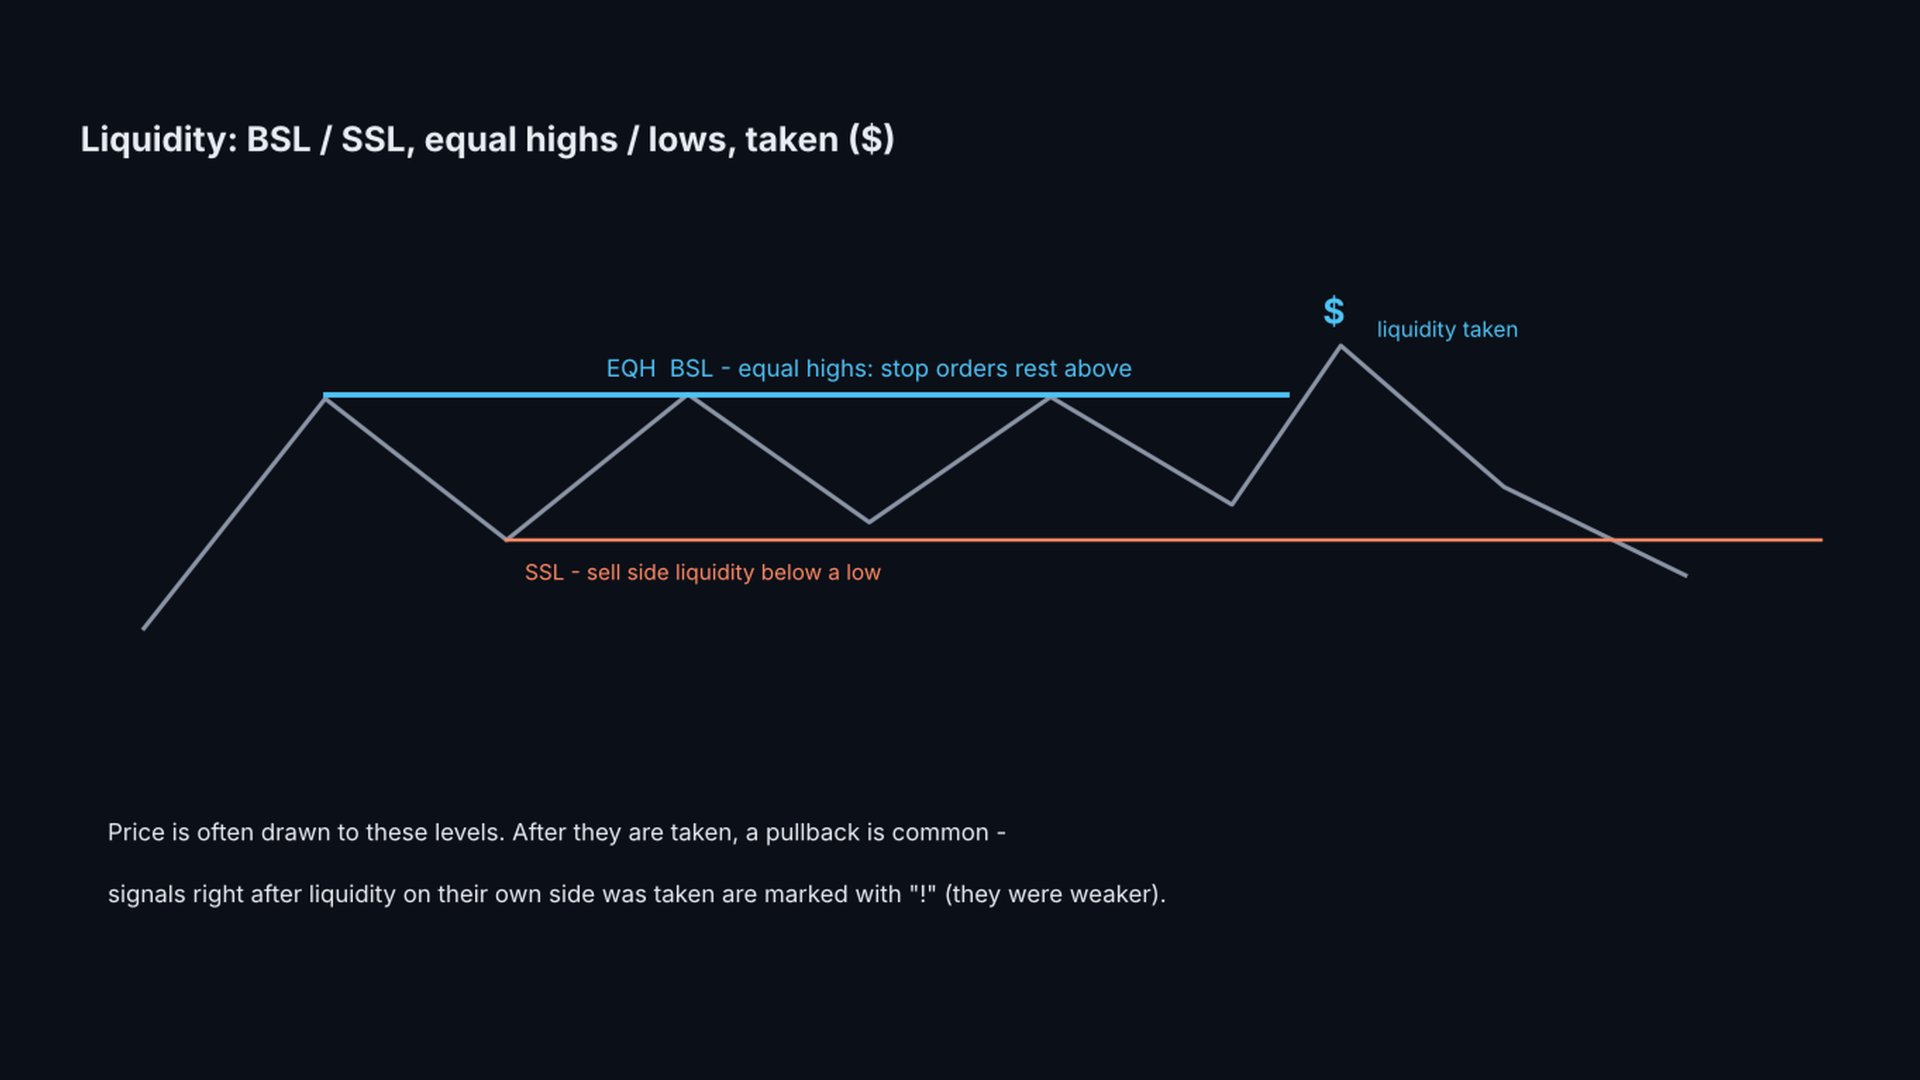
  • Liquidity: resting buy side / sell side liquidity (BSL / SSL), equal highs / lows (EQH / EQL) and where liquidity was taken ($).
  • Caution mark "!" on signals that come right after liquidity on the same side was taken.
  • Hover the mouse over any zone, arrow, line or label: a tooltip explains what it is, with the prices and the SL.
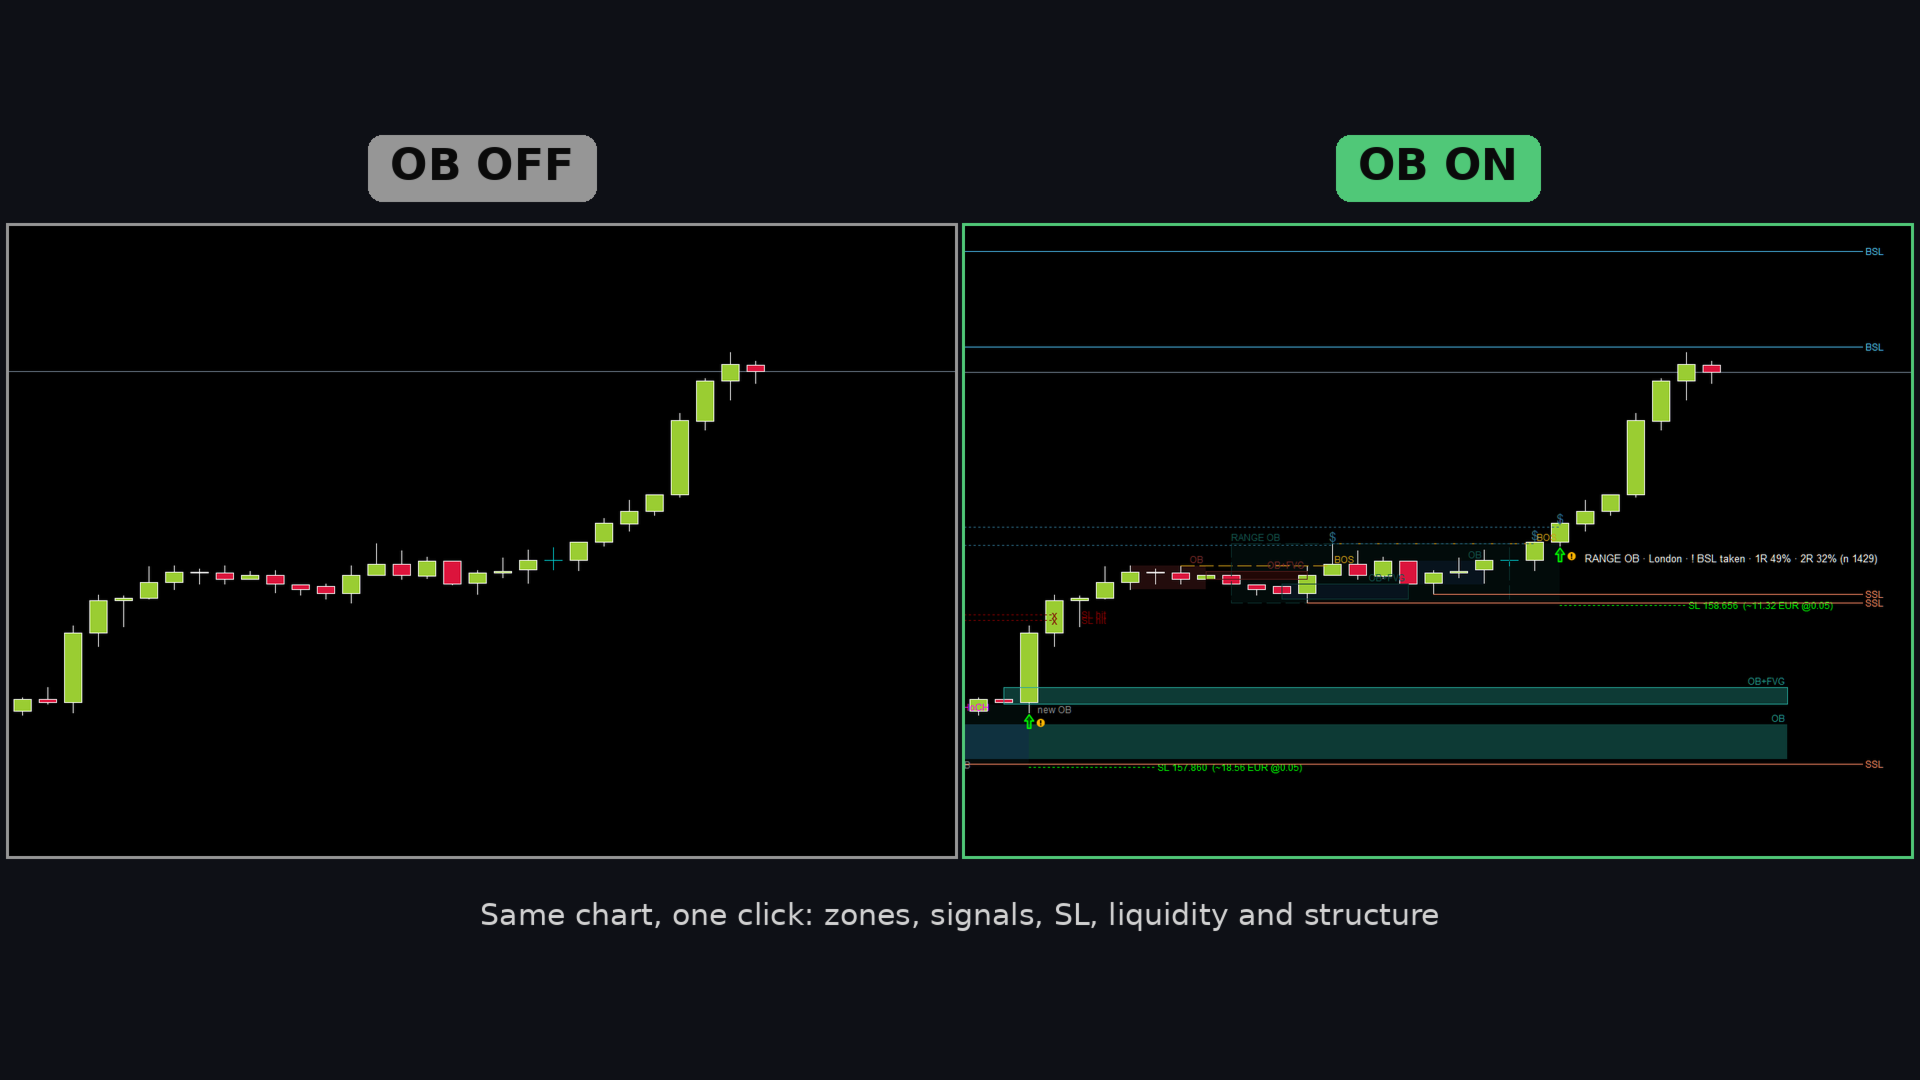
  • "OB ON / OB OFF" button to hide everything with one click. Popup and push alerts.
  • Works on any symbol and timeframe. Light and dark charts (colors adjust automatically).

USER GUIDE

1. QUICK START

1) Attach Smart Order Blocks to a chart. The default settings work on any symbol.
2) Wait a few seconds on the first load: the probability statistics are calculated on up to 50 000 bars (StatsBars).
3) Hover the mouse over anything that is drawn to read what it is.
4) For push notifications: Tools > Options > Notifications in MetaTrader 5, enter your MetaQuotes ID and enable push notifications.

2. THE ZONES

  • Bullish OB (green): the last bearish candle before a move up. Bearish OB (red): the last bullish candle before a move down.
  • An OB is shown only when the move is confirmed: the 2 candles after it move in the same direction and the 3rd candle has closed.
  • OB+FVG (with a frame): the move left a fair value gap (a gap between candle 1 and candle 3).
  • RANGE OB (very light box with a dashed frame): a consolidation of RangeBars bars not higher than RangeMaxATR x ATR, then a close beyond it.
  • States: untouched (normal color), used = already touched (faded), broken = price closed through it ("broken").
  • An untouched zone expires after ZoneMaxBars bars.
  • "new OB" marks the candle that confirmed a zone.

3. THE SIGNALS

  • BUY: a closed candle touched an untouched bullish zone and closed back above it. SELL: the mirror case.
  • The arrow is final after the close. The label shows the zone type, the session and the probability, for example:

  "RANGE OB · London · 1R 55% · 2R 37% (n 120)".

  • SL line: a short dotted line behind the zone (+ SLBufferATR x ATR) with the risk in money, for example "SL 152.569 (~11.40 USD @0.01 lot)". If the SL is hit later, the line is faded, runs to the candle that hit it and shows "x SL hit".
  • SLMode: behind the whole zone (default), behind the middle of the zone, or behind the zone but max SLMaxATR x ATR from its edge. In our tests the stop behind the whole zone was the best on every timeframe; smaller stops were hit more often and were weaker in R.
  • Hollow arrow = possible signal on the open candle. About 1 in 3 becomes a signal. Useful on lower timeframes to look at the chart before the close.
  • SkipInsideRange: no OB signal while the signal candle is still inside a consolidation.
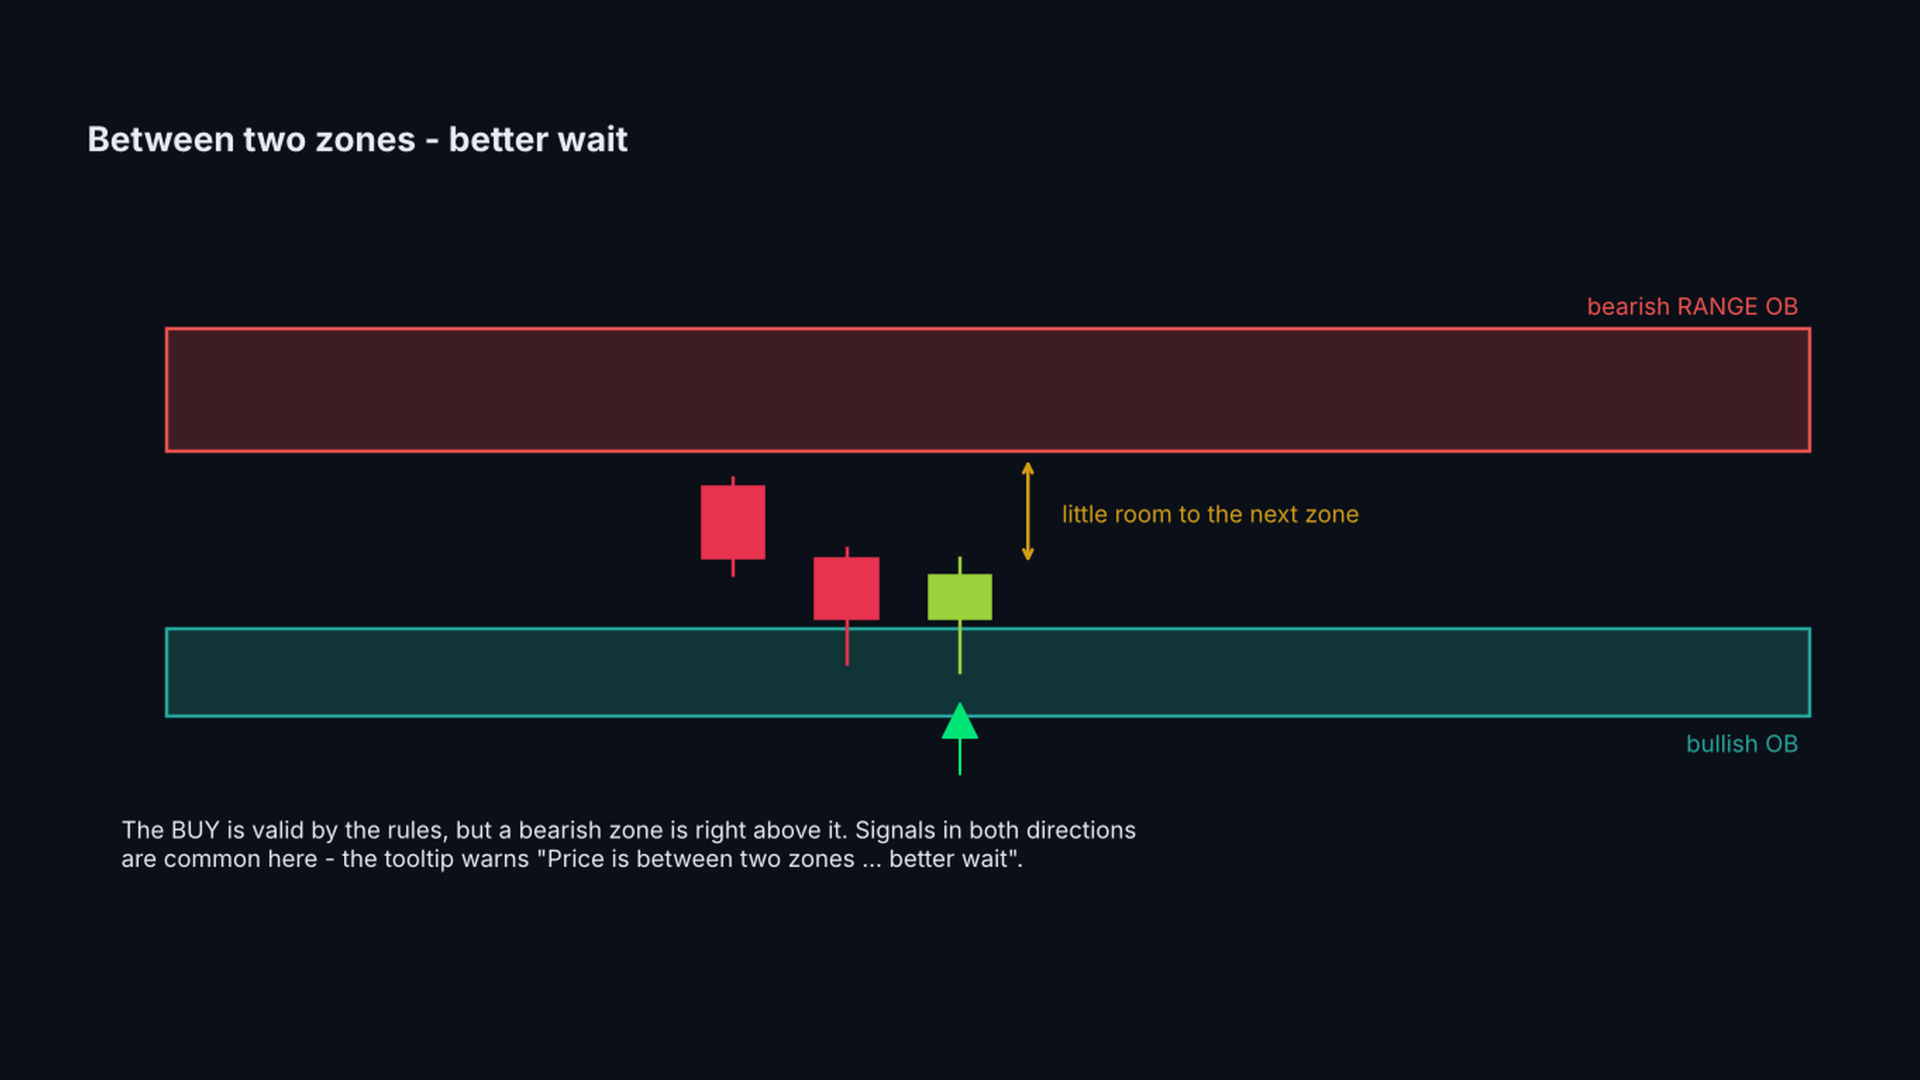
  • The tooltip of every arrow names the zone it comes from (for example "BULLISH OB 4010.30 - 4025.10"). If a zone in the opposite direction is right in front of the signal, the tooltip says "Price is between two zones ... better wait". This happens often: a buy from a green zone just under a red zone is a valid signal by the rules, but the price has little room.
  • The tooltip of every arrow says whether the signal is with or AGAINST the market structure (last BOS / CHoCH). Signals against the structure were not worse on average in our tests, so they are shown by default; HideAgainstStructure hides them if you prefer.
  • Waiting for a confirmation on a lower timeframe (for example a BOS on M5 after an H1 signal) did not help in our tests: the confirmed signals were the good ones, but by the time of the confirmation the price had already moved and the later entry gave the advantage back.

4. THE PROBABILITY - WHAT IT MEANS

  • For every closed past case of the same type (OB, OB+FVG, RANGE OB, with or without rejection, after liquidity taken) the indicator checks what came first: 1R / 2R or the SL.
  • 1R = the SL distance, 2R = twice the SL distance. n = number of past cases. With fewer than MinCases cases it shows "not enough data".
  • It is calculated walk-forward: each case uses only what was known at that time. It is a description of the past on this symbol and timeframe, not a prediction.
  • Use it to compare: which zone types and timeframes have worked better on the symbol you trade.

5. FVG, STRUCTURE AND LIQUIDITY - THE CONTEXT

These show what just happened on the chart. In our tests they did not make the signals better on their own, so use them as context, not as filters:

  • FVG: a gap between candle 1 and candle 3 of a strong move. An OB with an FVG is drawn with a frame (OB+FVG).
  • BOS: a close beyond the last swing high / low in the direction of the structure - the trend continues.
  • CHoCH: the first close beyond a swing against the previous structure - a possible trend change.
  • BSL / SSL: untaken swing highs / lows where stop orders rest. EQH / EQL = equal highs / lows (thicker line).
  • Taken liquidity: a dotted faded line and "$" where price went beyond the level.
  • "!" next to an arrow: liquidity on the same side was taken on the signal candle or the candles before it (LiqCautionBars). In our tests these signals were weaker.

6. A PRACTICAL WAY TO USE IT

This is a tool for manual trading, not a system that takes every arrow. What we found when we developed it (XAUUSD, H1 2020-2026, M5 / M15 2025-2026, costs included):

  • Order block zones are real levels: price reacted from them clearly more often than from random candles, in every year we tested. Use them for where to look, where to put the stop and where to take profit.
  • Waiting for the rejection close was better than entering at the first touch.
  • RANGE OB on H1 was the strongest signal type. Many traders use H1 for the zones and the direction and a lower timeframe (M5 / M15) for the entry.
  • All signals together are only about breakeven after costs. Taking every arrow is not a strategy.
  • When signals come in both directions within a few candles, price is between two zones: better wait.
  • Signals with "!" (right after liquidity on the same side was taken) were weaker.

Past results do not guarantee future results. Check the probability on your own symbol and timeframe, and test on a demo account first.

7. RISK

  • The SL is behind the zone: typically about 1.3 ATR for an OB and about 3 ATR for a RANGE OB. On D1 / H4 this is a large distance in price, but it is normal for the timeframe - an H1 stop is many times smaller in price.
  • Size the position from the SL distance, not from a fixed lot: the tooltip and the SL label show the distance in price, in ATR and in money for MoneyLot (0.01 by default). Keep the money at risk the same on every timeframe.
  • Two or three losses in a row are normal with any setup that wins about half of the time.

8. RISK : REWARD - THE MATH

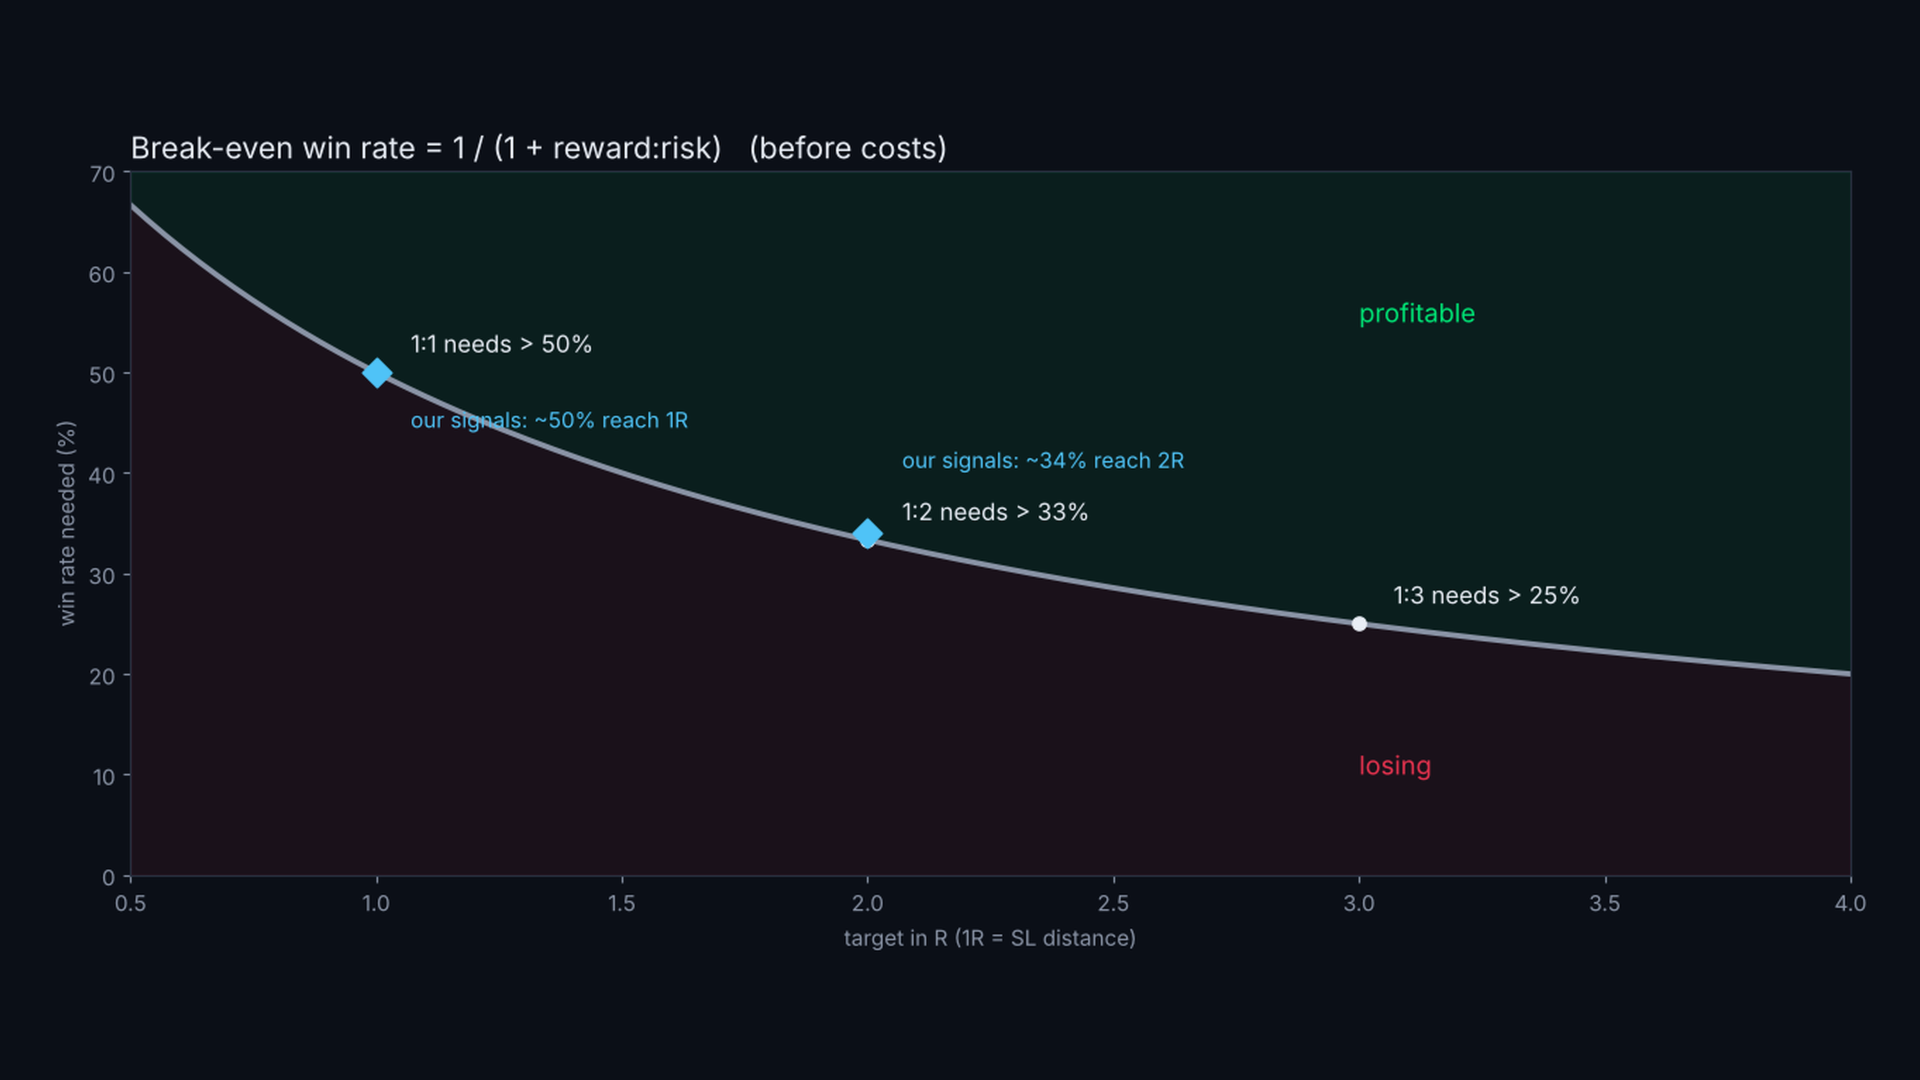
With a fixed target, a setup is profitable only if it wins more often than this (before costs):

  • 1:1 (target = 1 x SL distance): more than 50% of the trades
  • 1:2: more than 33%
  • 1:3: more than 25%

The signals of this indicator reached 1R in about 50% and 2R in about 34% of the cases in our tests - that is about breakeven with a 1:1 or 1:2 target once spread and commission are paid. So:

  • Do not use small targets. Aim for at least 1:2, better 1:3, and let the trade reach the next zone or liquidity level.
  • In our tests the best results came from RANGE OB on H1 (positive at 1:2 and 1:3) and from the higher timeframes (D1). Plain OB signals on M5 were negative at every target.
  • The probability in the label (1R % / 2R %) tells you which targets made sense on your symbol and timeframe: if 2R % is clearly above 33%, a 1:2 target has worked there.

9. FAQ

  • Does it repaint? No. Zones appear after the confirming candle closes, signals after the rejection candle closes. Only the hollow "possible" arrow on the open candle can disappear.
  • Why does the first load take a few seconds? The statistics are calculated on StatsBars bars. Reduce StatsBars for a faster start.
  • Why "not enough data"? There are fewer than MinCases past cases of this type on the chart. Load more history or use a lower timeframe.
  • The session names (Asia, London, NY) use the server time GMT+2 / GMT+3 that most brokers use.
  • Should I close the trade on a CHoCH against it? In our tests this did not help: it cut as many winning trades as losing ones. Use BOS / CHoCH as context.
  • What does the button do? It hides / shows everything the indicator draws. Signals, statistics and alerts keep working.

INPUT PARAMETERS

Order blocks

  • ShowZones, FVGMinATR (min gap size for OB+FVG), ZoneMaxBars (expiry), MaxZonesShown, UsedZonesShown, zone colors and transparency, FrameWidth, ZoneLabels, ShowNewOBMark.

Range order blocks

  • ShowRangeOB, RangeBars (12), RangeMaxATR (3.0), RangeZonesShown, colors, RangeTransparency, SkipInsideRange, HideAgainstStructure (off: hide signals against the last BOS / CHoCH; in tests this gave fewer signals, not better ones).

Signals

  • ShowSignals, SignalsShown (10), BuyColor, SellColor, ArrowSize, ShowSL, SLMode, SLMaxATR (1.5), SLBufferATR (0.1), MoneyLot (0.01), SLLineBars, SLWidth, ShowSignalLabel, LabelsShown, MarkAfterLiquidity, LiqCautionBars, CautionColor, ShowPossible, PossibleColor, PossibleBlink.

Probability

  • ShowProbability, MinCases (30), MaxHoldBars (300), ShowPanel (statistics panel), ShowButton, PanelFontSize.

Structure

  • ShowBOS, ShowCHoCH, PivotBars (3), colors, style, width, StructShown.

Liquidity

  • ShowLiquidity, LiqLevels, EqualTolATR, BSLColor, SSLColor, styles and widths, ShowTaken, TakenShown.

General

  • HistoryBars (objects only for the last N bars), StatsBars (statistics on the last N bars), TextColor (None = automatic).

Alerts

  • AlertPopup, AlertPush, AlertSignal, AlertPossible, AlertCancel, AlertNewOB, AlertTouch, AlertLiquidity.

IMPORTANT

Smart Order Blocks is an analysis tool. It does not open trades. The probabilities describe the past on your chart; they are not a promise for the future. The decision, the stop and the position size are yours.
Produtos recomendados
Contraction Expansion Meter A clear and powerful volatility indicator that visualizes market contraction and expansion in real time. Based on Bollinger Bands logic, the indicator measures the relative width of the bands and compares it to its own moving average. This creates a highly intuitive oscillator that shows when the market is compressing (contraction / squeeze) or expanding (volatility breakout). What you see on the chart: Histogram Blue bars → Expansion (volatility is increasing) Red ba
Hrum
Yvan Musatov
4 (1)
The Hrum indicator was created to neutralize temporary pauses and rollbacks. It analyzes price behavior and, if there is a temporary weakness in the trend, you can notice this from the indicator readings, as in the case of a pronounced change in trend direction. Entering the market is not difficult, but staying in it is much more difficult. With the Giordano Bruno indicator and its unique trend line, staying on trend will become much easier! Every rise and every fall is reflected in your emoti
Heikin –  Smart Volume Support Overview It provides enhanced visualization of price trends and momentum, with advanced customization options, theme integration, and seamless compatibility with volume-based tools. Designed for manual traders, scalpers, and algorithmic analysts, this indicator offers superior clarity for trend detection, momentum strength, and reversal spotting — especially when combined with volume analysis. Key Features Pure Heikin Ashi Candles Generated natively (not overlays
AlgoKing Chandelier Exit Indicator (MT5) The Chandelier Exit Indicator is a volatility based indicator that maximizes returns using the Average True Range (ATR) value and the highest high or lowest low of a period. Benefits Should be used as a trailing stop. Helps you exit a position when you have a respectable profit. Identifies a high probability of a trend reversal when the price moves against the prevailing trend by a distance equal to 3x the average volatility. Join the AlgoKing Lightning
**News Monitor Allert** Trading the financial markets without being aware of the economic calendar is a critical mistake that leads to unnecessary losses. Even the best technical strategy can fail instantly during a high-impact news release. This utility provides the ultimate solution, acting as a safeguard for your capital. One of the most powerful features of this indicator is its ease of use. Unlike many other tools on the market, **you do not need to configure any external links, download
Volume Bands Chart
Rafael Caetano Pinto
Este indicador marca os níveis de volume relevantes ao longo do dia. Os dois níveis relevantes são o candle com mais volume e o período com mais volume de lotes transacionados. O fundo vermelho preenchido é a faixa de preço com o volume mais relevante do dia (provavelmente o grande jogador que está no comando do jogo). As linhas roxas mostram a faixa de preço com maior volume (provavelmente uma área onde algum grande jogador está se acumulando antes de forçar uma direção do mercado). Há tamb
Ichimoku Map (instant look at the markets) - built on the basis of the legendary Ichimoku Kinko Hyo indicator. The task of the Ichimoku Map is to provide information about the market strength on the selected time periods and instruments, from the point of view of the Ichimoku indicator. The indicator displays 7 degrees of buy signal strength and 7 degrees of sell signal strength. The stronger the trend, the brighter the signal rectangle in the table. The table can be dragged with the mouse. The
NeuronSniper is a complete ICT (Inner Circle Trader / smart-money) workspace and setup engine for MetaTrader 5 from Neuron Systems. It maps the whole picture, market structure, liquidity, order blocks, fair value gaps and premium/discount, and then marks one strict, high-quality reversal setup with a fixed risk:reward plan. It is an indicator for chart analysis only: it draws on the chart, it does not place, modify or close trades, it does not send orders, and it does not manage positions or acc
Este indicador é um indicador para análise automática de ondas que é perfeito para negociações práticas! Caso... Nota:   Não estou acostumado a usar nomes ocidentais para classificação de ondas. Devido à influência da convenção de nomenclatura de Tang Lun (Tang Zhong Shuo Zen), nomeei a onda básica como   uma caneta   e a banda de onda secundária como   um segmento   . ao mesmo tempo, o segmento tem a direção da tendência.   O segmento de tendência principal   é nomeado (esse método de nomencl
KT DMA is a modified and advanced version of the classic Displaced Moving Averages with buy/sell crossover alerts and a Multi-Timeframe scanner that shows DMA's direction across each real-time time frame. A Displaced Moving Average is a simple moving average that moves ahead or backward in a time frame (either short-term or long-term). It also allows you to predict price movement more accurately. Features Depicts the trend direction using the alignment of three moving averages. Buy/Sell signals
KT Volatility Oscillator MT5
KEENBASE SOFTWARE SOLUTIONS
O Oscilador de Volatilidade KT analisa os dados de mercado passados e atuais utilizando uma fórmula matemática para exibir o resultado na forma de um oscilador. As ondas crescentes e decrescentes equivalem a alta e baixa volatilidade do ativo.  Em resumo, a volatilidade é simplesmente uma medida das flutuações de preço de um ativo ao longo de um determinado período de tempo. Sem volatilidade, haveria pouco movimento no mercado e os traders não poderiam lucrar com as variações de preço. Uso da V
Indicator description of Yijing Guaxiang Oscillation Mean Indicator: (1) This Yijing Guaxiang change indicator is based on the Yin-Yang transformation thought of the "I Ching" philosophy in ancient Chinese culture, integrating the results of the long-short game in each candlestick K-line period of the financial trading K-line chart, using China's oldest prediction coding method, in the form of the 64 hexagrams of the I Ching, combining the Yin-Yang of each line of the hexagram with the Yin-Yang
Hurst-YZ Engine measures the one thing those indicators can't: whether the market is structurally trending or structurally mean-reverting, right now. It does this with two pieces of real quant math, the kind used on institutional research desks, not repackaged crossovers. Early-bird pricing active: Only $65 for the next 10 licenses. The price increases by $15 after every 10 copies sold to maintain premium value until it reaches its final target value of $150. Secure your copy at the lowest tie
Shqiponja Gold EA is an advanced automated trading system specifically designed and optimized for Gold (XAU/USD) scalping and trend-following strategies. Built with precise price action mechanics, it targets structural market movements to capture high-probability entries. Key Features: - Optimized for XAU/USD: Tailored specifically to handle the volatility and price action of Gold. - Smart Trend Filtering: Integrates multi-timeframe structural analysis to avoid false breakouts. - Risk Manageme
KT Connors RSI MT5
KEENBASE SOFTWARE SOLUTIONS
KT Connors RSI is a modified and more advanced version of the original Connors RSI developed by Larry Connors. It was designed to help traders generate trade signals based on short-term price movements. The Connors combine the standard RSI calculation with two additional elements: a short-term RSI, ROC, and a moving average. Features Provides more transparent and more actionable buy and sell signals using the overbought/oversold zones. Incorporates short-term RSI and moving average, providing
Horus Market Structure is an analysis indicator for MetaTrader 5. It combines price structure, liquidity and trend context in one chart. FEATURES - BOS and CHoCH structure marks, confirmed pivots and liquidity sweeps. - Automatic multi-swing and best-pair trendlines. - Scored analytical BUY/SELL marks with suggested Entry, SL and TP1-TP3 levels. - Multi-timeframe Order Blocks and Fair Value Gaps. - Adaptive MAX BUY/SELL zones, Stochastic K/D on price, swing zigzag and tick-volume profile. - Mul
VWAP Breakout Entry draws an anchored VWAP from market structure pivots and marks trade entries when price retests it after a breakout. Every signal comes with a stop loss and three take-profit levels, and the chart shows the full trade the way a charting platform would. Symbol : GBPUSD Timeframe : M15 / 15 Minutes Default settings are optimized for GBPUSD on M15 How it works The indicator detects swing highs and lows and anchors a VWAP to the latest structure leg. When price breaks structure a
Buy Sell Signal MTF - Advanced Reversal Indicator Buy Sell Signal MTF is a highly optimized, professional-grade trend reversal indicator designed for MetaTrader 5. It uses a sophisticated dual-layer algorithm combining Volatility (ATR) and Momentum (Stochastic Oscillator) to pinpoint highly accurate entry levels without cluttering your chart with false signals. Whether you are a scalper, day trader, or swing trader, this indicator is built to deliver precision and reliability. The signals are 1
FREE
Indicador Crypto_Forex "Histograma de Tendência Exponencial" para MT5, sem repintura. - O indicador Histograma de Tendência Exponencial é muito eficiente para fins de detecção de tendências. - A melhor maneira de usá-lo é combiná-lo com os Níveis de Suporte/Resistência e a técnica de Reteste (veja as imagens): - Assim que o indicador detectar uma nova tendência, encontre o nível de SR local e organize a ordem pendente correspondente, aguardando o Reteste dessa zona. - Se a nova tendência for de
SMC Inducement Flow é um indicador para MetaTrader 5 criado para visualizar estrutura de mercado, varreduras de inducement, Fair Value Gaps e momentum por compressão em um fluxo de trabalho limpo. Ideia central: o indicador ajuda traders a acompanhar o fluxo estrutural marcando eventos BOS e CHoCH, rastreando níveis ativos de inducement, destacando varreduras e expondo buffers úteis para análise discricionária ou desenvolvimento de EAs. Preço de lançamento: este produto é publicado com um preço
Smart Reversal Prophets
Loys Steve Dzene Tagne
Avez-vous toujours rêvé de pouvoir entrer sur le marché juste après la clôture d'une bougie… et de voir le marché évoluer immédiatement dans votre sens ? Avez-vous toujours souhaité détecter les retournements de tendance plus tôt, éviter les faux signaux et, surtout, saisir les tendances longues avant la majorité des traders ? Aujourd'hui, je vais vous présenter mon nouvel indicateur : Prophète du retournement intelligent. Contrairement aux indicateurs traditionnels qui réagissent avec un certa
FlatOut Movings Robot: Controle absoluto do flat. Navegação segura na tendência. As estratégias de indicadores baseadas em médias móveis têm um pesadelo principal. Assim que o mercado muda de fase, o seu depósito começa a derreter. As médias móveis clássicas geram dezenas de cruzamentos falsos em períodos de flat (lateralização). E os filtros padrão atrasam impiedosamente. Você passa as noites estressado em frente ao terminal e entra bem no final do movimento. Este software foi criado para re
McGinley Trend Pullback Strategy - Multi-Average Trend and Pullback System McGinley Trend Pullback Strategy is an automated trading system that trades only when four averages line up in trend order and price confirms against the session VWAP. It enters on a fresh alignment and on pullback bounces off the McGinley Dynamic line, and it uses a Zero-Lag EMA filter to avoid catching the first move after a reversal. Every trade has a stop loss and a take profit. It does not use martingale, grid strat
Your Treand
Tatiana Savkevych
The Your Trend indicator not only signals an immediate buy or sell. It indicates a short-term and long-term trend. operations. The simplest way to use the indicator is to open a trade in the direction of an existing trend. The indicator allows you to study the real and historical market trends in more detail! Shows the opening points of transactions for sale or purchase, and also indicates the direction of the trend on: short-term and long-term periods. The analysis is based on the selected tim
If you are unsure how to use this indicator, please feel free to reach out to me. I will explain it to you and provide reading materials to help you make the most of it. TD Sequential Scanner: An Overview The TD Sequential scanner is a powerful technical analysis tool designed to identify potential price exhaustion points and trend reversals in financial markets. Developed by Tom DeMark, this method is widely used by traders to gauge market cycles and potential turning points with precision. Ho
MetaForecast M5
Vahidreza Heidar Gholami
5 (3)
MetaForecast prevê e visualiza o futuro de qualquer mercado com base nas harmonias nos dados de preços. Embora o mercado nem sempre seja previsível, se houver um padrão nos preços, o MetaForecast pode prever o futuro com a maior precisão possível. Em comparação com outros produtos similares, o MetaForecast pode gerar resultados mais precisos ao analisar as tendências do mercado. Parâmetros de entrada Past size (Tamanho do passado) Especifica o número de barras que o MetaForecast usa para criar
# Momentum Curvature - Acceleration versus velocity *Category: Momentum | Difficulty: intermediate | Window: separate window below the chart | Markets: Universal (Forex, indices, commodities, crypto, stocks) | Suggested timeframes: M15, M30, H1, H4, D1* ## Short description > Measures price acceleration, the second derivative of the smoothed series, and compares it with velocity. It detects loss of thrust before direction changes. ### Overview Anyone who drives knows the brake pedal acts o
"Battles between bulls and bears continue to influence price development long after the combat has ended, leaving behind a messy field that observant technicians can use to manage risk and find opportunities. Apply "trend mirror" analysis to examine these volatile areas, looking for past action to impact the current trend when price turns and crosses those boundaries." RSI Mirrors and Reflections is a robust technique using multiple RSI periods, mirrors and reflections based on RSI values to ind
Crypto Hades Adaptive-Swing  Dynamic Fibonacci Matrix & MTF Trend Alignment Crypto Hades Adaptive-Swing  is an elite institutional-grade Expert Advisor designed specifically for extreme cryptocurrency volatility (BTCUSD, ETHUSD). Named after Hades, the Greek god of the underworld, this EA waits patiently for deep pullbacks and strikes at the most advantageous "underworld" price levels using a dynamic mathematical matrix. Unlike standard trend followers that buy at the top, Hades uses a Multi-
Os compradores deste produto também adquirem
Trend Sniper X
Sarvarbek Abduvoxobov
4.86 (44)
Trend Sniper X é um indicador de acompanhamento de tendência para múltiplos tempos gráficos no MetaTrader 5 que ajuda os traders a identificar a direção da tendência e potenciais pontos de reversão com clareza e precisão. para MT4: https://www.mql5.com/en/market/product/193245 Informações sobre o preço: O preço atual é promocional e está sujeito a alterações à medida que novas atualizações e funcionalidades forem lançadas. Oferta Bônus: Para obter o Auto-Trade Assistant EA GRATUITO para este in
Um novo Rei chegou à cidade - Indicador + Gestão de Ordens (TP1 + TP2 + TP3) + Enviador opcional de sinais para Telegram INCLUÍDO (GRÁTIS) (SISTEMA COMPLETO DE TRADING e SINAIS) Nosso melhor EA para Ouro: Gold Slayer Este indicador inclui uma estratégia avançada, um sistema de trading com gestão de ordens personalizável e um sistema de reversão à média que combina extensões de envelopes, apoiado por múltiplos filtros inteligentes de confirmação, como o RSI, para capturar entradas de reversão de
Smart Trend Trading System — MetaTrader 5 Após a compra, envie-me uma mensagem no MQL5 para receber Smart Universal Expert Advisor GRÁTIS, além do curso online, do manual em PDF e do acesso ao grupo privado. O STTS reúne a direção da tendência, sinais de entrada e saída, zonas de reversão e níveis de preço importantes diretamente no seu gráfico. Siga o sistema manualmente ou conecte um EA compatível separado para executar operações automaticamente com as configurações que você escolher. UM SISTE
Zoryk Gold
Reda El Koutbane
4.79 (19)
O desconto termina em 24 horas — próximo preço $ 69 ZORYK — Sistema avançado de sinais para XAUUSD no MetaTrader 5 Você conhece essa sensação. Você passa muito tempo analisando o ouro. Espera pela entrada certa. Finalmente abre a operação e o preço começa imediatamente a se mover contra você. Você fecha cedo demais, move o Stop Loss ou hesita por alguns segundos. Depois disso, o mercado alcança exatamente o destino que você esperava originalmente, mas sem você dentro da operação. O problema ne
Tenha sua vantagem no trading à vista! M5 Sniper é um novo indicador da MeanFX. Ele combina sinais de trading precisos com níveis adaptativos de TP/SL — criando, como resultado, as melhores operações estatísticas possíveis! O preço aumenta a cada 5 compras, o próximo preço é de 69$ Envie-me uma mensagem após a compra para receber dicas/guia e um EA bônus O que o faz se destacar? Desempenho estatístico comprovado no Gold XAUUSD ( funciona em praticamente todos os ativos , com foco em dominar um ú
O Entry Points Pro mostra onde entrar, onde colocar o stop e com qual lote operar — antes de você colocar a ordem. PREÇO Agora 199 USD: 8 cópias por este preço, depois 249 USD. O preço final é 349 USD. Eu ganho meu dinheiro operando nos mercados e mostro isso, por isso não preciso vender este indicador para todo mundo. É uma ferramenta para traders que pensam por conta própria, não um botão mágico. Sem rompimento, não há operação. Uma seta cinza é um sinal cancelado: o preço não rompeu o candle
Ultra Indicator
Ihor Otkydach
5 (1)
O ULTRA é um indicador técnico que funciona numa base «tudo-em-um» — analisa o mercado de forma independente, gera sinais de negociação, apresenta níveis para definir ordens de stop-loss e sugere quando encerrar as negociações para garantir lucros ou minimizar perdas. Por outras palavras, não importa se não sabe analisar o mercado, determinar níveis — onde definir o seu stop-loss — ou se tem dificuldades com a gestão do capital. O ULTRA fará tudo isso por si! BÓNUS PARA O COMPRADOR: Após adquiri
Gann Made Easy   é um sistema de negociação Forex profissional e fácil de usar, baseado nos melhores princípios de negociação usando a teoria do sr. W. D. Gann. O indicador fornece sinais precisos de COMPRA e VENDA, incluindo níveis de Stop Loss e Take Profit. Você pode negociar mesmo em movimento usando notificações PUSH. Entre em contato comigo após a compra para receber instruções de negociação e ótimos indicadores extras gratuitamente! Provavelmente você já ouviu muitas vezes sobre os método
SuperScalp Pro
Van Minh Nguyen
4.54 (37)
SuperScalp Pro - Professional Multi-Layer Confluence Scalping System O SuperScalp Pro é um indicador avançado de scalping que aprimora o Supertrend clássico com vários filtros inteligentes de confirmação. Ele ajuda a identificar oportunidades de Buy/Sell com maior probabilidade de sucesso, reduzindo significativamente os sinais falsos. Setas claras de Buy e Sell aparecem diretamente no gráfico, juntamente com os níveis de Stop Loss e Take Profit baseados em ATR, calculados automaticamente em tem
GoldenX Entry MT5
VividMind Digital Solutions
5 (17)
GoldenX Entry é um indicador para MT5 com um algoritmo adaptativo Smart Entry Trend, um sistema de pontuação de sinais, um detector de regime de mercado e um filtro de volatilidade. Cada sinal inclui um nível de entrada calculado, três níveis de Take-Profit (TP1, TP2, TP3) e um nível de Stop-Loss. Ele é construído sobre múltiplas camadas analíticas projetadas para se adaptar a diferentes condições de mercado, combinando um sistema analítico multicamadas com um otimizador integrado e um sistema d
Gold Trend Coach MT5
Cristhian Alexander Gaibor Cuasquer
4.27 (11)
Sinais de compra e venda sem repintura para o ouro (XAUUSD) no MetaTrader 5. Todo sinal vem com stop loss e três take profits. Um filtro Smart Money Concepts com BOS e CHoCH, para você operar a favor da estrutura, não contra ela. Um Mentor ao vivo no seu painel que guia cada passo, da entrada até o TP3. E alertas direto no seu celular e no seu próprio canal do Telegram. Isso é o Gold Trend Coach. Nunca mais opere sozinho. KIT DO COMPRADOR GRÁTIS junto com a sua compra: 1. Telegram Alert Bridge:
SMC Intraday Formula
VividMind Digital Solutions
5 (26)
Vamos ser honestos primeiro. Nenhum indicador sozinho vai te tornar lucrativo. Se alguém te disser o contrário, está te vendendo um sonho. Qualquer indicador que mostre setas perfeitas de compra/venda pode ser feito para parecer impecável — basta dar zoom na parte certa da história e tirar um print das operações vencedoras. Nós não fazemos isso.  SMC Intraday Formula é uma ferramenta. Ela lê a estrutura do mercado para você, identifica as zonas de maior probabilidade de preço e mostra exatament
Boba Analysis Suite
Trade Ready Solutions LLC
5 (2)
Boba Analysis Suite O Boba Analysis Suite é um indicador de análise para o MetaTrader 5. Reúne a estrutura do mercado, as zonas de preço relevantes e o contexto geral do mercado numa única visualização do gráfico. Desenvolvido a partir da experiência prática como trader e formador de traders, apoia um processo de análise estruturado: avaliar a direção do mercado, identificar níveis importantes e analisar vários períodos gráficos em conjunto. Análise em contexto O significado de cada sinal depend
Próxima Atualização — Versão 2.52 em Breve! [NOVO] Prepare-se para 4 Grandes Novos Recursos Projetados para Aprimorar sua Análise de Mercado e seu Fluxo de Trabalho de Trading Estamos levando a análise de mercado a um novo nível com 4 novos recursos desenvolvidos para atender às suas necessidades de trading. Apresentamos: 1. TRADE OVERVIEW DASHBOARD 2. CONFLUENCE AT ZONE 3. STRONG & WEAK HIGH/LOW 4. OTE 1. TRADE OVERVIEW DASHBOARD Um painel que ajuda você a compreender mais facilmente o panoram
FX Power MT5 NG
Daniel Stein
5 (33)
FX Power: Analise a Força das Moedas para Decisões de Negociação Mais Inteligentes Visão Geral FX Power é a sua ferramenta essencial para compreender a força real das principais moedas e do ouro em quaisquer condições de mercado. Identificando moedas fortes para comprar e fracas para vender, FX Power simplifica as decisões de negociação e revela oportunidades de alta probabilidade. Quer você prefira seguir tendências ou antecipar reversões usando valores extremos de Delta, esta ferramenta adap
M1 Sniper MT5
Oleg Rodin
5 (7)
O   M1 SNIPER   é um sistema indicador de negociação fácil de usar. É um indicador de seta projetado para o período M1. O indicador pode ser usado como um sistema independente para scalping no período M1 e pode ser usado como parte do seu sistema de negociação existente. Embora este sistema de negociação tenha sido projetado especificamente para negociação no M1, ele também pode ser usado em outros períodos. Originalmente, desenvolvi este método para negociar XAUUSD e BTCUSD. Mas considero-o úti
FiboSniper Pro
Van Minh Nguyen
5 (4)
FiboSniper Pro – Multi-Filter Fibonacci System with Auto SL/TP and Control Panel FiboSniper Pro é um indicador técnico que combina Fibonacci Envelopes dinâmicos com vários filtros de confirmação para gerar sinais seletivos de Buy e Sell. Os níveis de Fibonacci são calculados com base em Moving Average e ATR e, em seguida, filtrados por ADX, EMA, RSI, ATR, Volume, Time e estrutura das velas. O indicador exibe diretamente no gráfico os níveis automáticos de Stop Loss e Take Profit baseados em ATR,
Auto Optimized SpeedAngle é um sistema de vetorização de momentum de nível institucional que elimina o sobreajuste ( curve-fitting ) por meio da otimização contínua de avanço ( Walk-Forward Optimization , WFO). Em vez de depender de entradas estáticas que se degradam quando os regimes de mercado mudam, o indicador recalibra dinamicamente seus parâmetros utilizando validação fora de amostra ( Out-of-Sample , OOS), garantindo que os sinais exibidos representem vantagens estatísticas genuínas e não
SQN Max indicator for MT5 by ITC
Renaud Herve Francois Candel
Sqn Max Indicator Sqn Max is an exclusive indicator to trade the market with high effectiveness. The indicator is based on price action, volatility and trend. This indicator is as simple as possible but not too simple. The indicator can generate alerts to ease the trading process. You don't have to stay all day in front of your screen. The indicator can be used with any class of assets and with any time frame. It is possible to achieve better results trading our list of selected assets. We achi
Smc Pro ToolKit
Talal N Z Aljarusha
5 (14)
SMC PRO TOOLKIT — SMART MONEY ANALYSIS & STRUCTURED TRADE PLANNING SMC Pro ToolKit is a professional Smart Money Concepts analysis workspace for MetaTrader 5. It combines market structure, multi-timeframe analysis, institutional price zones, setup evaluation, confirmation tools, volume context, alerts, and risk planning inside one organized chart environment. One workspace. Multiple layers of confirmation. One structured trading plan. OPEN COMPLETE USER GUIDE MULTI-CONDITION SETUP ENGINE At
SIO Oscillator: oscilador auto-otimizável de desequilíbrio de semivariância Compre o indicador e receba GRÁTIS o Expert Advisor (EA) baseado nele. A maioria dos osciladores trata todo movimento de preço da mesma forma. O SIO separa a pressão de alta da pressão de baixa e mede o desequilíbrio entre elas, mostrando qual lado realmente controla o mercado: compradores ou vendedores. Quando o desequilíbrio atinge um extremo, o SIO gera um sinal claro com níveis de entrada, Stop Loss e Take Profit. O
Power Candles MT5
Daniel Stein
4.58 (12)
Power Candles V3 - Indicador de força com auto-otimização O Power Candles V3 transforma a força da moeda e do instrumento num plano de negociação prático em todos os gráficos aos quais está associado. Em vez de se limitar a colorir as velas, executa uma otimização automática em tempo real em segundo plano e apresenta-lhe os melhores valores de Stop Loss, Take Profit e limiar de sinal para o símbolo em questão. Basta um clique para o adotar na negociação em tempo real — as linhas de entrada, Stop
Atomic Analyst MT5
Issam Kassas
4.51 (65)
Atomic Analyst — MetaTrader 5 Após a compra, envie-me uma mensagem no MQL5 para receber Smart Universal Expert Advisor GRÁTIS, além do curso online, do manual em PDF e do acesso ao grupo privado. O Atomic Analyst reúne a ação do preço, a direção da tendência, sinais de entrada e saída, Stop Loss e vários níveis de Take Profit diretamente no seu gráfico. VEJA O SINAL. ENTENDA O CENÁRIO. O Atomic Analyst organiza sua análise em informações visuais claras: • Setas de compra e venda para identificar
Unix Scalper
Issam Kassas
4 (4)
Unix Scalper — MetaTrader 5 Após a compra, envie-me uma mensagem no MQL5 para receber Smart Universal Expert Advisor GRÁTIS, além do curso online, do manual em PDF e do acesso ao grupo privado. Identifique a oportunidade. Veja o plano. Escolha como operar. O UNIX Scalper reúne análise de mercado, decisões BUY/SELL/WAIT e níveis de Entry, Stop Loss, TP1 e TP2 em um painel organizado. VEJA O SINAL E O PLANO • Decisões claras: BUY, SELL ou WAIT. • Níveis definidos: Entry, Stop Loss, TP1 e TP2. •
Tokyo mt5 Indicator
Vasiliy Strukov
5 (15)
O Tokyo Indicator oferece uma visão geral visual clara da direção da tendência, de possíveis sinais de negociação e das condições de mercado. Sua linha de tendência em degraus e codificada por cores distingue as fases de alta (azul) das fases de baixa (magenta). Setas direcionais correspondentes destacam possíveis oportunidades de compra e venda quando a tendência exibida muda. Um painel integrado reúne o sinal atual, o viés de mercado, o momentum, a volatilidade e a qualidade do sinal em uma v
Astral Structure
Ottaviano De Cicco
Astral Structure Avalie o setup. Veja o plano inicial. Oferta de lançamento - $99. $149 após o lançamento. Um setup de estrutura levanta várias perguntas: a visão mais ampla concorda, onde está a referência de stop e como os alvos são definidos? O Astral Structure reúne essas questões em um espaço de trabalho para traders discricionários que baseiam suas decisões na estrutura do mercado. Concentre-se no setup relevante. Revise em conjunto o setup elegível mais recente, sua direção e sua qualific
Crystal Heikin Ashi Signals
Muhammad Jawad Shabir
5 (5)
Crystal Heikin Ashi Signals—Professional Trend & Signal Detection Indicator Advanced Heikin Ashi Visualization with Intelligent Signal System for Manual & Automated Trading Final Price: $149 ---------> Price goes up $10 after every 10 sales . Limited slots available — act fast . Overview User Guide PDF Crystal Heikin Ashi Signals is a professional-grade MetaTrader 5 indicator that combines pure Heikin Ashi candle visualization with an advanced momentum-shift detection system. Designed for both m
Trend Catcher ind mt5
Ramil Minniakhmetov
5 (18)
INDICADOR TREND CATCHER O Indicador Trend Catcher analisa os movimentos de preços do mercado, utilizando uma combinação de indicadores de análise de tendências adaptativos, proprietários e personalizados pelo autor. Identifica a verdadeira direção do mercado, filtrando o ruído de curto prazo e focando a força do momentum subjacente, a expansão da volatilidade e o comportamento da estrutura de preços. Utiliza também uma combinação de indicadores personalizados de suavização e filtragem de tendê
Indicador multi-moeda de força e momentum MT5 O Dynamic Forex28 Navigator é a evolução dos nossos indicadores populares de longa data, reunindo o poder de cinco em um: Advanced Currency Strength28 Indicator (700 avaliações) Advanced Currency IMPULSE with ALERT (530 avaliações) Currency Strength EXOTICS GOLD Impulse with Alert CS28 Combo Signals (bônus atual) Não é necessário comprar quatro indicadores e empilhá-los nos seus gráficos. Tudo está reunido em um único indicador poderoso: a força dos
O Scalper Vault é um sistema de negociação poderoso e completo, projetado para traders que buscam consistência em operações intraday. Este indicador de alta precisão funciona como um sistema de negociação autônomo, oferecendo análises de nível institucional tanto para o mercado Forex quanto para Opções Binárias. ENTRE EM CONTATO COMIGO APÓS A COMPRA PARA RECEBER DICAS DE NEGOCIAÇÃO E UM BÔNUS EXCLUSIVO! Ao eliminar suposições e análises manuais complexas, o Scalper Vault permite que você foque
Mais do autor
MACD Adaptive is a MACD that adjusts its periods to the market and never repaints. Every bar is calculated only with the data available up to that bar. If you reload the chart or restart the terminal, the history looks exactly the same as it did live. What you see in the past is what you would have seen in real time. MAIN FEATURES Adaptive periods: shorter in a clean trend, longer in choppy noise. Can be switched off for a classic MACD. Buy / Sell arrows on a CLOSED bar (final, never disappear)
FREE
Plan, test and track your trades directly on the MT5 chart: a long / short position tool with partial take profits, a moving stop loss, a trading journal, statistics and alerts. Click LONG or SHORT, click on the chart where the entry should be, drag the SL and TP - and you see the risk and the reward in money, the R:R and the lot for your risk %. Press SAVE and the tool stays on the chart: it is tracked candle by candle on the history and live, and every saved trade goes into the statistics and
A free long / short position tool for MetaTrader 5: click where the entry should be, drag the stop loss and the take profit, and see the risk and the reward in money, the R:R and the lot for your risk % of the balance. No more counting points and pip values before every trade: the tool shows the lot that keeps your risk at the % you choose, with the commission included. The indicator does not open or close trades. It is a planning tool, the decision is yours. MAIN FEATURES Click to place: press
FREE
A free chart-pattern indicator for MetaTrader 5 that tells you the truth about each pattern: how often it really reached 1R and 2R on your symbol and timeframe, next to what a random entry with the same stop did. Most pattern indicators only draw arrows. This one measures them. Every signal shows its historical win % and the "random %" for the same direction and stop size, so you can see at once whether a pattern has an edge on the chart you trade - or not. The indicator does not open or close t

FREE
Filtro:
Sem comentários
Responder ao comentário