Smart Order Blocks

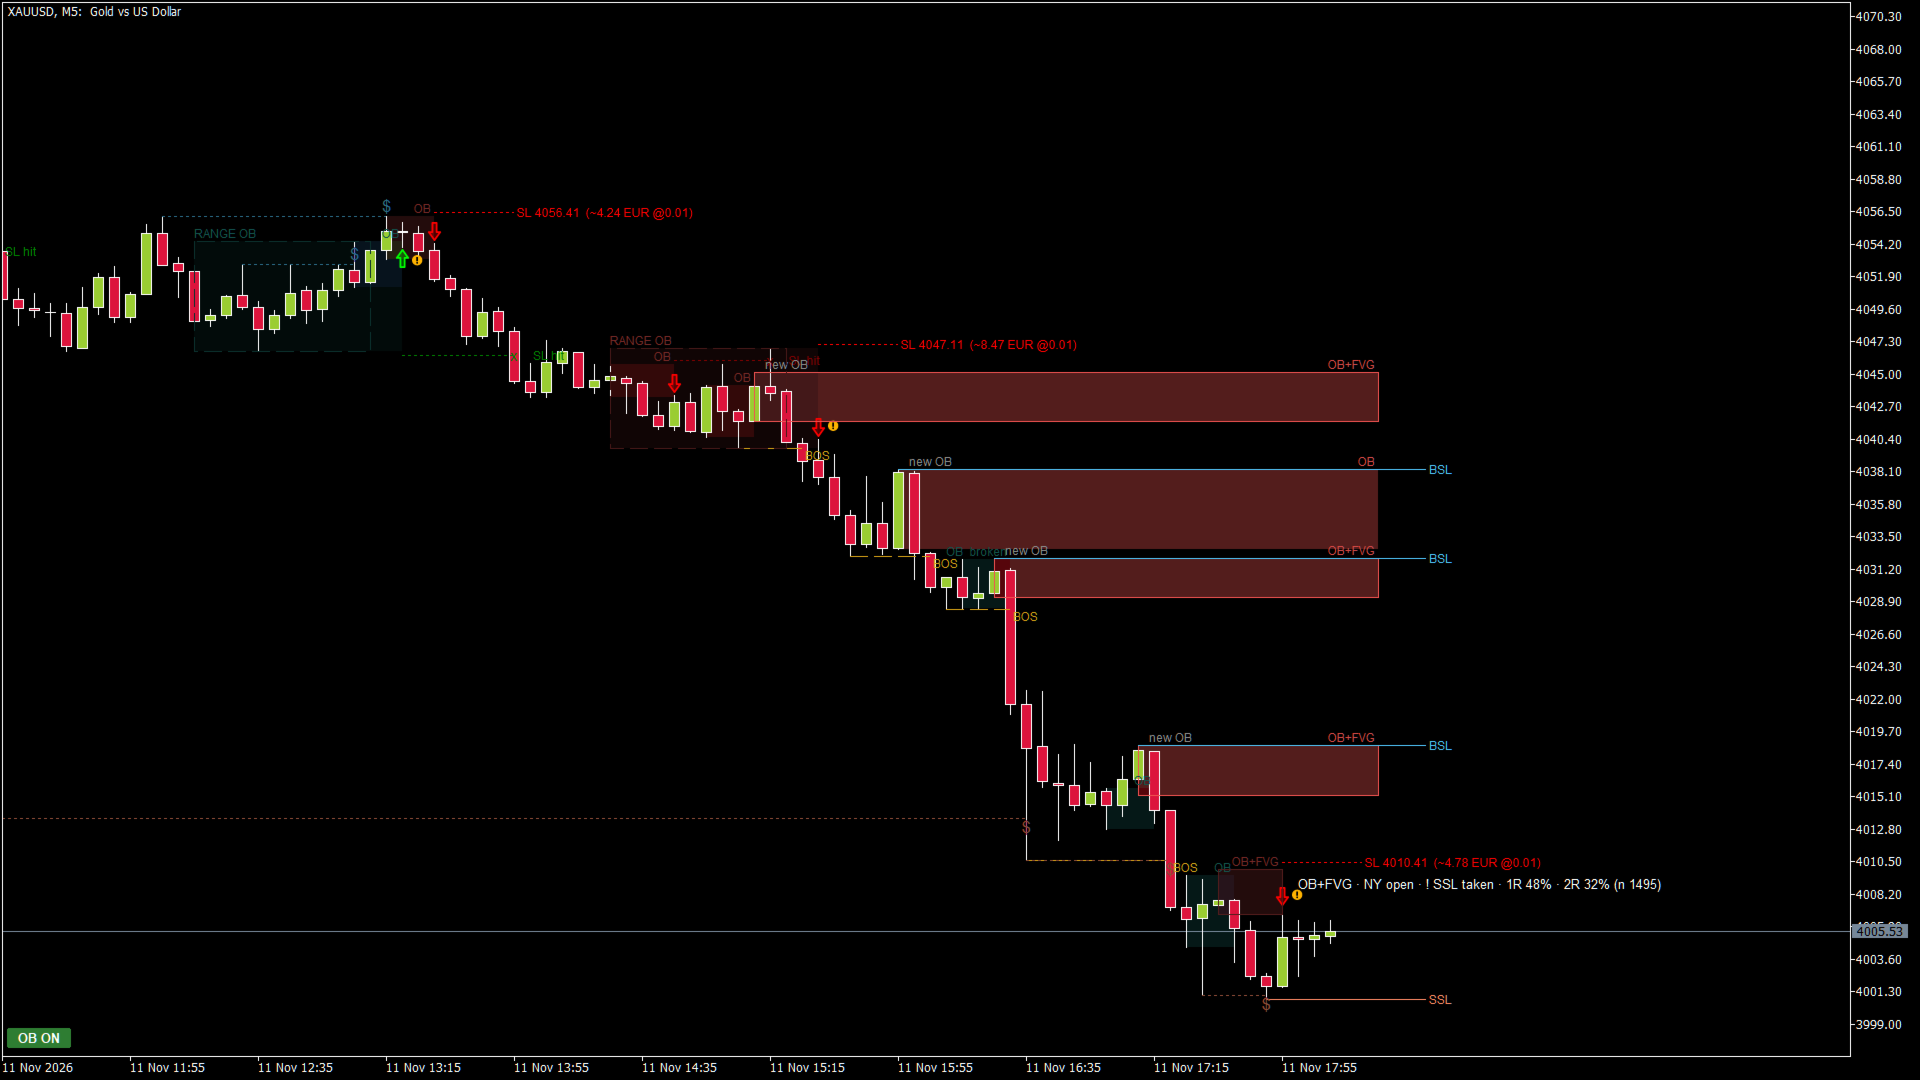
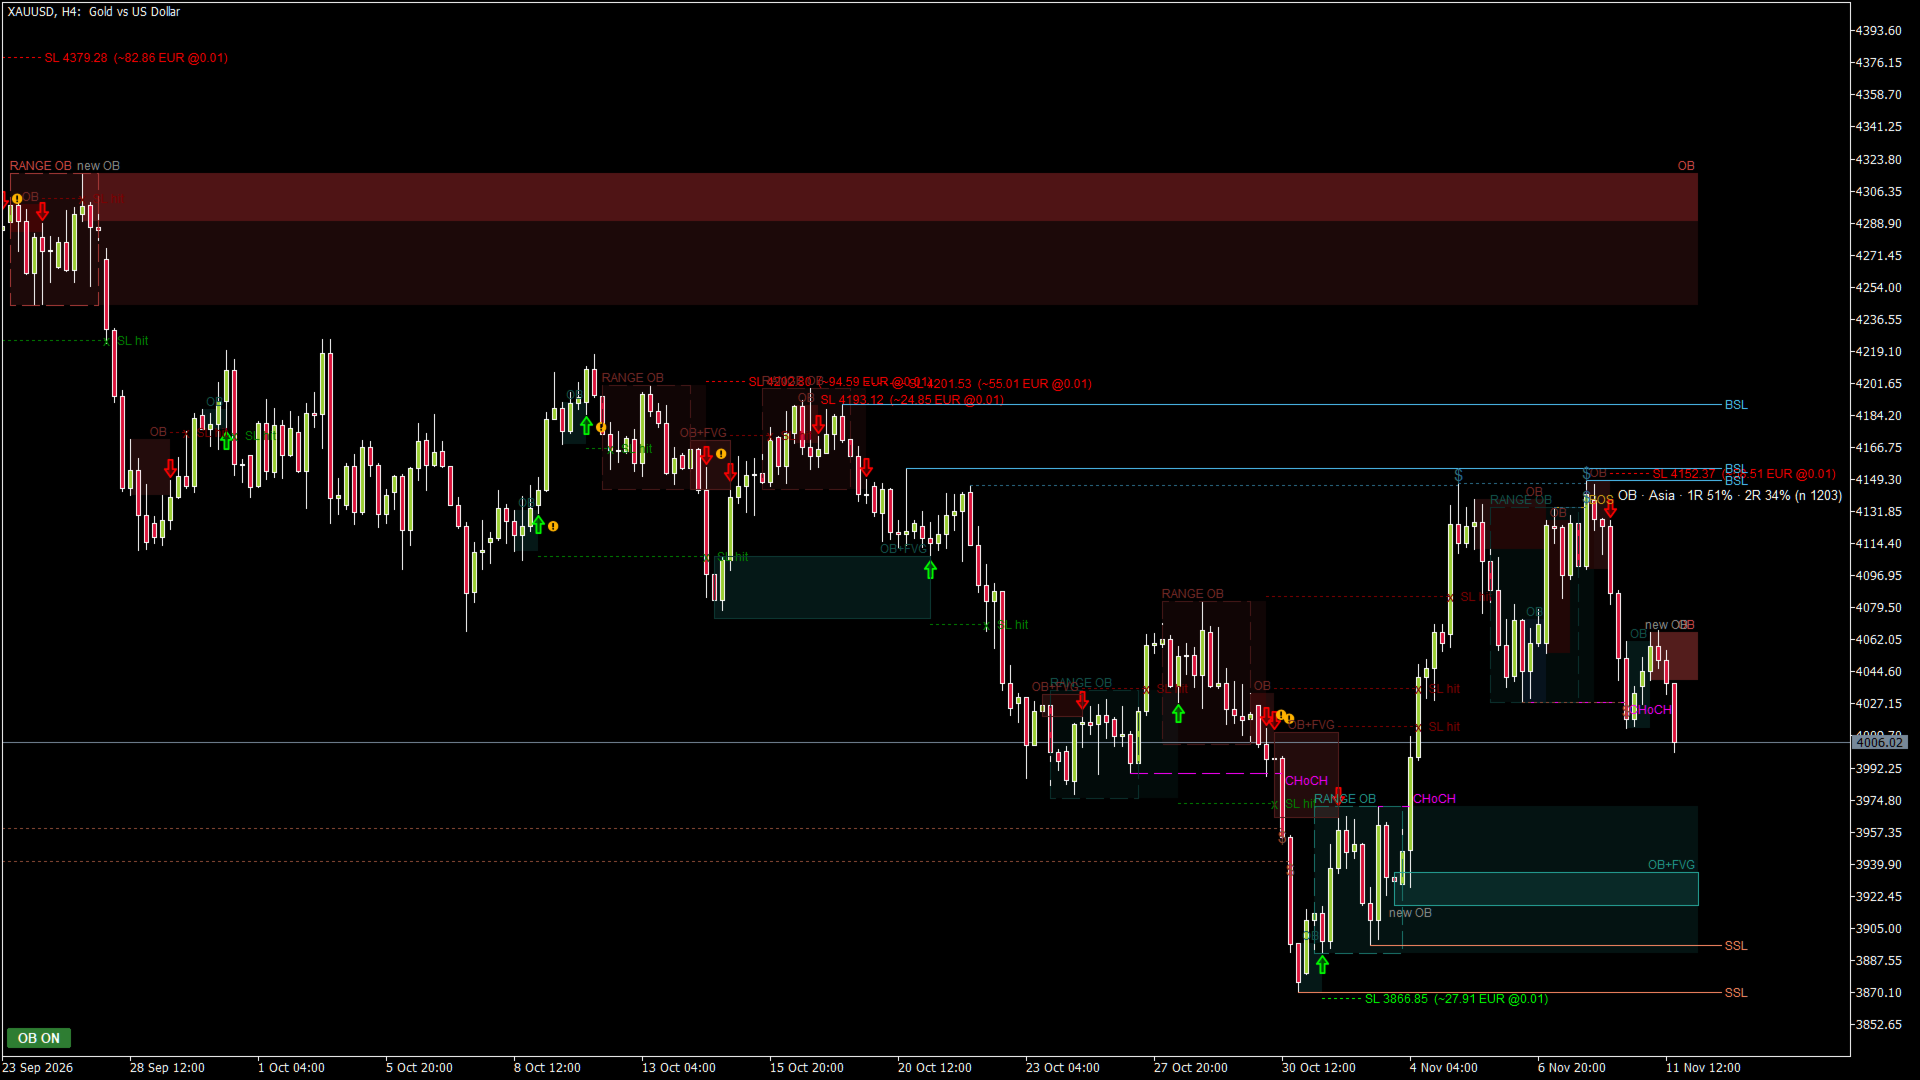
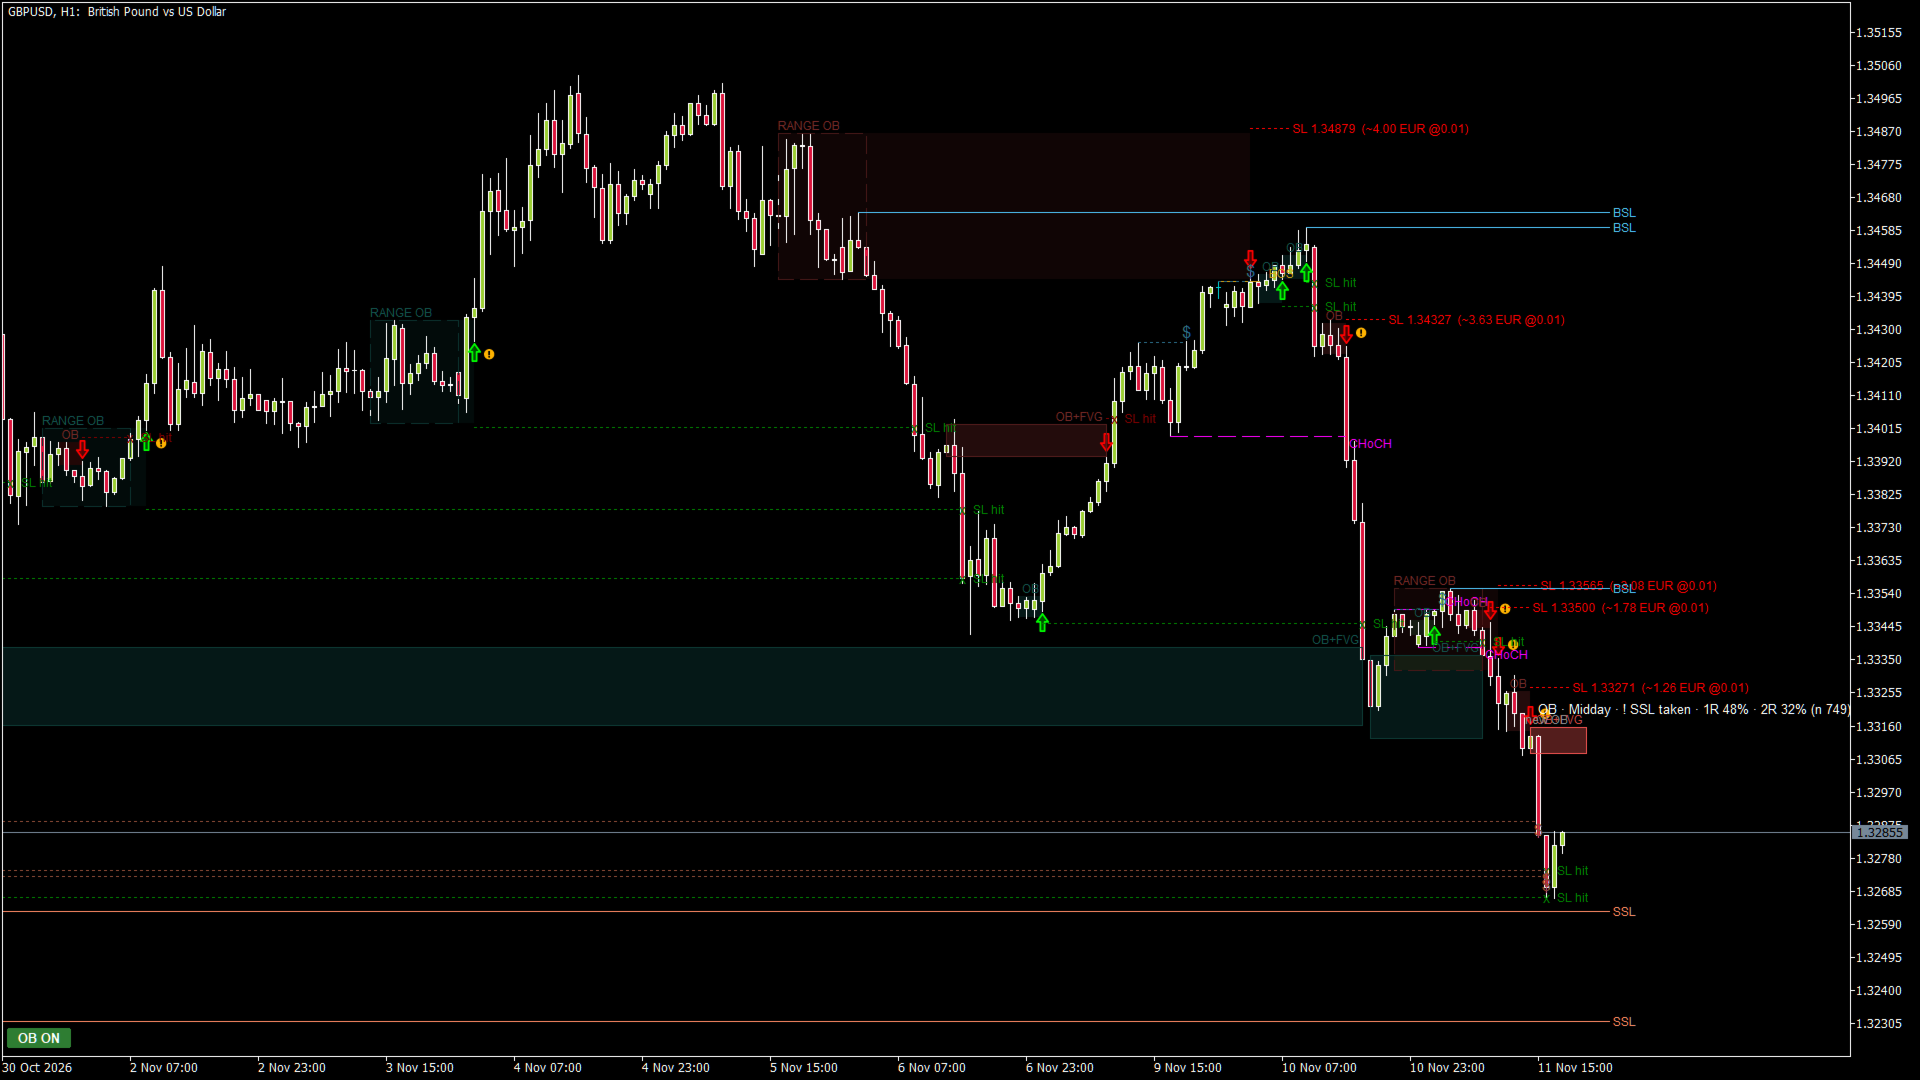
Smart Order Blocks puts the main Smart Money Concepts on one clean chart: order blocks, fair value gaps (FVG), range order blocks, market structure (BOS / CHoCH) and liquidity (BSL / SSL, equal highs / lows, liquidity taken). It gives a signal when price touches a zone and rejects it, and shows how often that type of signal worked in the past ON YOUR CHART.

Nothing is drawn before it happened and nothing repaints: a zone appears only after the candle that confirms it has closed, and a signal only after the rejection candle has closed.

Great for learning Smart Money Concepts: hover the mouse over any zone, arrow or line and a short explanation tells you what it is, why it is there and where the SL would be. You see the concepts on real charts instead of reading about them.

HOW TO USE IT IN 5 STEPS

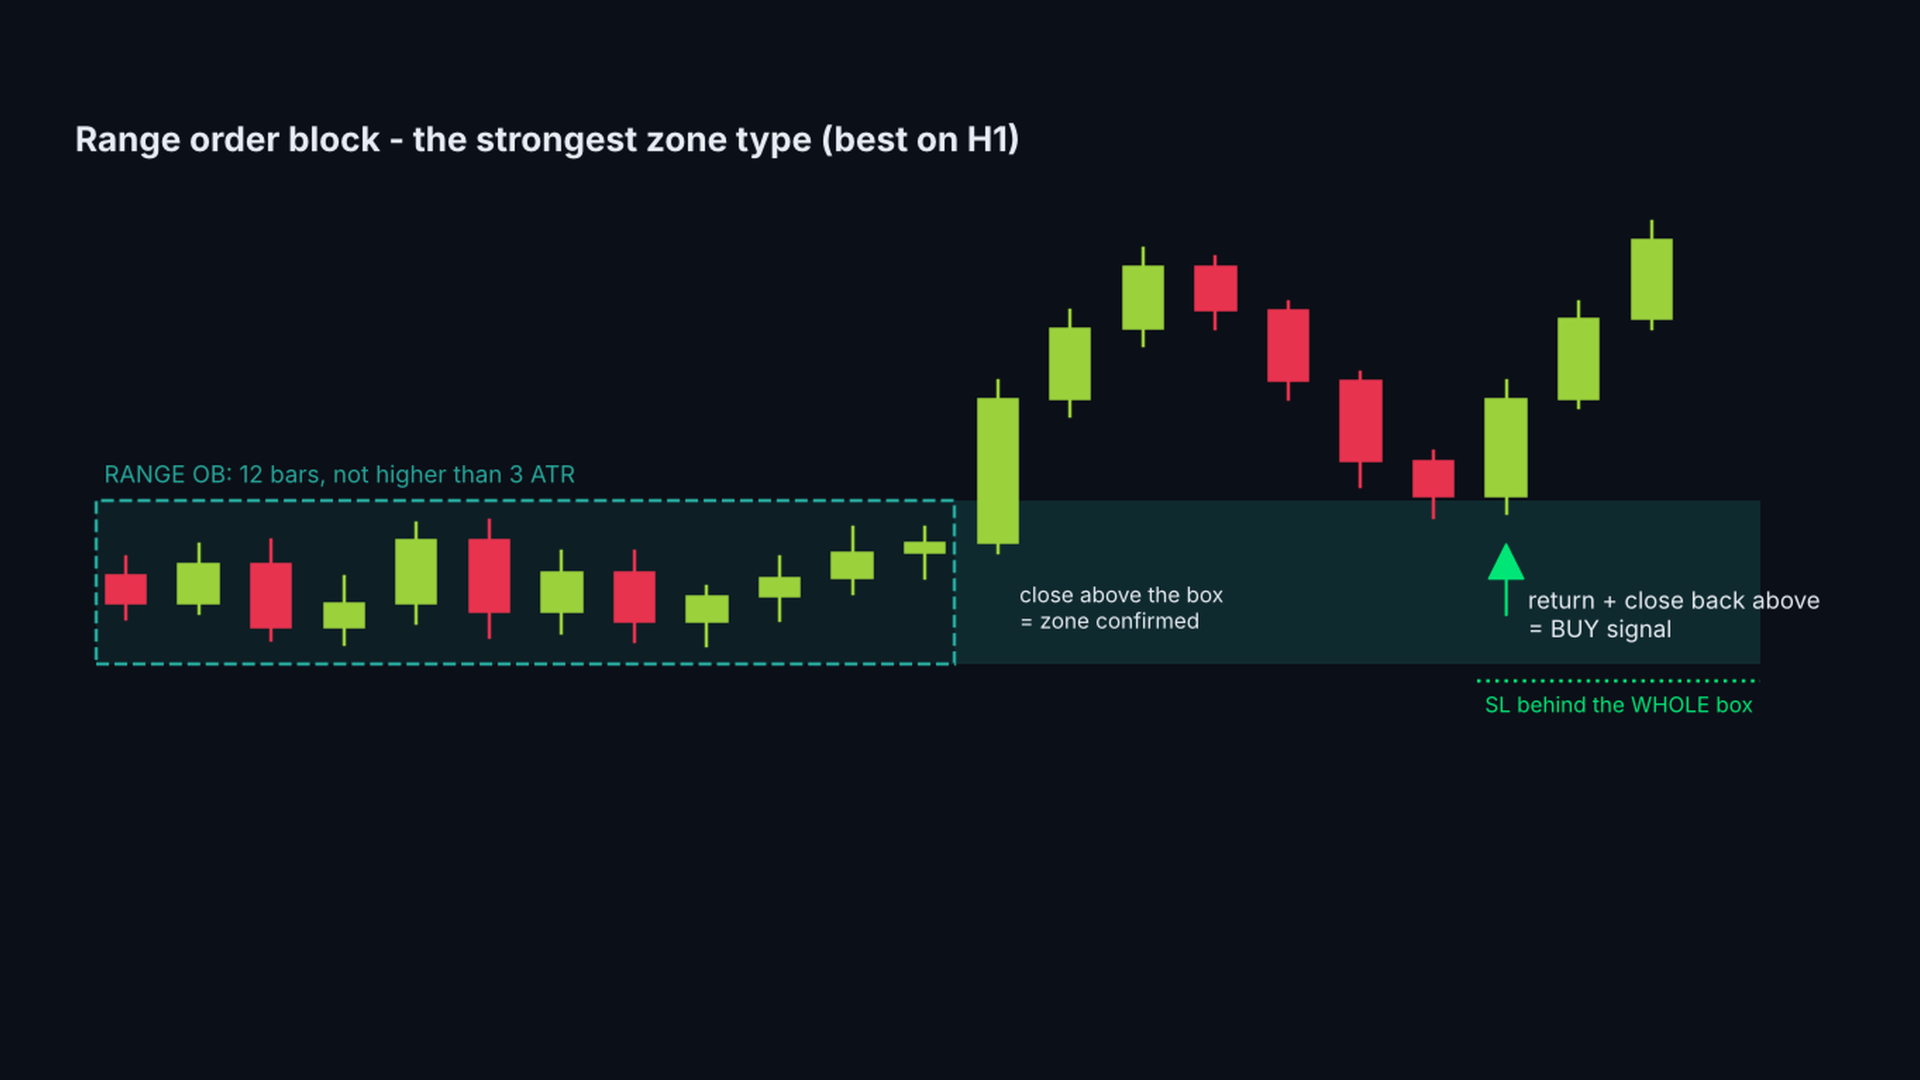
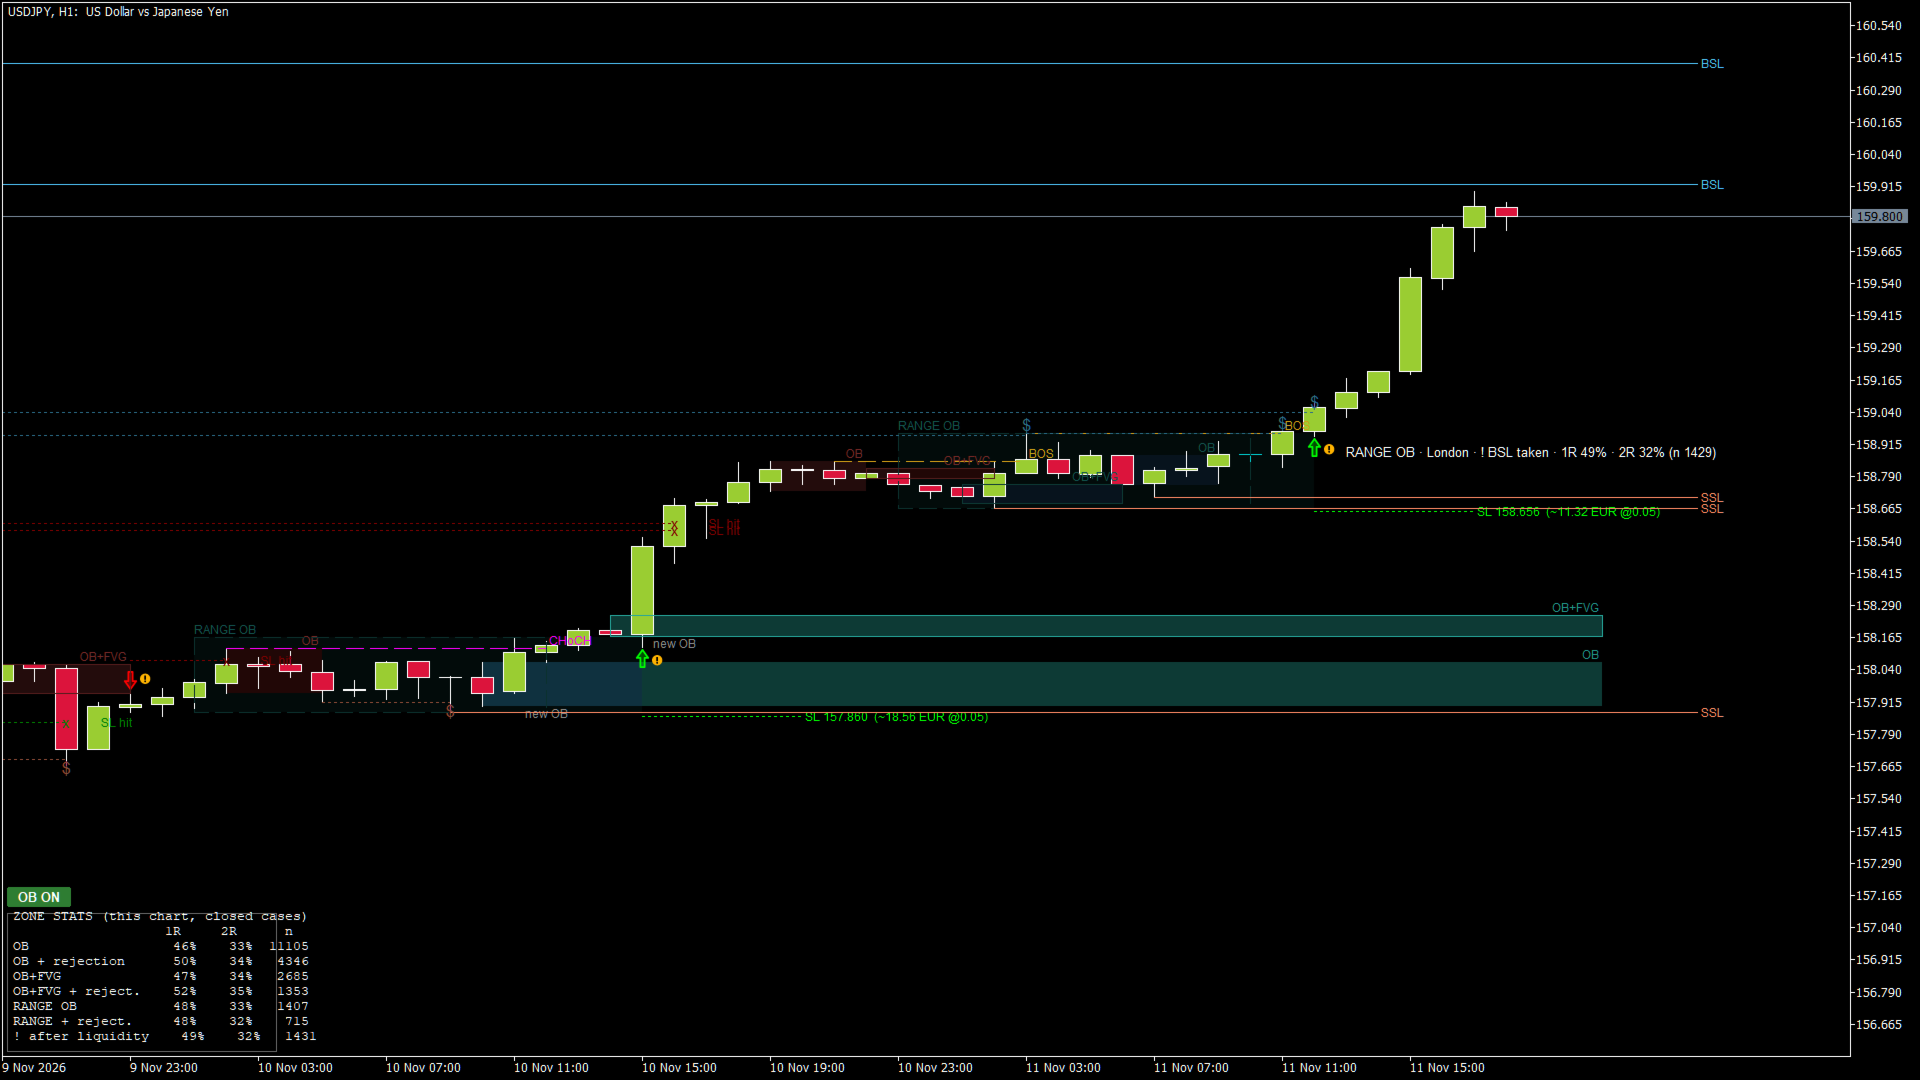
1) Attach it to an H1 chart and look at the zones: green = bullish order blocks (possible support), red = bearish (possible resistance). The light box is a RANGE OB, the strongest zone type.
2) Check the context: BOS / CHoCH show the direction of the structure, BSL / SSL show where stop orders rest above highs and below lows.
3) Wait for an arrow: a candle touched a zone and closed back outside it. The label shows the zone type and how often this type worked on your chart.
4) Use the dotted SL line behind the zone for your stop and size the position from that distance (the label shows the risk in money). Many traders take the entry on M5 / M15 in the direction of the H1 zone.
5) Skip signals marked with "!" and wait when arrows come in both directions within a few candles.

MAIN FEATURES

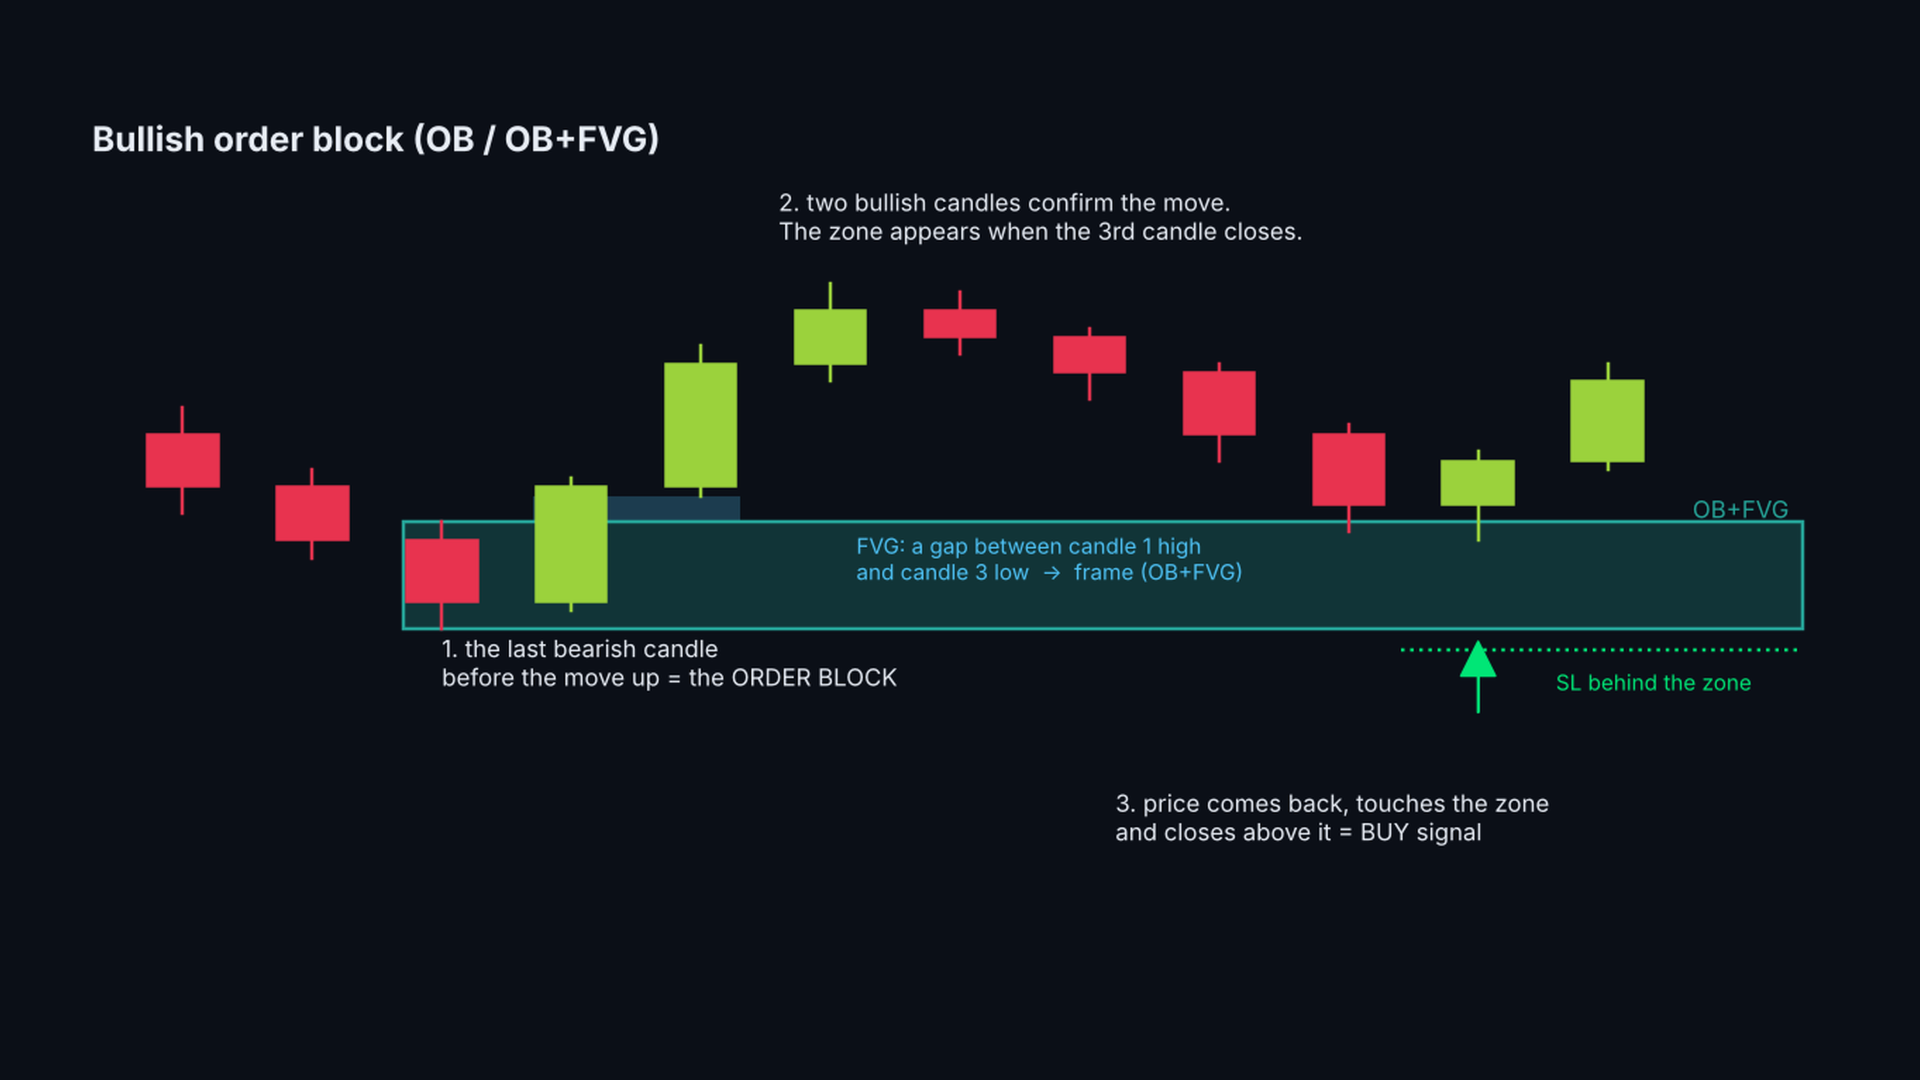
  • Order blocks (OB): the last opposite candle before a move, confirmed when the 3rd candle closes.
  • OB + fair value gap: order blocks whose move left a price gap are marked with a frame.
  • Range order blocks: a consolidation of 12 bars followed by a close beyond it. The whole box is the zone.
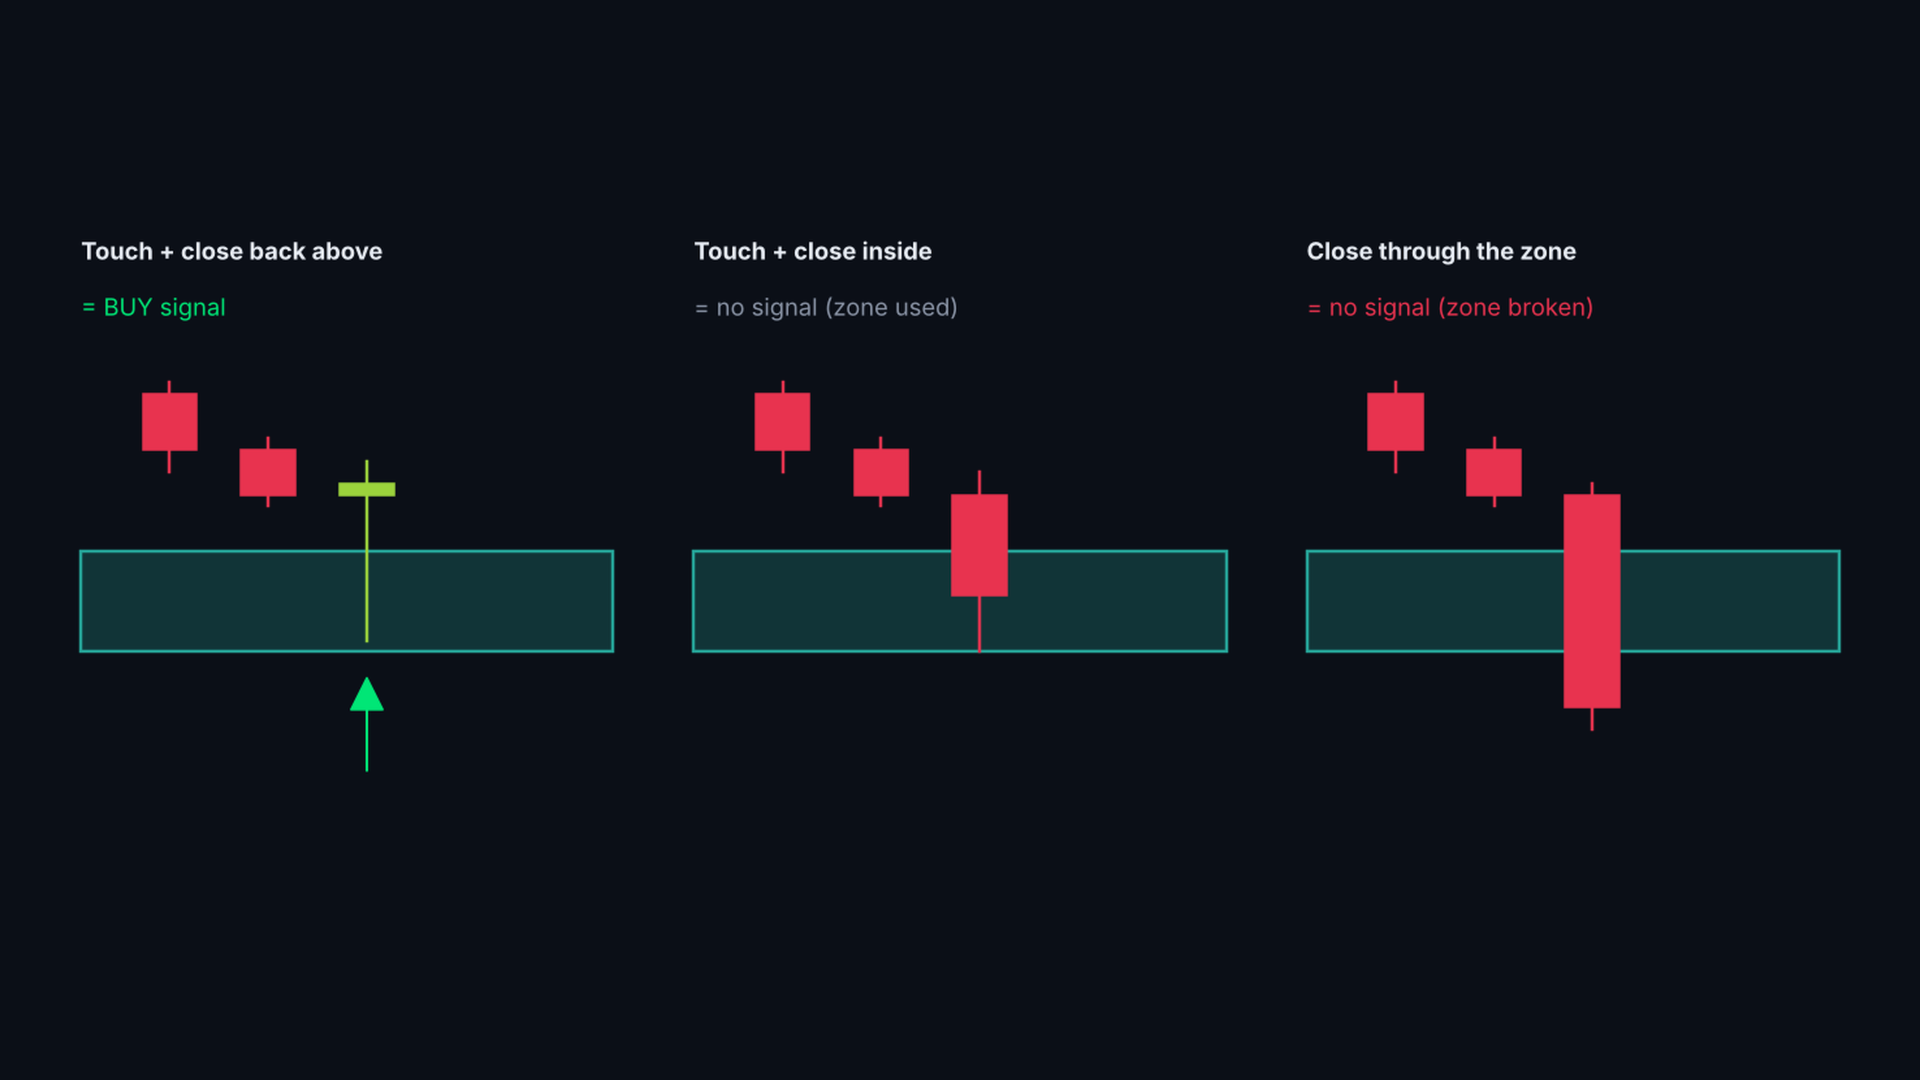
  • Rejection signals: a closed candle that touched an untouched zone and closed back outside it. Arrow + SL line behind the zone.
  • Possible signal: a hollow arrow while the candle is still open and touching a zone. It becomes a signal on the close or disappears.
  • Honest probability: for every signal type the indicator counts how often price reached 1R and 2R before the SL in the past cases on this chart (walk-forward, no look-ahead).
  • Fair value gaps: order blocks whose move left an FVG get a frame (OB+FVG), FVGMinATR sets the minimum gap size.
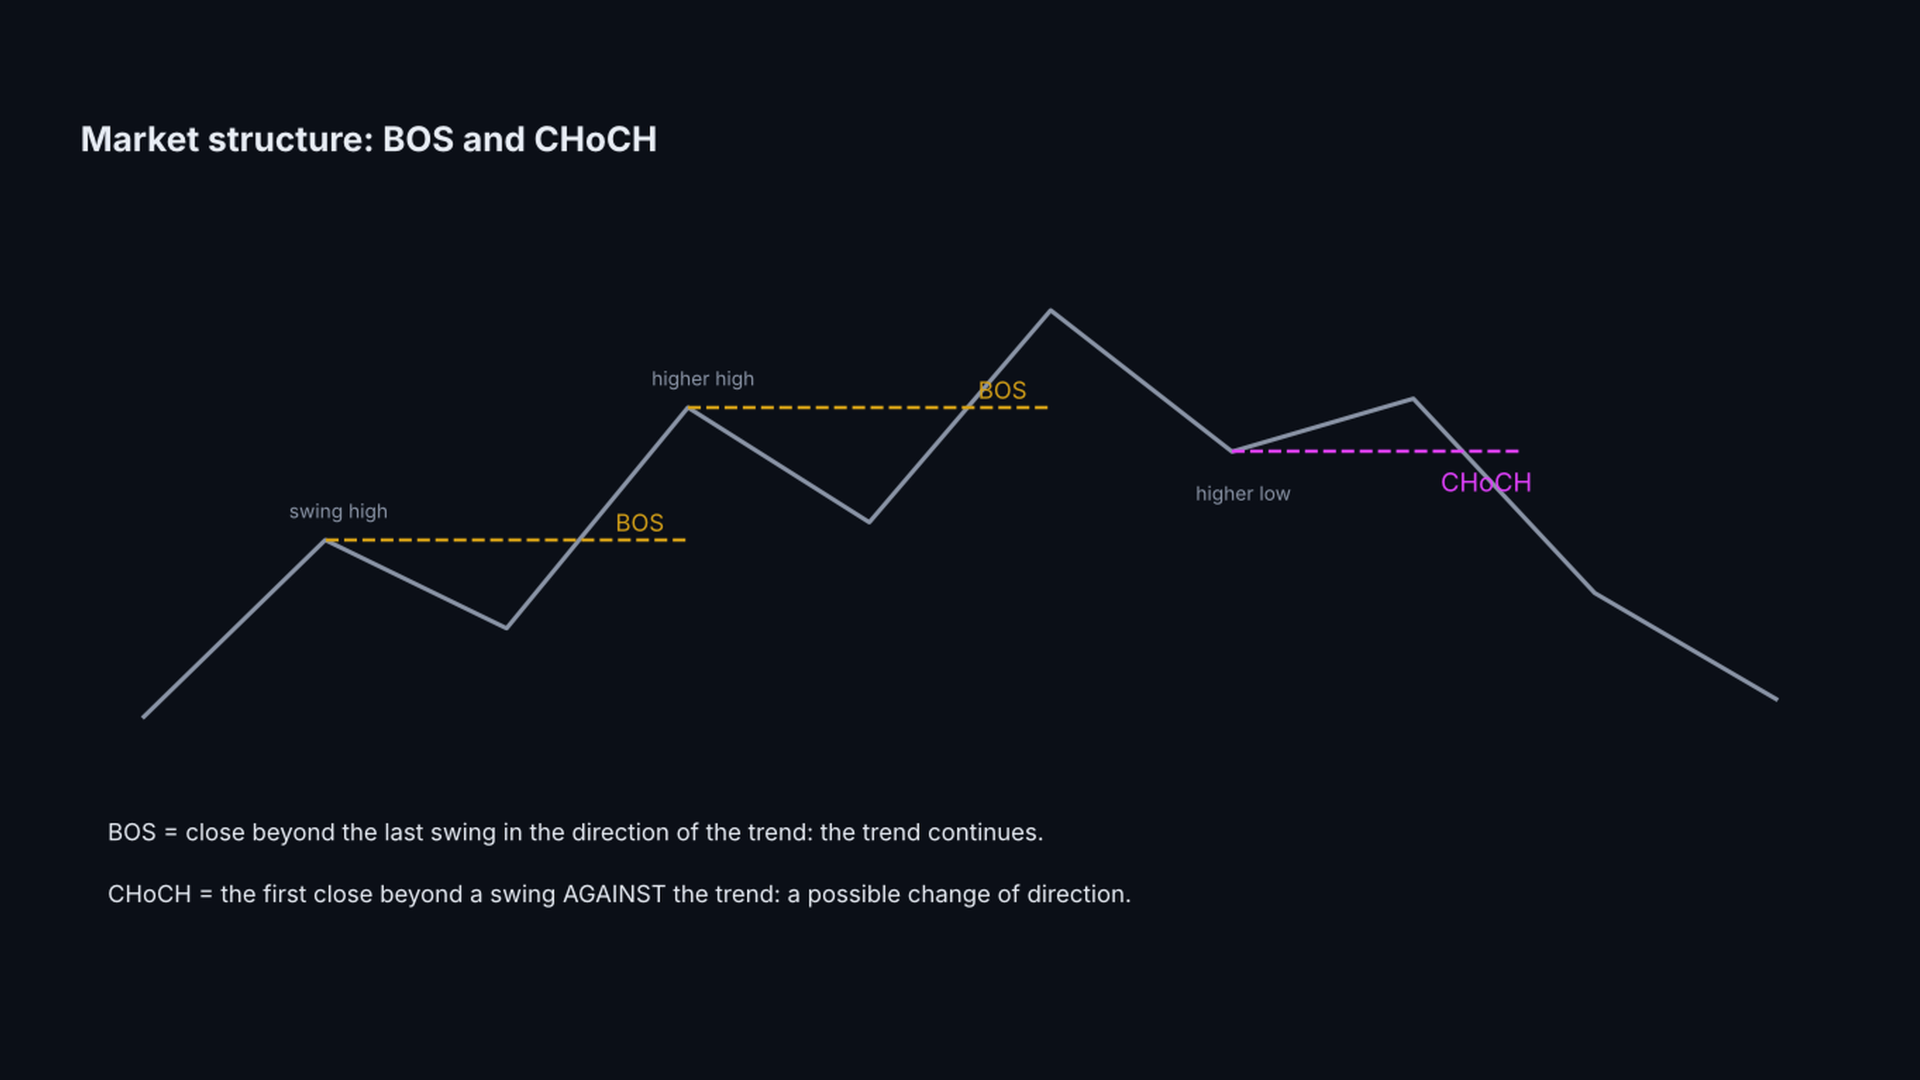
  • Market structure: break of structure (BOS) and change of character (CHoCH) lines.
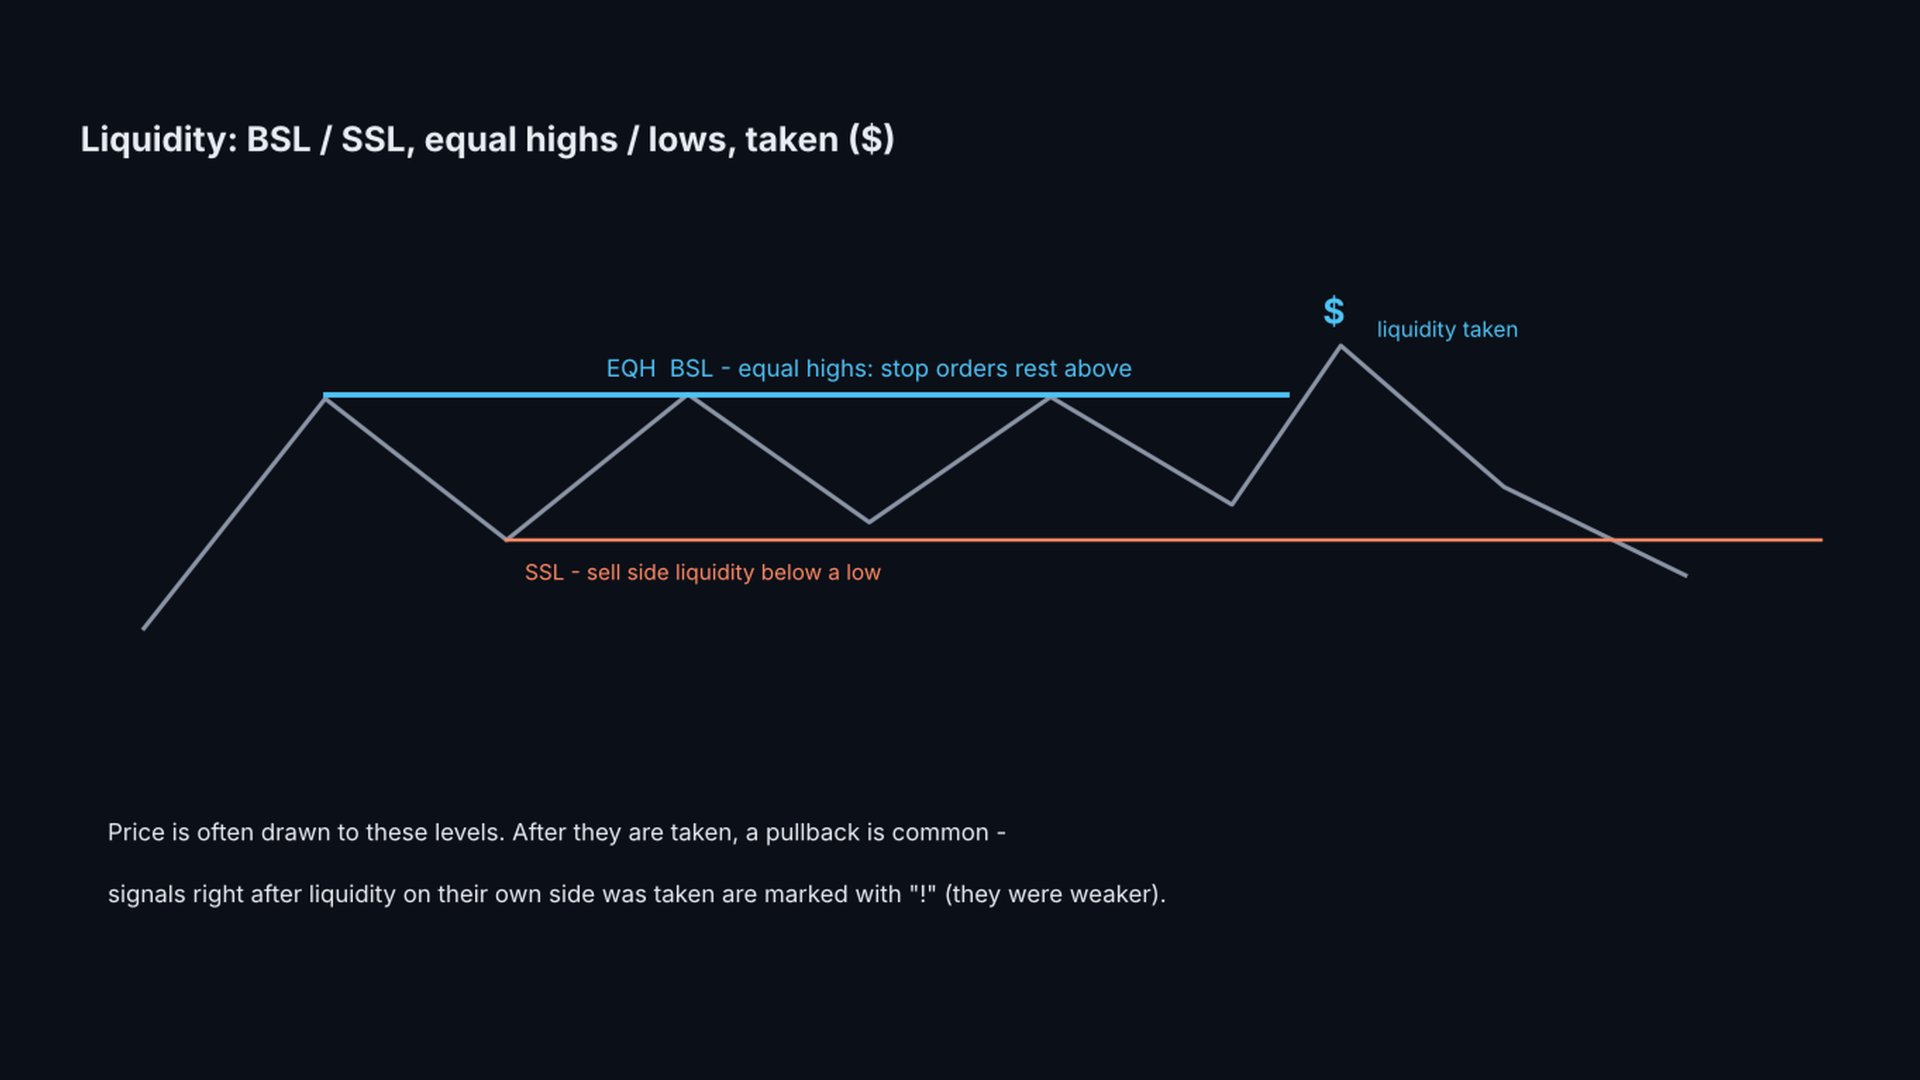
  • Liquidity: resting buy side / sell side liquidity (BSL / SSL), equal highs / lows (EQH / EQL) and where liquidity was taken ($).
  • Caution mark "!" on signals that come right after liquidity on the same side was taken.
  • Hover the mouse over any zone, arrow, line or label: a tooltip explains what it is, with the prices and the SL.
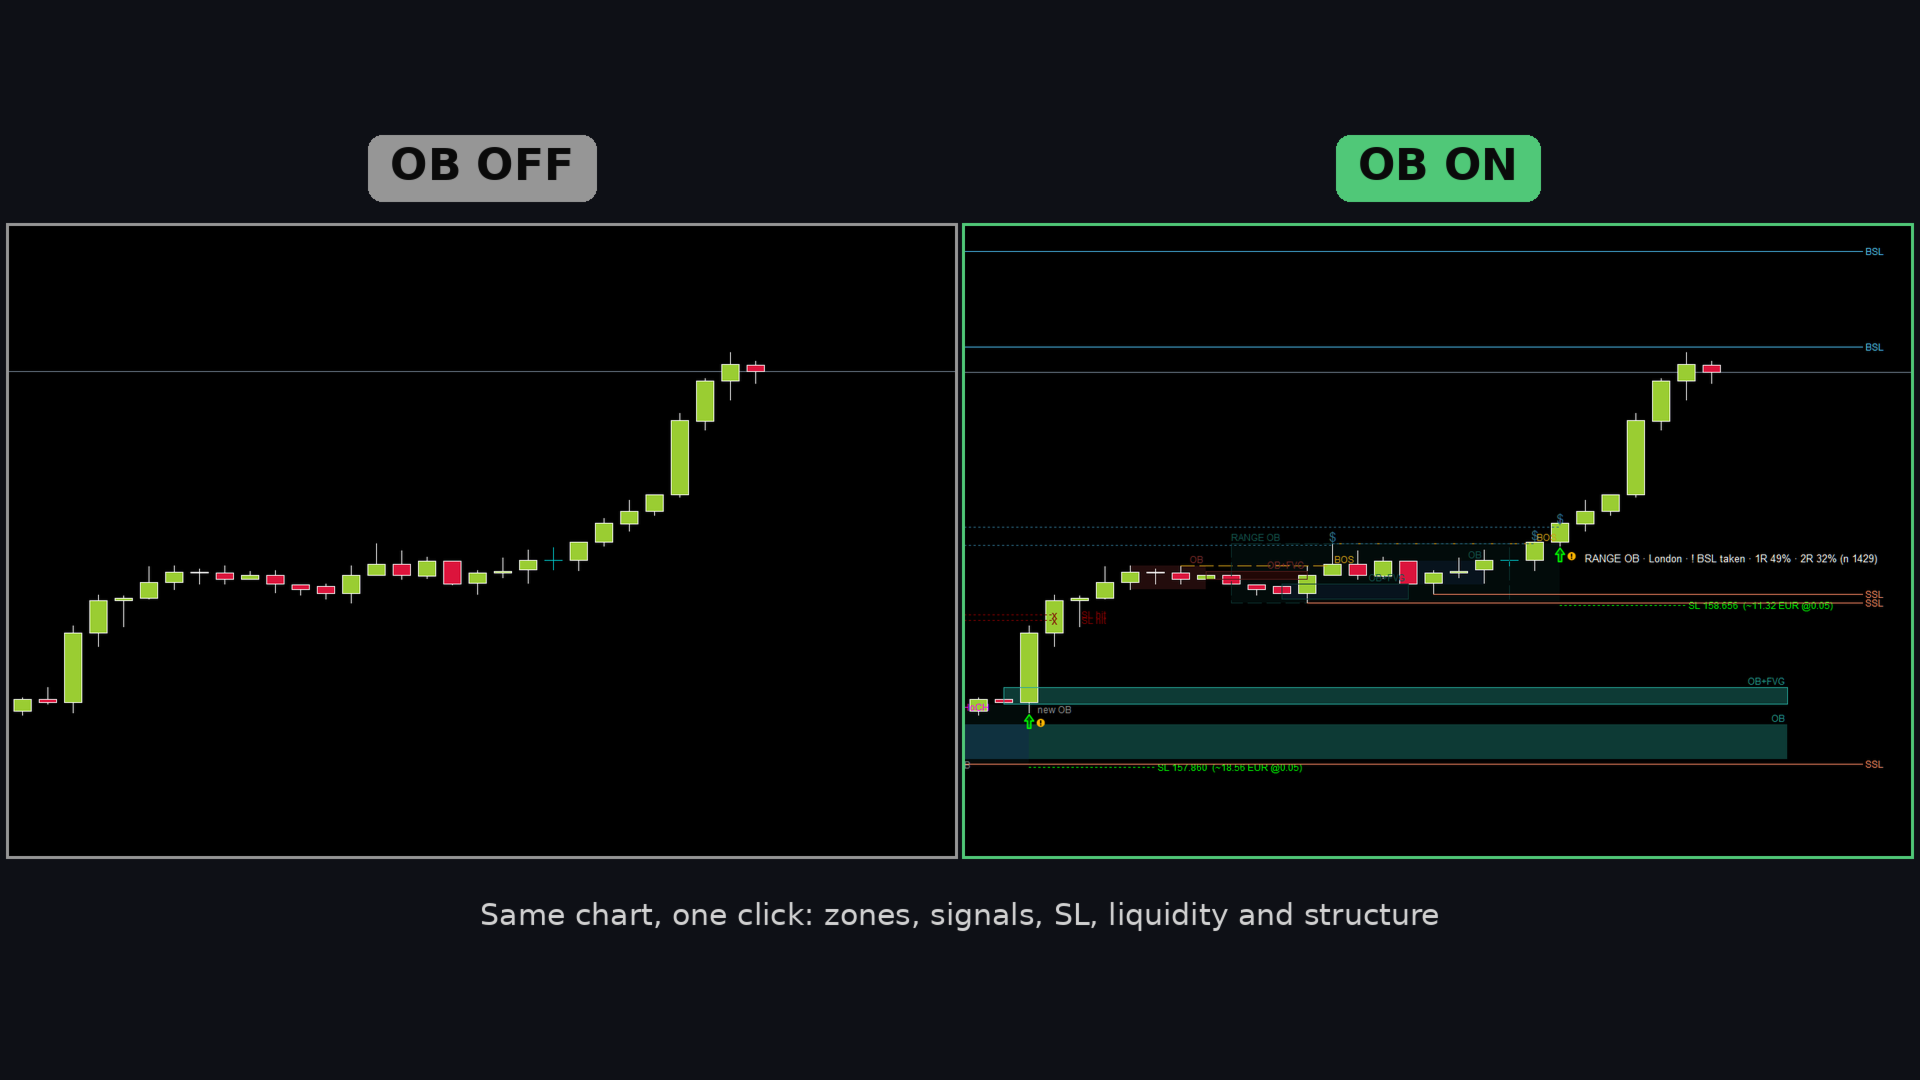
  • "OB ON / OB OFF" button to hide everything with one click. Popup and push alerts.
  • Works on any symbol and timeframe. Light and dark charts (colors adjust automatically).

USER GUIDE

1. QUICK START

1) Attach Smart Order Blocks to a chart. The default settings work on any symbol.
2) Wait a few seconds on the first load: the probability statistics are calculated on up to 50 000 bars (StatsBars).
3) Hover the mouse over anything that is drawn to read what it is.
4) For push notifications: Tools > Options > Notifications in MetaTrader 5, enter your MetaQuotes ID and enable push notifications.

2. THE ZONES

  • Bullish OB (green): the last bearish candle before a move up. Bearish OB (red): the last bullish candle before a move down.
  • An OB is shown only when the move is confirmed: the 2 candles after it move in the same direction and the 3rd candle has closed.
  • OB+FVG (with a frame): the move left a fair value gap (a gap between candle 1 and candle 3).
  • RANGE OB (very light box with a dashed frame): a consolidation of RangeBars bars not higher than RangeMaxATR x ATR, then a close beyond it.
  • States: untouched (normal color), used = already touched (faded), broken = price closed through it ("broken").
  • An untouched zone expires after ZoneMaxBars bars.
  • "new OB" marks the candle that confirmed a zone.

3. THE SIGNALS

  • BUY: a closed candle touched an untouched bullish zone and closed back above it. SELL: the mirror case.
  • The arrow is final after the close. The label shows the zone type, the session and the probability, for example:

  "RANGE OB · London · 1R 55% · 2R 37% (n 120)".

  • SL line: a short dotted line behind the zone (+ SLBufferATR x ATR) with the risk in money, for example "SL 152.569 (~11.40 USD @0.01 lot)". If the SL is hit later, the line is faded, runs to the candle that hit it and shows "x SL hit".
  • SLMode: behind the whole zone (default), behind the middle of the zone, or behind the zone but max SLMaxATR x ATR from its edge. In our tests the stop behind the whole zone was the best on every timeframe; smaller stops were hit more often and were weaker in R.
  • Hollow arrow = possible signal on the open candle. About 1 in 3 becomes a signal. Useful on lower timeframes to look at the chart before the close.
  • SkipInsideRange: no OB signal while the signal candle is still inside a consolidation.
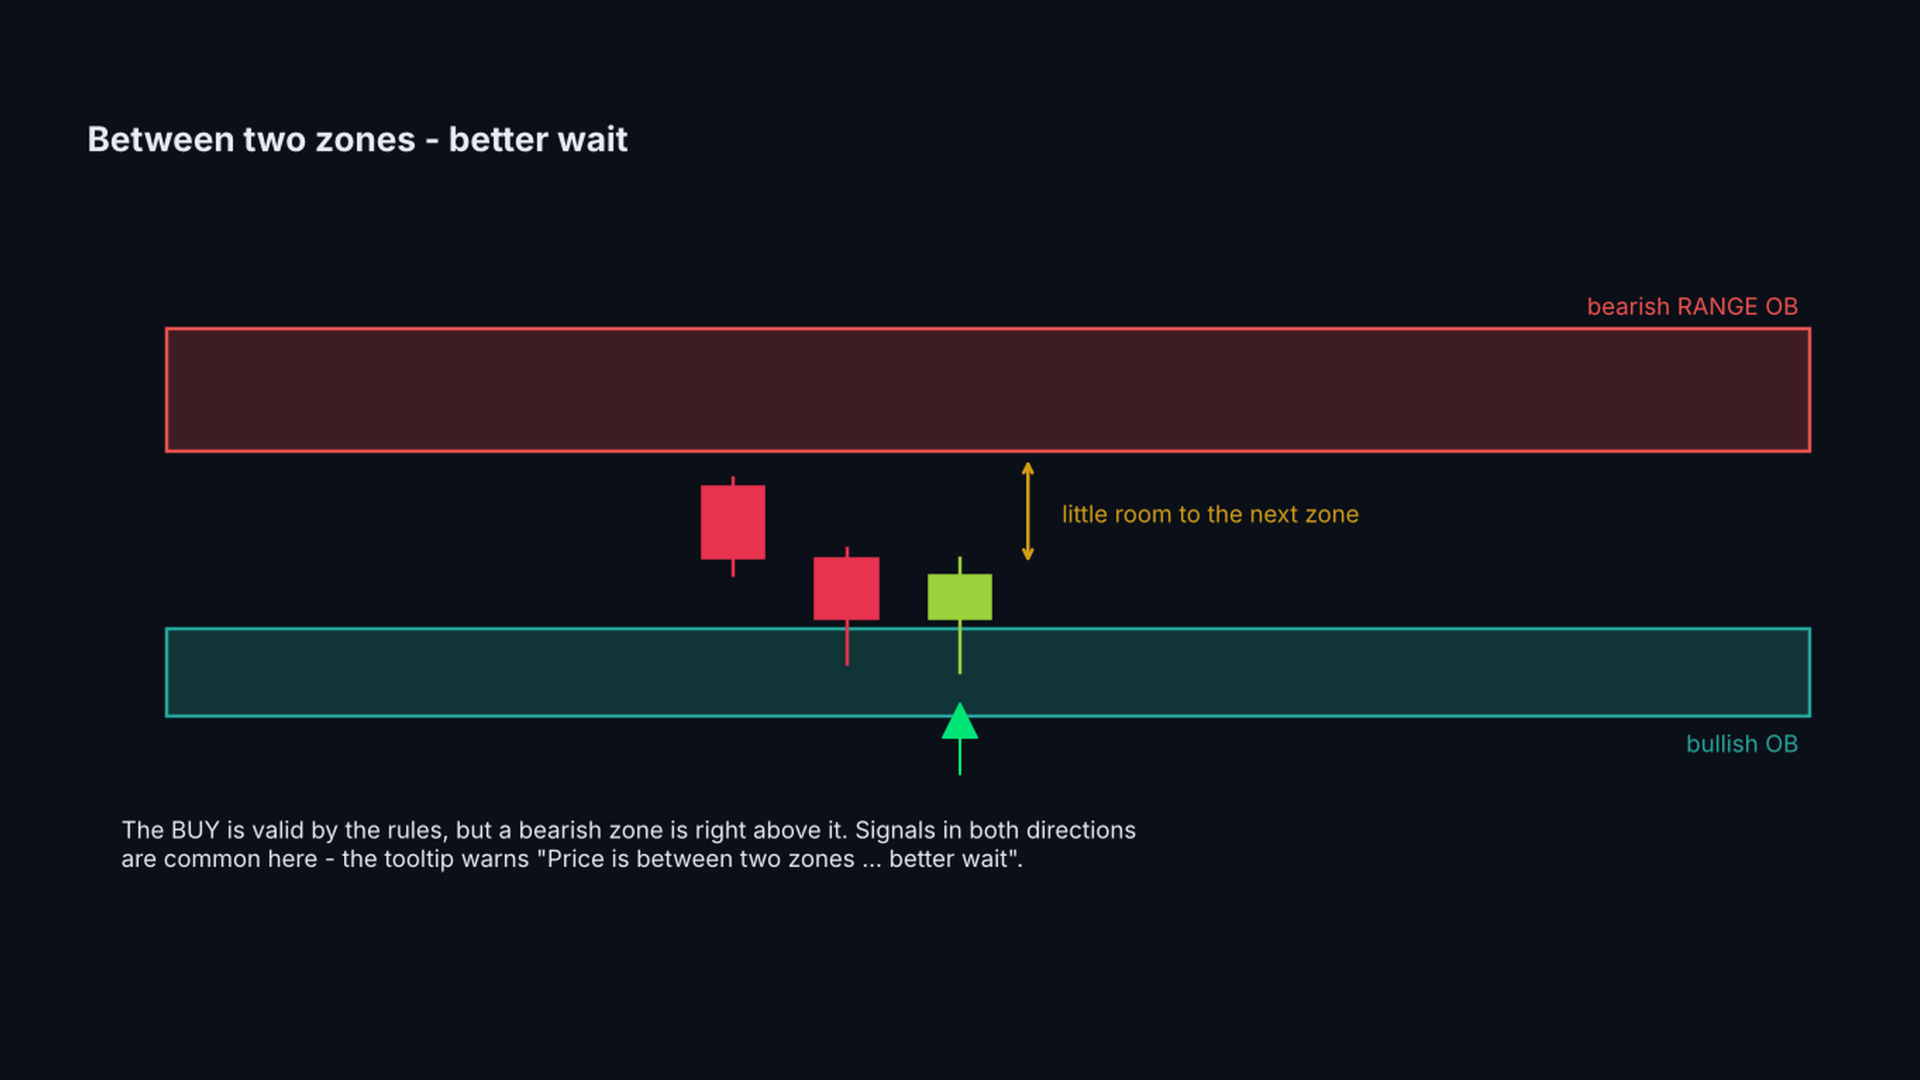
  • The tooltip of every arrow names the zone it comes from (for example "BULLISH OB 4010.30 - 4025.10"). If a zone in the opposite direction is right in front of the signal, the tooltip says "Price is between two zones ... better wait". This happens often: a buy from a green zone just under a red zone is a valid signal by the rules, but the price has little room.
  • The tooltip of every arrow says whether the signal is with or AGAINST the market structure (last BOS / CHoCH). Signals against the structure were not worse on average in our tests, so they are shown by default; HideAgainstStructure hides them if you prefer.
  • Waiting for a confirmation on a lower timeframe (for example a BOS on M5 after an H1 signal) did not help in our tests: the confirmed signals were the good ones, but by the time of the confirmation the price had already moved and the later entry gave the advantage back.

4. THE PROBABILITY - WHAT IT MEANS

  • For every closed past case of the same type (OB, OB+FVG, RANGE OB, with or without rejection, after liquidity taken) the indicator checks what came first: 1R / 2R or the SL.
  • 1R = the SL distance, 2R = twice the SL distance. n = number of past cases. With fewer than MinCases cases it shows "not enough data".
  • It is calculated walk-forward: each case uses only what was known at that time. It is a description of the past on this symbol and timeframe, not a prediction.
  • Use it to compare: which zone types and timeframes have worked better on the symbol you trade.

5. FVG, STRUCTURE AND LIQUIDITY - THE CONTEXT

These show what just happened on the chart. In our tests they did not make the signals better on their own, so use them as context, not as filters:

  • FVG: a gap between candle 1 and candle 3 of a strong move. An OB with an FVG is drawn with a frame (OB+FVG).
  • BOS: a close beyond the last swing high / low in the direction of the structure - the trend continues.
  • CHoCH: the first close beyond a swing against the previous structure - a possible trend change.
  • BSL / SSL: untaken swing highs / lows where stop orders rest. EQH / EQL = equal highs / lows (thicker line).
  • Taken liquidity: a dotted faded line and "$" where price went beyond the level.
  • "!" next to an arrow: liquidity on the same side was taken on the signal candle or the candles before it (LiqCautionBars). In our tests these signals were weaker.

6. A PRACTICAL WAY TO USE IT

This is a tool for manual trading, not a system that takes every arrow. What we found when we developed it (XAUUSD, H1 2020-2026, M5 / M15 2025-2026, costs included):

  • Order block zones are real levels: price reacted from them clearly more often than from random candles, in every year we tested. Use them for where to look, where to put the stop and where to take profit.
  • Waiting for the rejection close was better than entering at the first touch.
  • RANGE OB on H1 was the strongest signal type. Many traders use H1 for the zones and the direction and a lower timeframe (M5 / M15) for the entry.
  • All signals together are only about breakeven after costs. Taking every arrow is not a strategy.
  • When signals come in both directions within a few candles, price is between two zones: better wait.
  • Signals with "!" (right after liquidity on the same side was taken) were weaker.

Past results do not guarantee future results. Check the probability on your own symbol and timeframe, and test on a demo account first.

7. RISK

  • The SL is behind the zone: typically about 1.3 ATR for an OB and about 3 ATR for a RANGE OB. On D1 / H4 this is a large distance in price, but it is normal for the timeframe - an H1 stop is many times smaller in price.
  • Size the position from the SL distance, not from a fixed lot: the tooltip and the SL label show the distance in price, in ATR and in money for MoneyLot (0.01 by default). Keep the money at risk the same on every timeframe.
  • Two or three losses in a row are normal with any setup that wins about half of the time.

8. RISK : REWARD - THE MATH

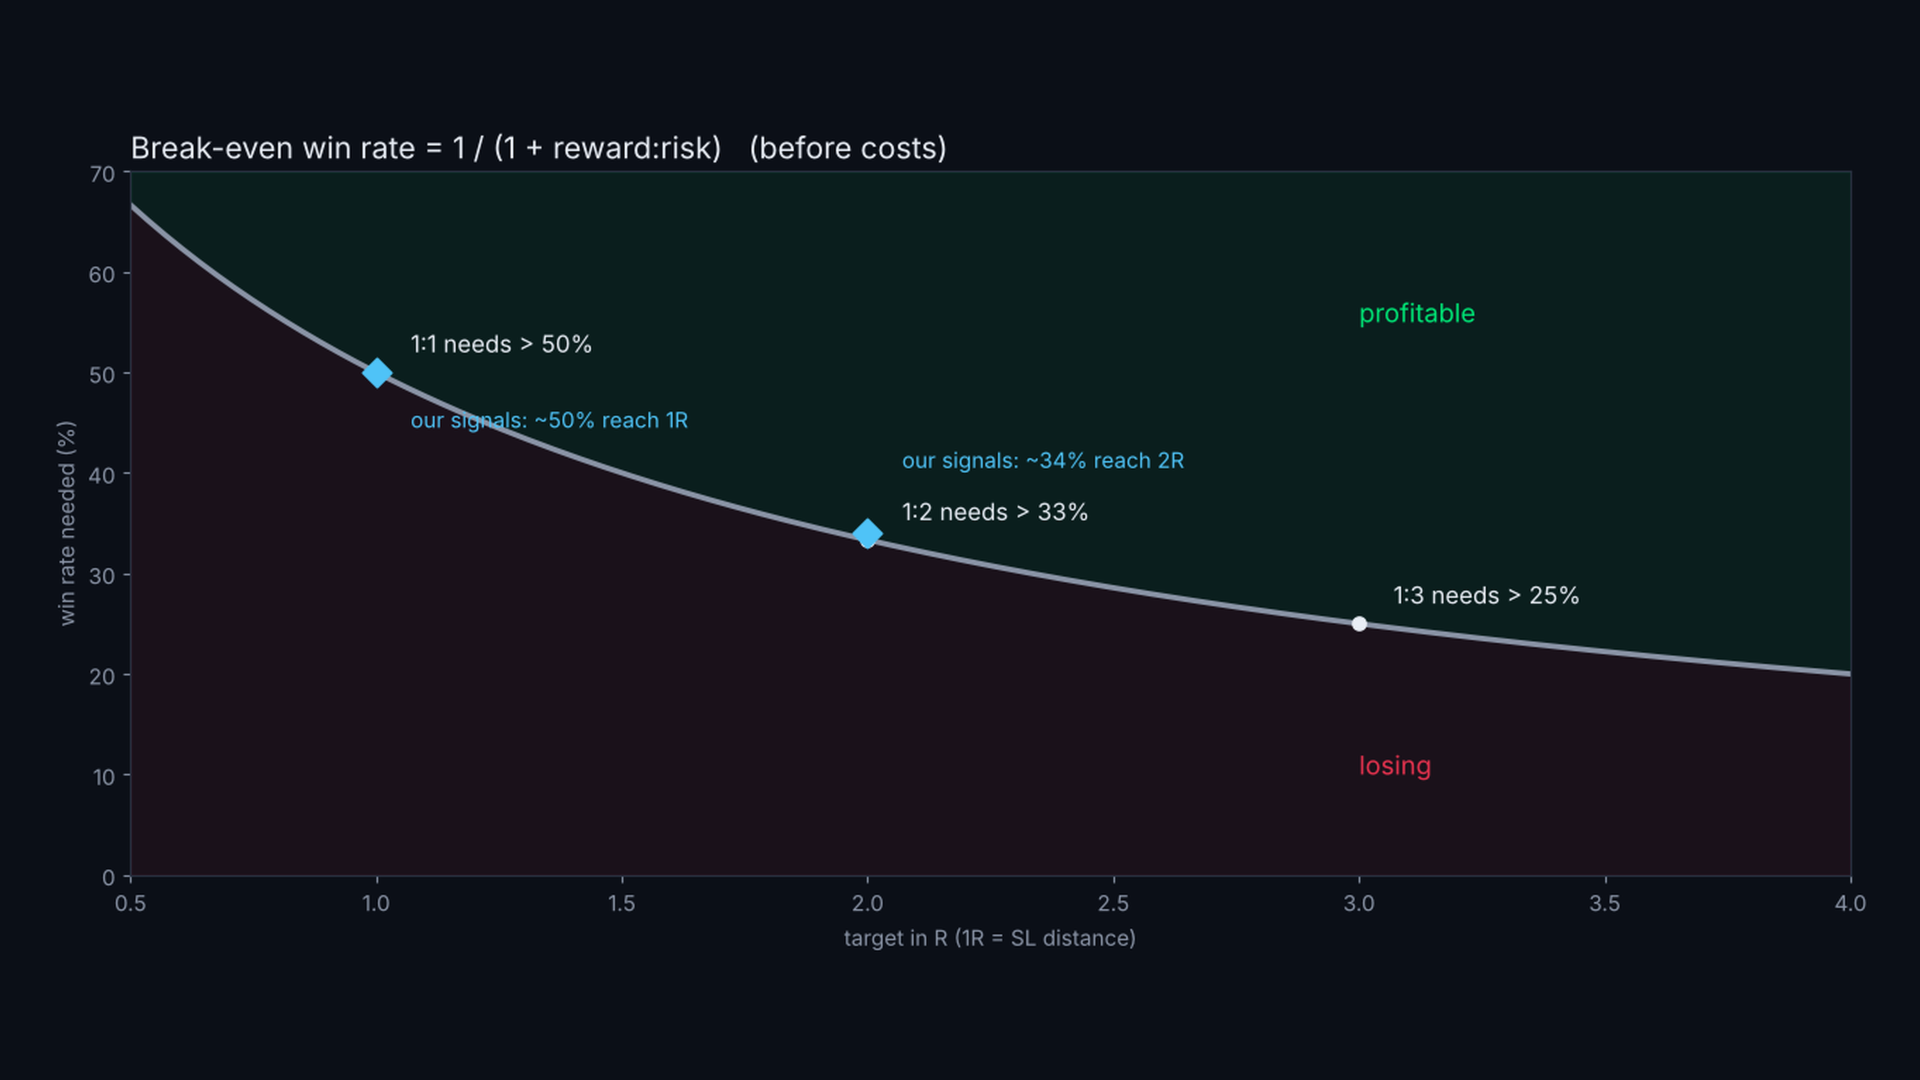
With a fixed target, a setup is profitable only if it wins more often than this (before costs):

  • 1:1 (target = 1 x SL distance): more than 50% of the trades
  • 1:2: more than 33%
  • 1:3: more than 25%

The signals of this indicator reached 1R in about 50% and 2R in about 34% of the cases in our tests - that is about breakeven with a 1:1 or 1:2 target once spread and commission are paid. So:

  • Do not use small targets. Aim for at least 1:2, better 1:3, and let the trade reach the next zone or liquidity level.
  • In our tests the best results came from RANGE OB on H1 (positive at 1:2 and 1:3) and from the higher timeframes (D1). Plain OB signals on M5 were negative at every target.
  • The probability in the label (1R % / 2R %) tells you which targets made sense on your symbol and timeframe: if 2R % is clearly above 33%, a 1:2 target has worked there.

9. FAQ

  • Does it repaint? No. Zones appear after the confirming candle closes, signals after the rejection candle closes. Only the hollow "possible" arrow on the open candle can disappear.
  • Why does the first load take a few seconds? The statistics are calculated on StatsBars bars. Reduce StatsBars for a faster start.
  • Why "not enough data"? There are fewer than MinCases past cases of this type on the chart. Load more history or use a lower timeframe.
  • The session names (Asia, London, NY) use the server time GMT+2 / GMT+3 that most brokers use.
  • Should I close the trade on a CHoCH against it? In our tests this did not help: it cut as many winning trades as losing ones. Use BOS / CHoCH as context.
  • What does the button do? It hides / shows everything the indicator draws. Signals, statistics and alerts keep working.

INPUT PARAMETERS

Order blocks

  • ShowZones, FVGMinATR (min gap size for OB+FVG), ZoneMaxBars (expiry), MaxZonesShown, UsedZonesShown, zone colors and transparency, FrameWidth, ZoneLabels, ShowNewOBMark.

Range order blocks

  • ShowRangeOB, RangeBars (12), RangeMaxATR (3.0), RangeZonesShown, colors, RangeTransparency, SkipInsideRange, HideAgainstStructure (off: hide signals against the last BOS / CHoCH; in tests this gave fewer signals, not better ones).

Signals

  • ShowSignals, SignalsShown (10), BuyColor, SellColor, ArrowSize, ShowSL, SLMode, SLMaxATR (1.5), SLBufferATR (0.1), MoneyLot (0.01), SLLineBars, SLWidth, ShowSignalLabel, LabelsShown, MarkAfterLiquidity, LiqCautionBars, CautionColor, ShowPossible, PossibleColor, PossibleBlink.

Probability

  • ShowProbability, MinCases (30), MaxHoldBars (300), ShowPanel (statistics panel), ShowButton, PanelFontSize.

Structure

  • ShowBOS, ShowCHoCH, PivotBars (3), colors, style, width, StructShown.

Liquidity

  • ShowLiquidity, LiqLevels, EqualTolATR, BSLColor, SSLColor, styles and widths, ShowTaken, TakenShown.

General

  • HistoryBars (objects only for the last N bars), StatsBars (statistics on the last N bars), TextColor (None = automatic).

Alerts

  • AlertPopup, AlertPush, AlertSignal, AlertPossible, AlertCancel, AlertNewOB, AlertTouch, AlertLiquidity.

IMPORTANT

Smart Order Blocks is an analysis tool. It does not open trades. The probabilities describe the past on your chart; they are not a promise for the future. The decision, the stop and the position size are yours.
Prodotti consigliati
Contraction Expansion Meter A clear and powerful volatility indicator that visualizes market contraction and expansion in real time. Based on Bollinger Bands logic, the indicator measures the relative width of the bands and compares it to its own moving average. This creates a highly intuitive oscillator that shows when the market is compressing (contraction / squeeze) or expanding (volatility breakout). What you see on the chart: Histogram Blue bars → Expansion (volatility is increasing) Red ba
Hrum
Yvan Musatov
4 (1)
The Hrum indicator was created to neutralize temporary pauses and rollbacks. It analyzes price behavior and, if there is a temporary weakness in the trend, you can notice this from the indicator readings, as in the case of a pronounced change in trend direction. Entering the market is not difficult, but staying in it is much more difficult. With the Giordano Bruno indicator and its unique trend line, staying on trend will become much easier! Every rise and every fall is reflected in your emoti
Heikin –  Smart Volume Support Overview It provides enhanced visualization of price trends and momentum, with advanced customization options, theme integration, and seamless compatibility with volume-based tools. Designed for manual traders, scalpers, and algorithmic analysts, this indicator offers superior clarity for trend detection, momentum strength, and reversal spotting — especially when combined with volume analysis. Key Features Pure Heikin Ashi Candles Generated natively (not overlays
AlgoKing Chandelier Exit Indicator (MT5) The Chandelier Exit Indicator is a volatility based indicator that maximizes returns using the Average True Range (ATR) value and the highest high or lowest low of a period. Benefits Should be used as a trailing stop. Helps you exit a position when you have a respectable profit. Identifies a high probability of a trend reversal when the price moves against the prevailing trend by a distance equal to 3x the average volatility. Join the AlgoKing Lightning
**News Monitor Allert** Trading the financial markets without being aware of the economic calendar is a critical mistake that leads to unnecessary losses. Even the best technical strategy can fail instantly during a high-impact news release. This utility provides the ultimate solution, acting as a safeguard for your capital. One of the most powerful features of this indicator is its ease of use. Unlike many other tools on the market, **you do not need to configure any external links, download
Volume Bands Chart
Rafael Caetano Pinto
This indicator marks the relevant volume levels among the day. The two relevant levels are the candle with more volume and the period with more volume of lots transacted.  The filled red background is the range of price with the most relevant volume of the day (probably the big player that is command the game). The purple lines shows the range of price with most volume (probably a area where some big player is accumulating before force a market direction). There is also the dot lines that marks
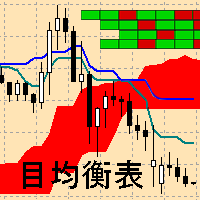
Ichimoku Map (instant look at the markets) - built on the basis of the legendary Ichimoku Kinko Hyo indicator. The task of the Ichimoku Map is to provide information about the market strength on the selected time periods and instruments, from the point of view of the Ichimoku indicator. The indicator displays 7 degrees of buy signal strength and 7 degrees of sell signal strength. The stronger the trend, the brighter the signal rectangle in the table. The table can be dragged with the mouse. The
NeuronSniper is a complete ICT (Inner Circle Trader / smart-money) workspace and setup engine for MetaTrader 5 from Neuron Systems. It maps the whole picture, market structure, liquidity, order blocks, fair value gaps and premium/discount, and then marks one strict, high-quality reversal setup with a fixed risk:reward plan. It is an indicator for chart analysis only: it draws on the chart, it does not place, modify or close trades, it does not send orders, and it does not manage positions or acc
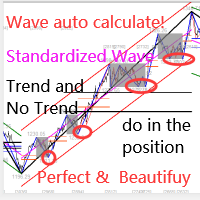
Questo indicatore è un indicatore per l'analisi automatica delle onde perfetto per il trading pratico! Caso... Nota:   non sono abituato a usare nomi occidentali per la classificazione delle onde a causa dell'influenza della convenzione di denominazione di Tang Lun (Tang Zhong Shuo Zen), ho chiamato l'onda base come   penna   e la banda dell'onda secondaria come   segmento   At allo stesso tempo, il segmento ha la direzione del trend. La denominazione   è principalmente segmento di trend   (que
KT DMA is a modified and advanced version of the classic Displaced Moving Averages with buy/sell crossover alerts and a Multi-Timeframe scanner that shows DMA's direction across each real-time time frame. A Displaced Moving Average is a simple moving average that moves ahead or backward in a time frame (either short-term or long-term). It also allows you to predict price movement more accurately. Features Depicts the trend direction using the alignment of three moving averages. Buy/Sell signals
KT Volatility Oscillator MT5
KEENBASE SOFTWARE SOLUTIONS
L'Oscillatore di Volatilità KT analizza i dati di mercato passati e presenti utilizzando una formula matematica per mostrare il risultato sotto forma di oscillatore. Le onde crescenti e decrescenti corrispondono rispettivamente a un'elevata e a una bassa volatilità dell'asset.  In poche parole, la volatilità è semplicemente una misura delle fluttuazioni di prezzo di un asset in un certo periodo di tempo. Senza volatilità, ci sarebbero pochi movimenti di mercato e i trader non potrebbero trarre p
Indicator description of Yijing Guaxiang Oscillation Mean Indicator: (1) This Yijing Guaxiang change indicator is based on the Yin-Yang transformation thought of the "I Ching" philosophy in ancient Chinese culture, integrating the results of the long-short game in each candlestick K-line period of the financial trading K-line chart, using China's oldest prediction coding method, in the form of the 64 hexagrams of the I Ching, combining the Yin-Yang of each line of the hexagram with the Yin-Yang
Hurst-YZ Engine measures the one thing those indicators can't: whether the market is structurally trending or structurally mean-reverting, right now. It does this with two pieces of real quant math, the kind used on institutional research desks, not repackaged crossovers. Early-bird pricing active: Only $65 for the next 10 licenses. The price increases by $15 after every 10 copies sold to maintain premium value until it reaches its final target value of $150. Secure your copy at the lowest tie
Shqiponja Gold EA is an advanced automated trading system specifically designed and optimized for Gold (XAU/USD) scalping and trend-following strategies. Built with precise price action mechanics, it targets structural market movements to capture high-probability entries. Key Features: - Optimized for XAU/USD: Tailored specifically to handle the volatility and price action of Gold. - Smart Trend Filtering: Integrates multi-timeframe structural analysis to avoid false breakouts. - Risk Manageme
KT Connors RSI MT5
KEENBASE SOFTWARE SOLUTIONS
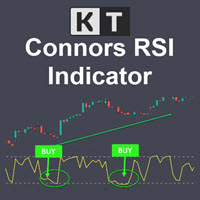
KT Connors RSI is a modified and more advanced version of the original Connors RSI developed by Larry Connors. It was designed to help traders generate trade signals based on short-term price movements. The Connors combine the standard RSI calculation with two additional elements: a short-term RSI, ROC, and a moving average. Features Provides more transparent and more actionable buy and sell signals using the overbought/oversold zones. Incorporates short-term RSI and moving average, providing
Horus Market Structure is an analysis indicator for MetaTrader 5. It combines price structure, liquidity and trend context in one chart. FEATURES - BOS and CHoCH structure marks, confirmed pivots and liquidity sweeps. - Automatic multi-swing and best-pair trendlines. - Scored analytical BUY/SELL marks with suggested Entry, SL and TP1-TP3 levels. - Multi-timeframe Order Blocks and Fair Value Gaps. - Adaptive MAX BUY/SELL zones, Stochastic K/D on price, swing zigzag and tick-volume profile. - Mul
VWAP Breakout Entry draws an anchored VWAP from market structure pivots and marks trade entries when price retests it after a breakout. Every signal comes with a stop loss and three take-profit levels, and the chart shows the full trade the way a charting platform would. Symbol : GBPUSD Timeframe : M15 / 15 Minutes Default settings are optimized for GBPUSD on M15 How it works The indicator detects swing highs and lows and anchors a VWAP to the latest structure leg. When price breaks structure a
Buy Sell Signal MTF - Advanced Reversal Indicator Buy Sell Signal MTF is a highly optimized, professional-grade trend reversal indicator designed for MetaTrader 5. It uses a sophisticated dual-layer algorithm combining Volatility (ATR) and Momentum (Stochastic Oscillator) to pinpoint highly accurate entry levels without cluttering your chart with false signals. Whether you are a scalper, day trader, or swing trader, this indicator is built to deliver precision and reliability. The signals are 1
FREE
Indicatore Crypto_Forex "Istogramma di Trend Esponenziale" per MT5, senza ridisegno. - L'indicatore Istogramma di Trend Esponenziale è molto efficiente per il rilevamento dei trend. - Il modo migliore per utilizzarlo è in combinazione con i livelli di supporto/resistenza e la tecnica di retest (vedi immagini): - Una volta che l'indicatore rileva un nuovo trend, trova il livello SR locale e imposta l'ordine pendente corrispondente, aspettandosi un retest di quella zona. - Se il nuovo trend è ria
SMC Inducement Flow
Fabrizio Battaglini
SMC Inducement Flow is a MetaTrader 5 indicator designed to visualize market structure, inducement sweeps, Fair Value Gaps and compression momentum in one clean workflow. Core idea: the indicator helps traders follow structural flow by marking BOS and CHoCH events, tracking active inducement levels, highlighting sweep behavior and exposing useful buffers for discretionary analysis or EA development. Launch price: this product is published with an introductory promotional price. The price may be
Smart Reversal Prophets
Loys Steve Dzene Tagne
Avez-vous toujours rêvé de pouvoir entrer sur le marché juste après la clôture d'une bougie… et de voir le marché évoluer immédiatement dans votre sens ? Avez-vous toujours souhaité détecter les retournements de tendance plus tôt, éviter les faux signaux et, surtout, saisir les tendances longues avant la majorité des traders ? Aujourd'hui, je vais vous présenter mon nouvel indicateur : Prophète du retournement intelligent. Contrairement aux indicateurs traditionnels qui réagissent avec un certa
FlatOut Movings Robot: Controllo assoluto del flat. Navigazione sicura nel trend. Le strategie basate sulle medie mobili condividono tutte lo stesso incubo. Non appena il mercato cambia fase, il vostro capitale inizia a sciogliersi come neve al sole. Le medie mobili classiche generano decine di falsi incroci durante le fasi di lateralizzazione. Quanto ai filtri standard, accumulano un ritardo spietato. Passate le notti stressati davanti al terminale, per poi entrare proprio alla fine del movime
McGinley Trend Pullback Strategy - Multi-Average Trend and Pullback System McGinley Trend Pullback Strategy is an automated trading system that trades only when four averages line up in trend order and price confirms against the session VWAP. It enters on a fresh alignment and on pullback bounces off the McGinley Dynamic line, and it uses a Zero-Lag EMA filter to avoid catching the first move after a reversal. Every trade has a stop loss and a take profit. It does not use martingale, grid strat
Your Treand
Tatiana Savkevych
The Your Trend indicator not only signals an immediate buy or sell. It indicates a short-term and long-term trend. operations. The simplest way to use the indicator is to open a trade in the direction of an existing trend. The indicator allows you to study the real and historical market trends in more detail! Shows the opening points of transactions for sale or purchase, and also indicates the direction of the trend on: short-term and long-term periods. The analysis is based on the selected tim
If you are unsure how to use this indicator, please feel free to reach out to me. I will explain it to you and provide reading materials to help you make the most of it. TD Sequential Scanner: An Overview The TD Sequential scanner is a powerful technical analysis tool designed to identify potential price exhaustion points and trend reversals in financial markets. Developed by Tom DeMark, this method is widely used by traders to gauge market cycles and potential turning points with precision. Ho
MetaForecast M5
Vahidreza Heidar Gholami
5 (3)
MetaForecast predice e visualizza il futuro di qualsiasi mercato basandosi sull'armonia dei dati dei prezzi. Sebbene il mercato non sia sempre prevedibile, se esiste un modello nei prezzi, MetaForecast può prevedere il futuro con la massima precisione possibile. Rispetto ad altri prodotti simili, MetaForecast può generare risultati più accurati analizzando le tendenze di mercato. Parametri di input Past size (Dimensione passata) Specifica il numero di barre che MetaForecast utilizza per creare
# Momentum Curvature - Accelerazione contro velocita *Categoria: Momentum | Difficolta: intermedio | Finestra: finestra separata sotto il grafico | Mercati: Universale (Forex, indici, materie prime, crypto, azioni) | Timeframe consigliati: M15, M30, H1, H4, D1* ## Descrizione breve > Misura l'accelerazione del prezzo, cioe la derivata seconda della serie lisciata, e la confronta con la velocita. Individua la perdita di spinta prima che la direzione cambi. ### Panoramica Chi guida un'auto s
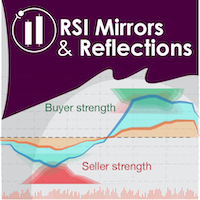
"Battles between bulls and bears continue to influence price development long after the combat has ended, leaving behind a messy field that observant technicians can use to manage risk and find opportunities. Apply "trend mirror" analysis to examine these volatile areas, looking for past action to impact the current trend when price turns and crosses those boundaries." RSI Mirrors and Reflections is a robust technique using multiple RSI periods, mirrors and reflections based on RSI values to ind
Crypto Hades Adaptive-Swing  Dynamic Fibonacci Matrix & MTF Trend Alignment Crypto Hades Adaptive-Swing  is an elite institutional-grade Expert Advisor designed specifically for extreme cryptocurrency volatility (BTCUSD, ETHUSD). Named after Hades, the Greek god of the underworld, this EA waits patiently for deep pullbacks and strikes at the most advantageous "underworld" price levels using a dynamic mathematical matrix. Unlike standard trend followers that buy at the top, Hades uses a Multi-
Gli utenti di questo prodotto hanno anche acquistato
Trend Sniper X
Sarvarbek Abduvoxobov
4.86 (44)
Trend Sniper X è un indicatore trend-following multi-timeframe per MetaTrader 5 che aiuta i trader a identificare la direzione del trend e i potenziali punti di inversione con chiarezza e precisione. per MT4: https://www.mql5.com/en/market/product/193245 Informazioni sul prezzo: Il prezzo attuale è promozionale ed è soggetto a modifiche con il rilascio di futuri aggiornamenti e nuove funzionalità. Offerta Bonus: Per ricevere GRATIS l'Auto-Trade Assistant EA per questo indicatore, invia un messa
Un nuovo Re in città - Indicatore + Gestione ordini (TP1 + TP2 + TP3) + Invio opzionale di segnali Telegram INCLUSO (GRATIS) (SISTEMA COMPLETO DI TRADING e SEGNALI) Il nostro miglior EA per l’Oro: Gold Slayer Questo indicatore include una strategia avanzata, un sistema di trading con gestione ordini personalizzabile e un sistema mean reversion che combina estensioni di envelope, supportato da molteplici filtri intelligenti di conferma come RSI per individuare ingressi di inversione ad alta proba
Smart Trend Trading System — MetaTrader 5 Dopo l'acquisto, inviami un messaggio su MQL5 per ricevere GRATUITAMENTE Smart Universal Expert Advisor, insieme al corso online, al manuale PDF e all'accesso al gruppo privato. STTS riunisce la direzione del trend, i segnali di entrata e uscita, le zone di inversione e i livelli di prezzo importanti direttamente sul grafico. Segui il sistema manualmente oppure collega un EA compatibile separato per eseguire le operazioni automaticamente con le impostazi
Zoryk Gold
Reda El Koutbane
4.79 (19)
ZORYK — Sistema avanzato di segnali XAUUSD per MetaTrader 5 Conosci sicuramente questa sensazione. Passi molto tempo ad analizzare l’oro. Aspetti il punto d’ingresso corretto. Finalmente apri l’operazione e il prezzo inizia immediatamente a muoversi contro di te. Chiudi troppo presto, sposti lo Stop Loss o esiti per alcuni secondi. Successivamente il mercato raggiunge esattamente l’obiettivo che avevi previsto inizialmente, ma senza di te nella posizione. Il problema non era sempre la direzione.
M5 Sniper
MeanFX
5 (4)
Porta il tuo vantaggio nel trading sotto i riflettori! M5 Sniper è un nuovo indicatore di MeanFX. Combina segnali di trading precisi con livelli TP/SL adattivi , creando così le migliori operazioni statistiche possibili! Il prezzo aumenta ogni 5 acquisti, il prossimo prezzo è di 69$ Scrivimi dopo l'acquisto per ricevere consigli/guida e un EA bonus Cosa lo rende diverso? Performance statistica comprovata su Gold XAUUSD ( funziona su quasi ogni asset , concentrandosi sulla padronanza di un singol
Entry Points Pro vi mostra dove entrare, dove mettere lo stop e con quale lotto operare — prima di piazzare l'ordine. PREZZO Ora 199 USD: 10 copie a questo prezzo, poi 249 USD. Il prezzo finale è di 349 USD. Guadagno facendo trading sui mercati e lo dimostro, quindi non ho bisogno di vendere questo indicatore a tutti. È uno strumento per trader che ragionano con la propria testa, non un pulsante magico. Nessuna rottura, nessun trade. Una freccia grigia è un segnale annullato: il prezzo non ha r
Ultra Indicator
Ihor Otkydach
5 (1)
ULTRA è un indicatore tecnico che funziona secondo un approccio “tutto in uno”: analizza autonomamente il mercato, genera segnali di trading, visualizza i livelli per l’impostazione degli ordini stop-loss e suggerisce quando chiudere le operazioni per realizzare profitti o ridurre al minimo le perdite. In altre parole, non importa se non sai come analizzare il mercato, determinare i livelli — dove impostare lo stop-loss — o se hai difficoltà con la gestione del capitale. ULTRA farà tutto questo
Gann Made Easy è un sistema di trading Forex professionale e facile da usare che si basa sui migliori principi del trading utilizzando la teoria di mr. WD Gann. L'indicatore fornisce segnali ACQUISTA e VENDI accurati, inclusi i livelli di Stop Loss e Take Profit. Puoi fare trading anche in movimento utilizzando le notifiche PUSH. CONTATTAMI DOPO L'ACQUISTO PER RICEVERE GRATUITAMENTE LE ISTRUZIONI DI TRADING E OTTIMI INDICATORI EXTRA! Probabilmente hai già sentito parlare molte volte dei metodi d
SuperScalp Pro
Van Minh Nguyen
4.54 (37)
SuperScalp Pro - Professional Multi-Layer Confluence Scalping System SuperScalp Pro è un indicatore di scalping avanzato che potenzia il Supertrend classico con diversi filtri intelligenti di conferma. Aiuta a individuare opportunità di trading Buy/Sell con una maggiore probabilità di successo, riducendo significativamente i falsi segnali. Le frecce Buy e Sell vengono visualizzate chiaramente direttamente sul grafico, insieme ai livelli di Stop Loss e Take Profit basati sull’ATR, calcolati autom
GoldenX Entry MT5
VividMind Digital Solutions
5 (17)
GoldenX Entry è un indicatore per MT5 con un algoritmo adattivo Smart Entry Trend, un sistema di scoring dei segnali, un rilevatore del regime di mercato e un filtro di volatilità. Ogni segnale include un livello di ingresso calcolato, tre livelli di Take-Profit (TP1, TP2, TP3) e un livello di Stop-Loss. È costruito su più livelli analitici progettati per adattarsi a diverse condizioni di mercato, combinando un sistema analitico multilivello con un ottimizzatore integrato e un sistema di traccia
Gold Trend Coach MT5
Cristhian Alexander Gaibor Cuasquer
4.27 (11)
Segnali di acquisto e vendita senza repaint sull'oro (XAUUSD) per MetaTrader 5. Ogni segnale arriva con stop loss e tre take profit. Un filtro Smart Money Concepts con BOS e CHoCH, così operi a favore della struttura, non contro. Un Mentor live sul pannello che ti guida passo dopo passo dall'ingresso fino al TP3. E alert direttamente sul tuo telefono e sul tuo canale Telegram. Questo è Gold Trend Coach. Mai più da solo davanti al grafico. KIT ACQUIRENTE GRATIS con il tuo acquisto: 1. Telegram A
SMC Intraday Formula
VividMind Digital Solutions
5 (26)
Cominciamo con la verità. Nessun indicatore da solo ti renderà profittevole. Se qualcuno ti dice il contrario, ti sta vendendo un sogno. Qualsiasi indicatore che mostra frecce perfette di acquisto/vendita può essere reso impeccabile — basta ingrandire la giusta sezione della storia e catturare solo i trade vincenti. Noi non lo facciamo.  SMC Intraday Formula è uno strumento. Legge la struttura del mercato per te, identifica le zone a più alta probabilità e ti mostra esattamente come appare la t
Boba Analysis Suite
Trade Ready Solutions LLC
5 (2)
Boba Analysis Suite Boba Analysis Suite è un indicatore di analisi per MetaTrader 5. Riunisce la struttura del mercato, le zone di prezzo rilevanti e il contesto generale del mercato in un’unica visualizzazione del grafico. Sviluppato sulla base dell’esperienza pratica come trader e formatore di trading, supporta un processo di analisi strutturato: valutare la direzione del mercato, individuare livelli importanti e analizzare congiuntamente più intervalli temporali. Analisi nel contesto del merc
Prossimo aggiornamento — Versione 2.52 in arrivo! [NOVITÀ] Preparati a 4 nuove funzionalità principali progettate per migliorare la tua analisi di mercato e il tuo flusso di lavoro nel trading Portiamo l’analisi di mercato a un livello superiore con 4 nuove funzionalità progettate per soddisfare le tue esigenze di trading. Ecco le novità: 1. TRADE OVERVIEW DASHBOARD 2. CONFLUENCE AT ZONE 3. STRONG & WEAK HIGH/LOW 4. OTE 1. TRADE OVERVIEW DASHBOARD Una dashboard che ti aiuta a comprendere più fa
FX Power MT5 NG
Daniel Stein
5 (33)
FX Power: Analizza la Forza delle Valute per Decisioni di Trading Più Intelligenti Panoramica FX Power è lo strumento essenziale per comprendere la reale forza delle principali valute e dell'oro in qualsiasi condizione di mercato. Identificando le valute forti da comprare e quelle deboli da vendere, FX Power semplifica le decisioni di trading e rivela opportunità ad alta probabilità. Che tu segua le tendenze o anticipi inversioni utilizzando valori estremi di Delta, questo strumento si adatta
M1 Sniper MT5
Oleg Rodin
5 (7)
M1 SNIPER   è un sistema di indicatori di trading facile da usare. Si tratta di un indicatore a freccia progettato per l'intervallo temporale M1. L'indicatore può essere utilizzato come sistema autonomo per lo scalping sull'intervallo temporale M1 e come parte del tuo sistema di trading esistente. Sebbene questo sistema di trading sia stato progettato specificamente per il trading sull'intervallo temporale M1, può comunque essere utilizzato anche con altri intervalli temporali. Inizialmente ho p
FiboSniper Pro
Van Minh Nguyen
5 (4)
FiboSniper Pro – Multi-Filter Fibonacci System with Auto SL/TP and Control Panel FiboSniper Pro è un indicatore tecnico che combina Fibonacci Envelopes dinamici con diversi filtri di conferma per generare segnali Buy e Sell selezionati. I livelli di Fibonacci vengono calcolati sulla base di Moving Average e ATR e successivamente filtrati tramite ADX, EMA, RSI, ATR, Volume, Time e struttura delle candele. L’indicatore visualizza direttamente sul grafico i livelli automatici di Stop Loss e Take Pr
Auto Optimized SpeedAngle è un sistema di vettorizzazione del momento di livello istituzionale che elimina l'overfitting ( curve-fitting ) attraverso l'ottimizzazione continua Walk-Forward (WFO). Invece di affidarsi a input statici che si degradano quando i regimi di mercato cambiano, l'indicatore recalibra dinamicamente i suoi parametri utilizzando la validazione Out-of-Sample (OOS), assicurando che i segnali visualizzati rappresentino reali vantaggi statistici anziché anomalie storiche. Quadro
SQN Max indicator for MT5 by ITC
Renaud Herve Francois Candel
Sqn Max Indicator Sqn Max is an exclusive indicator to trade the market with high effectiveness. The indicator is based on price action, volatility and trend. This indicator is as simple as possible but not too simple. The indicator can generate alerts to ease the trading process. You don't have to stay all day in front of your screen. The indicator can be used with any class of assets and with any time frame. It is possible to achieve better results trading our list of selected assets. We achi
Smc Pro ToolKit
Talal N Z Aljarusha
5 (14)
SMC PRO TOOLKIT — SMART MONEY ANALYSIS & STRUCTURED TRADE PLANNING SMC Pro ToolKit is a professional Smart Money Concepts analysis workspace for MetaTrader 5. It combines market structure, multi-timeframe analysis, institutional price zones, setup evaluation, confirmation tools, volume context, alerts, and risk planning inside one organized chart environment. One workspace. Multiple layers of confirmation. One structured trading plan. OPEN COMPLETE USER GUIDE MULTI-CONDITION SETUP ENGINE At
SIO Oscillator: oscillatore auto-ottimizzante dello squilibrio di semivarianza Acquista l’indicatore e ricevi GRATIS l’Expert Advisor (EA) basato su di esso. La maggior parte degli oscillatori tratta ogni movimento di prezzo allo stesso modo. SIO separa la pressione rialzista da quella ribassista e misura lo squilibrio tra le due, mostrando quale parte controlla davvero il mercato: compratori o venditori. Quando lo squilibrio raggiunge un estremo, SIO genera un segnale chiaro con livelli di ingr
Power Candles MT5
Daniel Stein
4.58 (12)
Power Candles V3 - Indicatore di forza ad ottimizzazione automatica Power Candles V3 trasforma la forza delle valute e degli strumenti in un piano di trading attuabile su ogni grafico a cui è collegato. Invece di limitarsi a colorare le candele, esegue un'auto-ottimizzazione in tempo reale in background e ti fornisce i migliori valori di Stop Loss, Take Profit e soglia di segnale per il simbolo che hai davanti. Basta un clic per adottarlo nel trading live: i raggi di ingresso, Stop Loss e Take P
Atomic Analyst MT5
Issam Kassas
4.51 (65)
Atomic Analyst — MetaTrader 5 Dopo l'acquisto, inviami un messaggio su MQL5 per ricevere GRATUITAMENTE Smart Universal Expert Advisor, insieme al corso online, al manuale PDF e all'accesso al gruppo privato. Atomic Analyst riunisce l’azione del prezzo, la direzione del trend, i segnali di entrata e uscita, lo Stop Loss e diversi livelli di Take Profit direttamente sul grafico. INDIVIDUA IL SEGNALE. COMPRENDI IL CONTESTO OPERATIVO. Atomic Analyst organizza la sua analisi in informazioni visive ch
Unix Scalper
Issam Kassas
4 (4)
Unix Scalper — MetaTrader 5 Dopo l'acquisto, inviami un messaggio su MQL5 per ricevere GRATUITAMENTE Smart Universal Expert Advisor, insieme al corso online, al manuale PDF e all'accesso al gruppo privato. Individua il setup. Esamina il piano. Scegli come operare. UNIX Scalper riunisce analisi di mercato, indicazioni BUY/SELL/WAIT e livelli Entry, Stop Loss, TP1 e TP2 in un unico pannello organizzato. VISUALIZZA IL SEGNALE E IL PIANO • Indicazioni chiare: BUY, SELL o WAIT. • Livelli definiti: E
Tokyo mt5 Indicator
Vasiliy Strukov
5 (15)
Il Tokyo Indicator offre una chiara panoramica visiva della direzione del trend, dei potenziali segnali di trading e delle condizioni di mercato. La sua linea di trend a gradini, codificata a colori, distingue le fasi rialziste (in blu) da quelle ribassiste (in magenta). Frecce direzionali dedicate evidenziano potenziali opportunità di acquisto e vendita al variare del trend visualizzato. Una dashboard integrata riunisce in un'unica visualizzazione pratica il segnale corrente, il bias di mercato
Astral Structure
Ottaviano De Cicco
Astral Structure Valuta il setup. Osserva il piano iniziale. Offerta di lancio - $99. $149 dopo il lancio. Un setup di struttura pone più domande insieme: il quadro più ampio concorda, dove si trova il riferimento di stop e come sono definiti i target? Astral Structure riunisce queste domande in un unico spazio per i trader discrezionali che basano le proprie decisioni sulla struttura del mercato. Concentrati sul setup rilevante. Esamina insieme l'ultimo setup idoneo, la sua direzione e la sua q
Crystal Heikin Ashi Signals
Muhammad Jawad Shabir
5 (5)
Crystal Heikin Ashi Signals—Professional Trend & Signal Detection Indicator Advanced Heikin Ashi Visualization with Intelligent Signal System for Manual & Automated Trading Final Price: $149 ---------> Price goes up $10 after every 10 sales . Limited slots available — act fast . Overview User Guide PDF Crystal Heikin Ashi Signals is a professional-grade MetaTrader 5 indicator that combines pure Heikin Ashi candle visualization with an advanced momentum-shift detection system. Designed for both m
Trend Catcher ind mt5
Ramil Minniakhmetov
5 (18)
INDICATORE TREND CATCHER L'indicatore Trend Catcher analizza i movimenti dei prezzi di mercato, utilizzando una combinazione di indicatori di analisi del trend proprietari dell'autore e personalizzati. Identifica la vera direzione del mercato filtrando il rumore a breve termine e concentrandosi sulla forza del momentum sottostante, sull'espansione della volatilità e sul comportamento della struttura dei prezzi. Utilizza inoltre una combinazione di indicatori personalizzati di smoothing e filtr
Indicatore multi-valuta di forza e momentum MT5 Dynamic Forex28 Navigator è l'evoluzione dei nostri indicatori popolari da lunga data, che riunisce la potenza di cinque in uno: Advanced Currency Strength28 Indicator (700 recensioni) Advanced Currency IMPULSE with ALERT (530 recensioni) Currency Strength EXOTICS GOLD Impulse with Alert CS28 Combo Signals (bonus attuale) Non serve acquistare quattro indicatori e impilarli sui grafici. Tutto è riunito in un solo indicatore potente: la forza delle 2
Scalper Vault è un sistema di trading potente e completo, progettato per i trader che desiderano ottenere risultati costanti nel trading intraday. Questo indicatore ad alta precisione funge da sistema di trading autonomo, offrendo analisi di livello istituzionale sia per il mercato Forex che per le Opzioni Binarie. CONTATTAMI DOPO L'ACQUISTO PER RICEVERE I MIEI CONSIGLI DI TRADING E UN FANTASTICO BONUS! Eliminando le congetture e le complesse analisi manuali, Scalper Vault ti permette di concen
Altri dall’autore
MACDAdaptive
Iliya Rangelov
MACD Adaptive is a MACD that adjusts its periods to the market and never repaints. Every bar is calculated only with the data available up to that bar. If you reload the chart or restart the terminal, the history looks exactly the same as it did live. What you see in the past is what you would have seen in real time. MAIN FEATURES Adaptive periods: shorter in a clean trend, longer in choppy noise. Can be switched off for a classic MACD. Buy / Sell arrows on a CLOSED bar (final, never disappear)
FREE
Plan, test and track your trades directly on the MT5 chart: a long / short position tool with partial take profits, a moving stop loss, a trading journal, statistics and alerts. Click LONG or SHORT, click on the chart where the entry should be, drag the SL and TP - and you see the risk and the reward in money, the R:R and the lot for your risk %. Press SAVE and the tool stays on the chart: it is tracked candle by candle on the history and live, and every saved trade goes into the statistics and
A free long / short position tool for MetaTrader 5: click where the entry should be, drag the stop loss and the take profit, and see the risk and the reward in money, the R:R and the lot for your risk % of the balance. No more counting points and pip values before every trade: the tool shows the lot that keeps your risk at the % you choose, with the commission included. The indicator does not open or close trades. It is a planning tool, the decision is yours. MAIN FEATURES Click to place: press
FREE
A free chart-pattern indicator for MetaTrader 5 that tells you the truth about each pattern: how often it really reached 1R and 2R on your symbol and timeframe, next to what a random entry with the same stop did. Most pattern indicators only draw arrows. This one measures them. Every signal shows its historical win % and the "random %" for the same direction and stop size, so you can see at once whether a pattern has an edge on the chart you trade - or not. The indicator does not open or close t

FREE
Filtro:
Nessuna recensione
Rispondi alla recensione