Smart Order Blocks

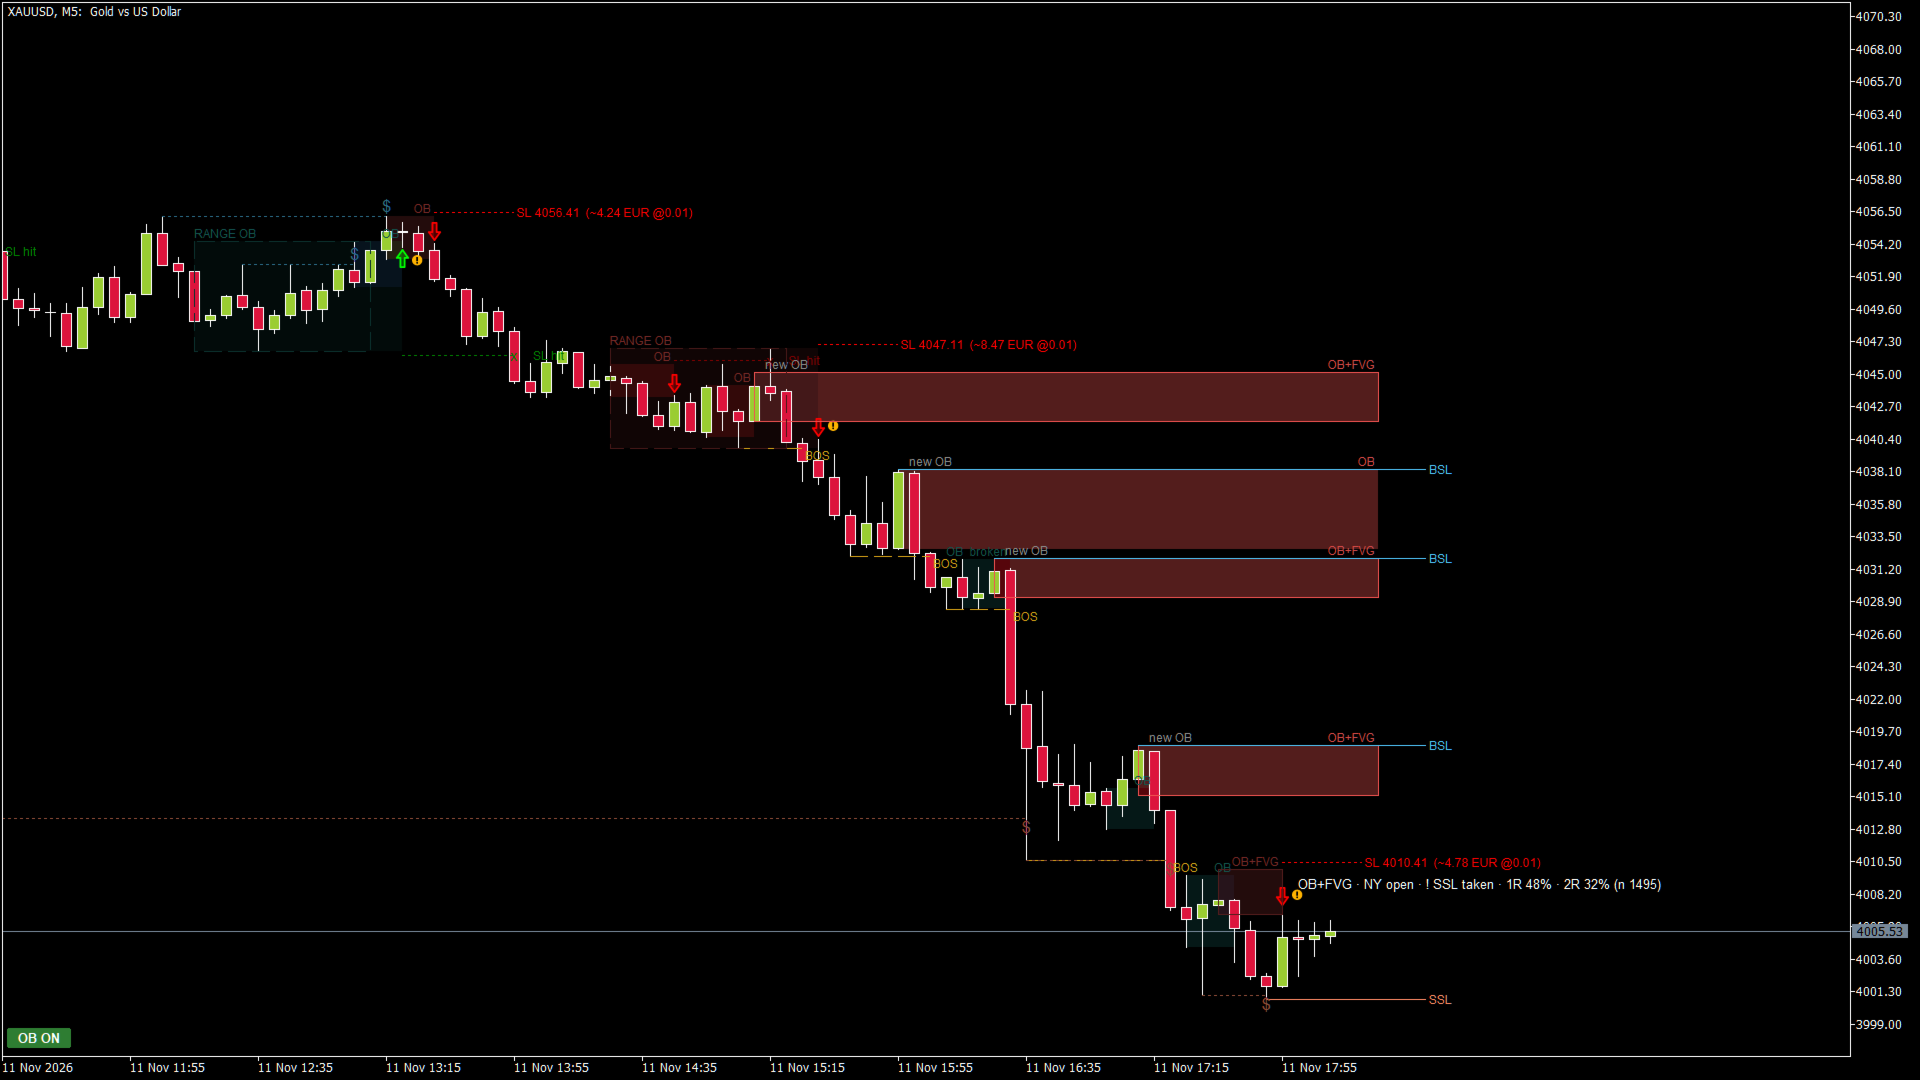
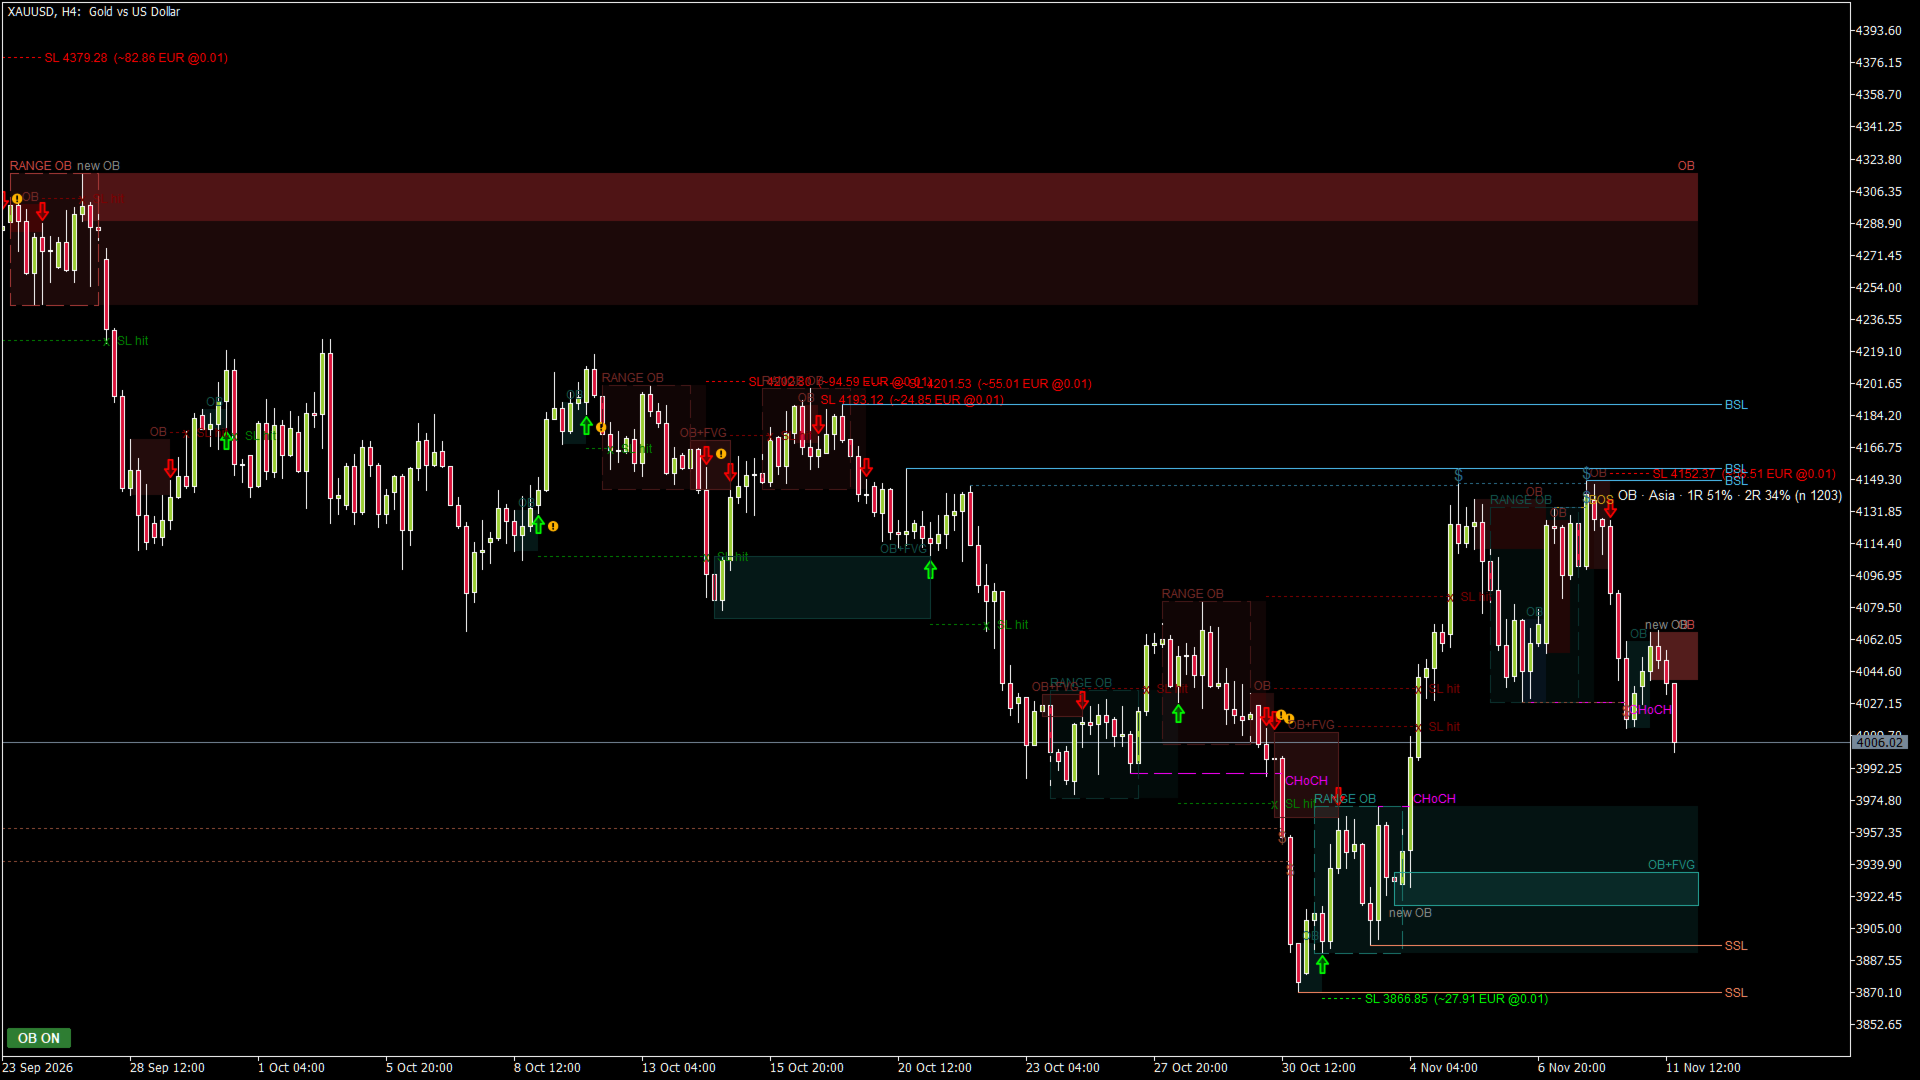
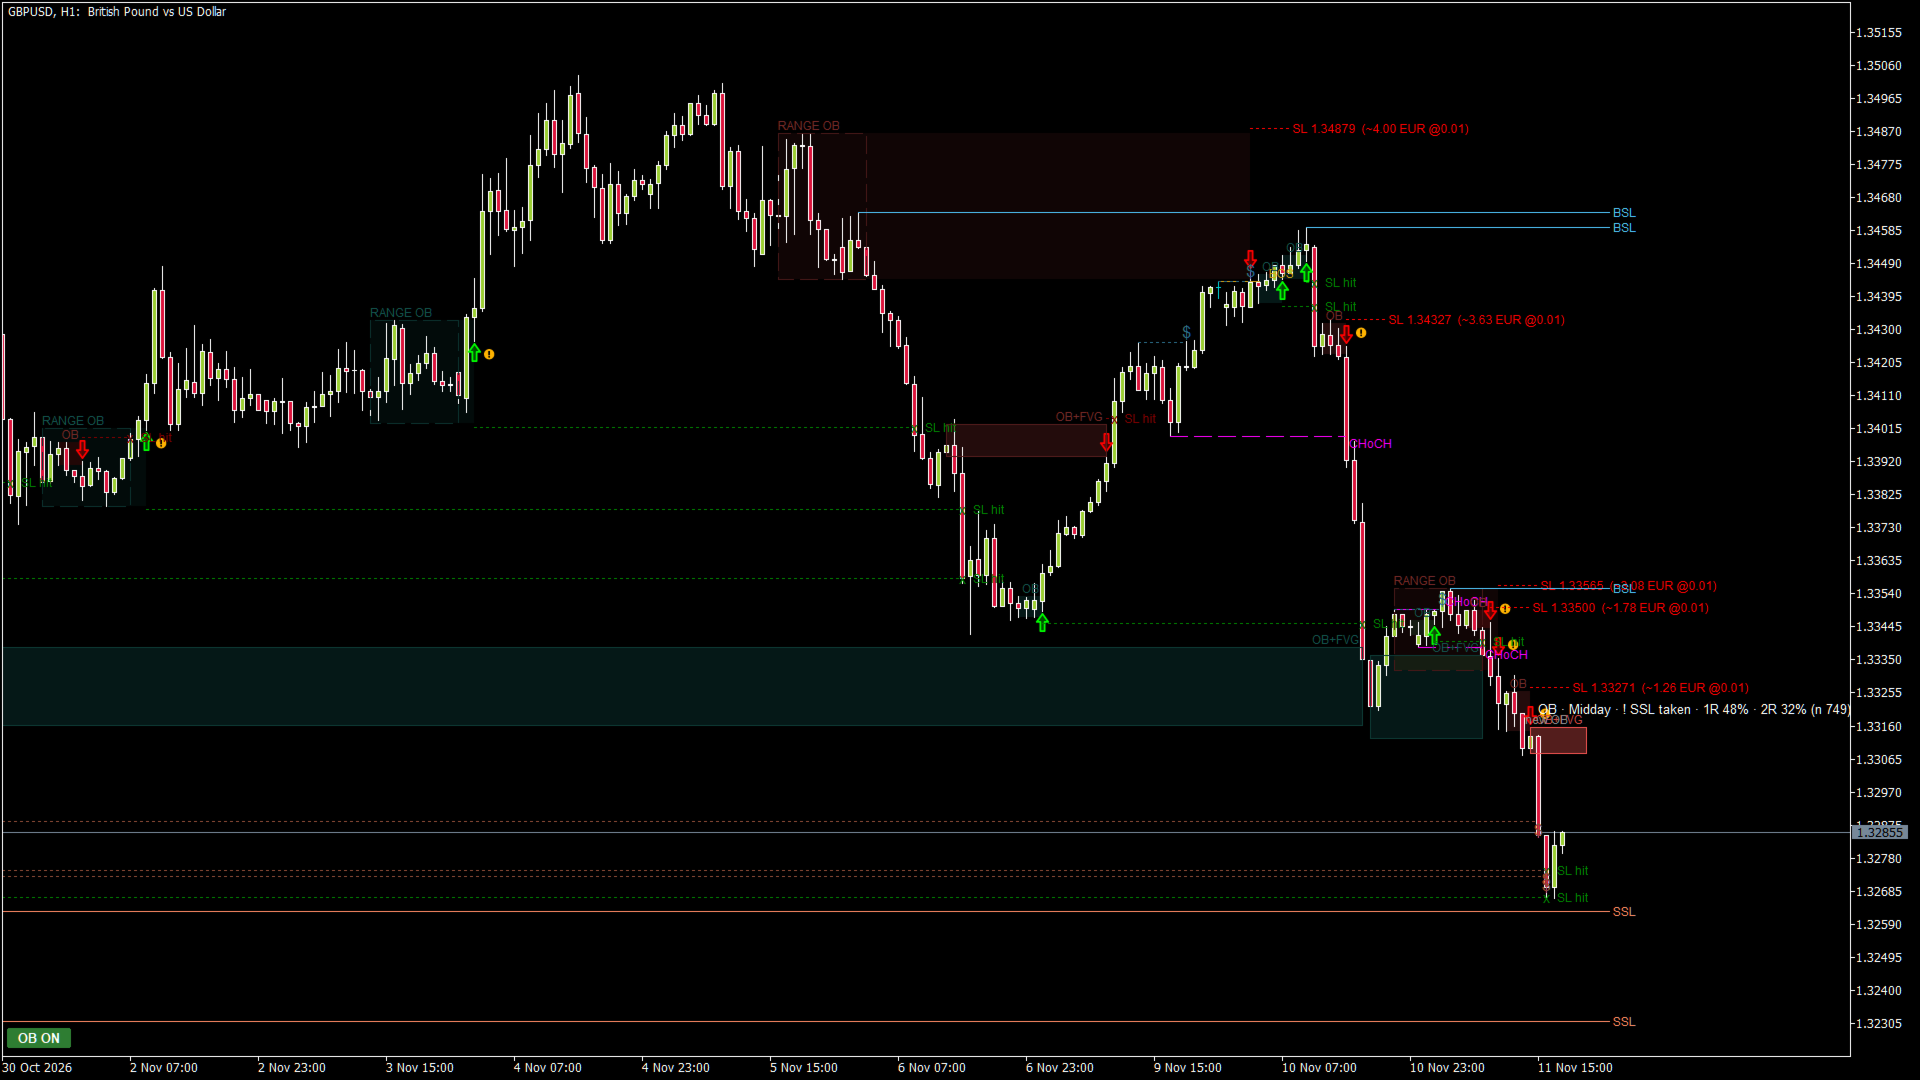
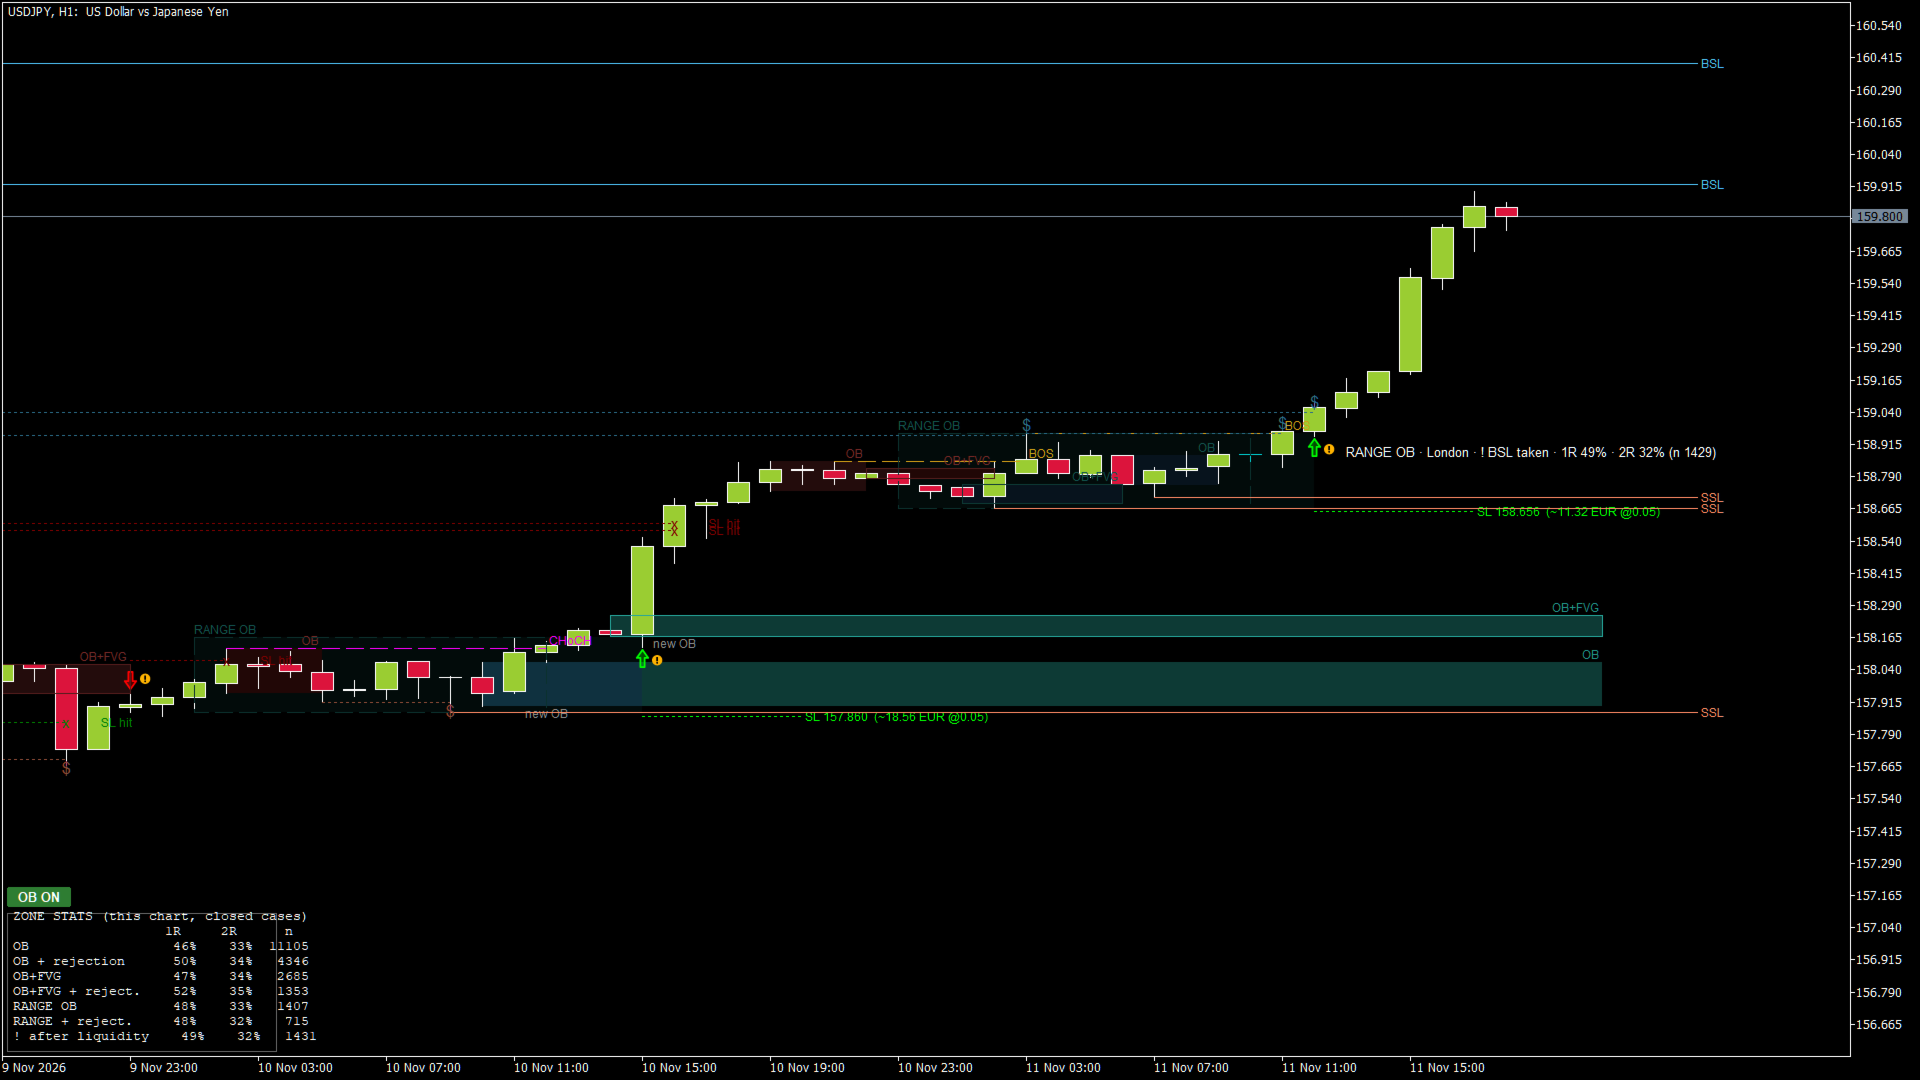
Smart Order Blocks puts the main Smart Money Concepts on one clean chart: order blocks, fair value gaps (FVG), range order blocks, market structure (BOS / CHoCH) and liquidity (BSL / SSL, equal highs / lows, liquidity taken). It gives a signal when price touches a zone and rejects it, and shows how often that type of signal worked in the past ON YOUR CHART.

Nothing is drawn before it happened and nothing repaints: a zone appears only after the candle that confirms it has closed, and a signal only after the rejection candle has closed.

Great for learning Smart Money Concepts: hover the mouse over any zone, arrow or line and a short explanation tells you what it is, why it is there and where the SL would be. You see the concepts on real charts instead of reading about them.

HOW TO USE IT IN 5 STEPS

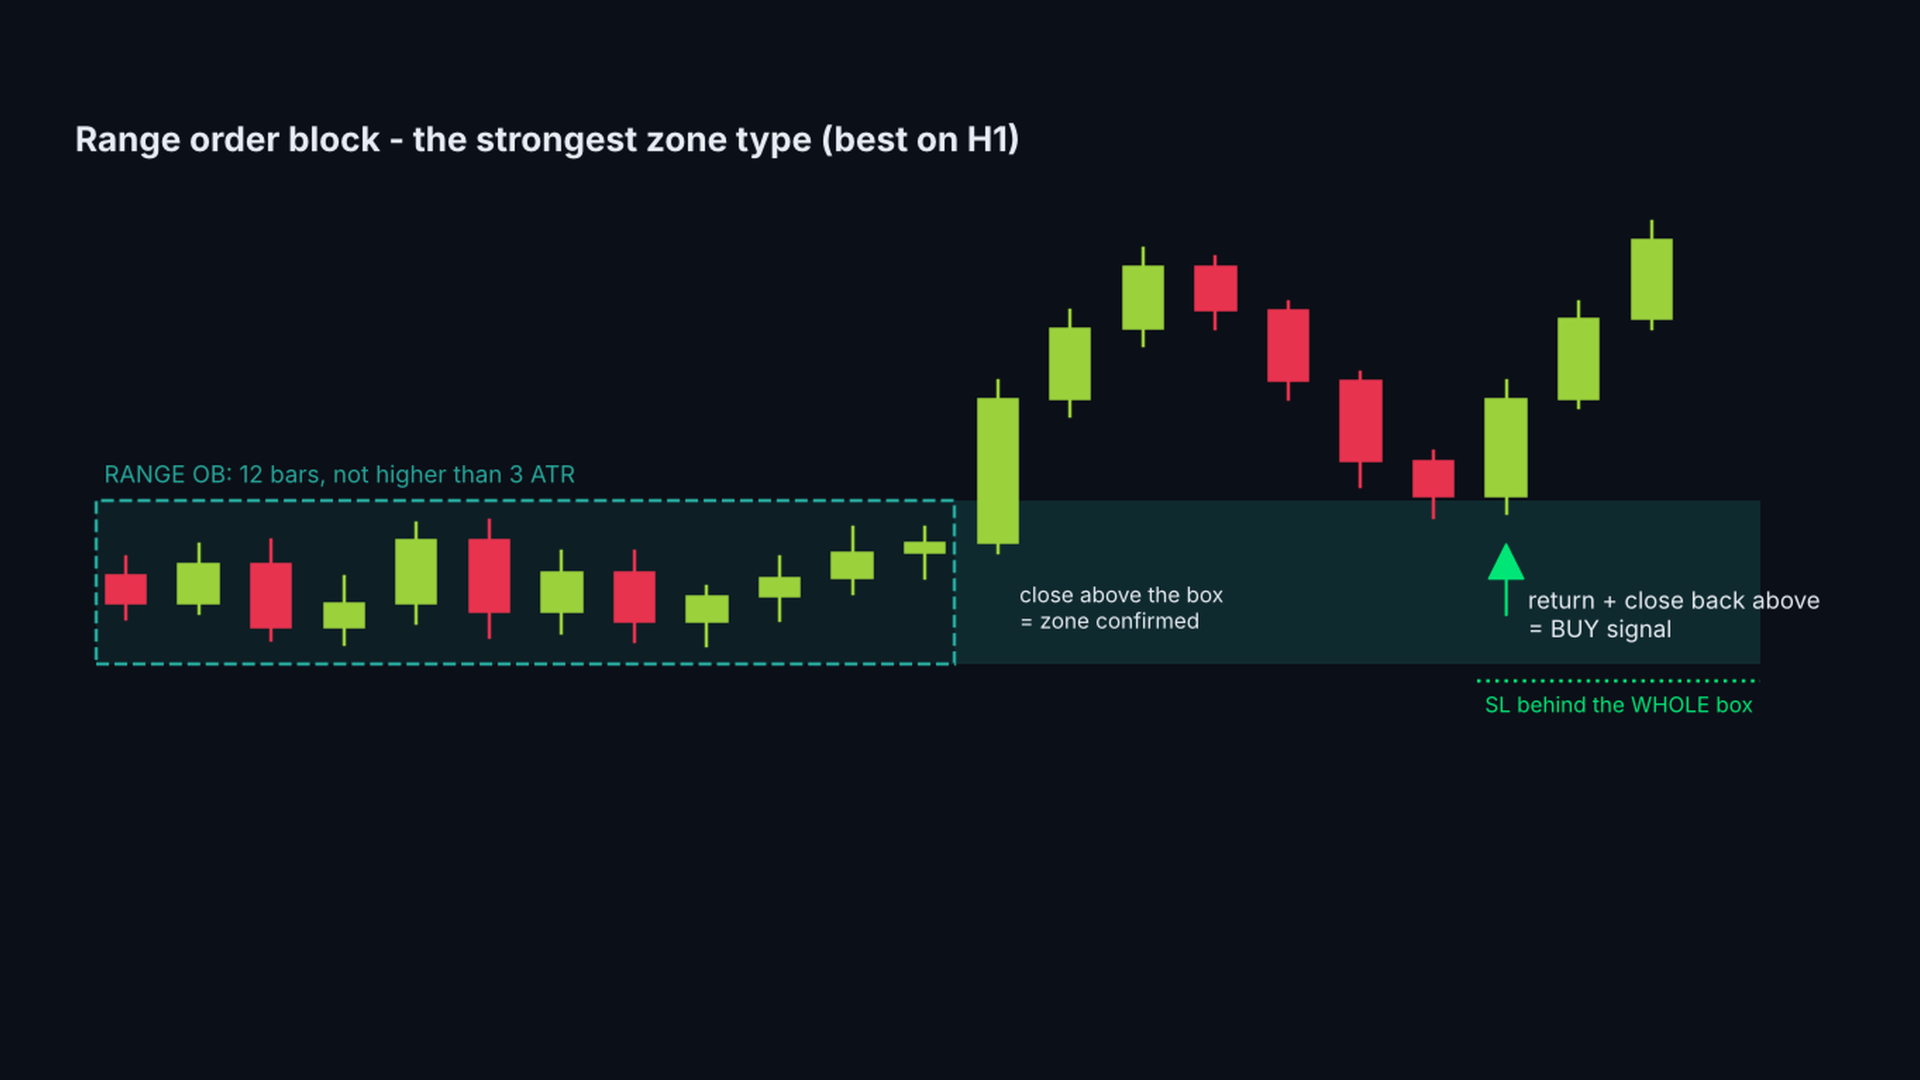
1) Attach it to an H1 chart and look at the zones: green = bullish order blocks (possible support), red = bearish (possible resistance). The light box is a RANGE OB, the strongest zone type.
2) Check the context: BOS / CHoCH show the direction of the structure, BSL / SSL show where stop orders rest above highs and below lows.
3) Wait for an arrow: a candle touched a zone and closed back outside it. The label shows the zone type and how often this type worked on your chart.
4) Use the dotted SL line behind the zone for your stop and size the position from that distance (the label shows the risk in money). Many traders take the entry on M5 / M15 in the direction of the H1 zone.
5) Skip signals marked with "!" and wait when arrows come in both directions within a few candles.

MAIN FEATURES

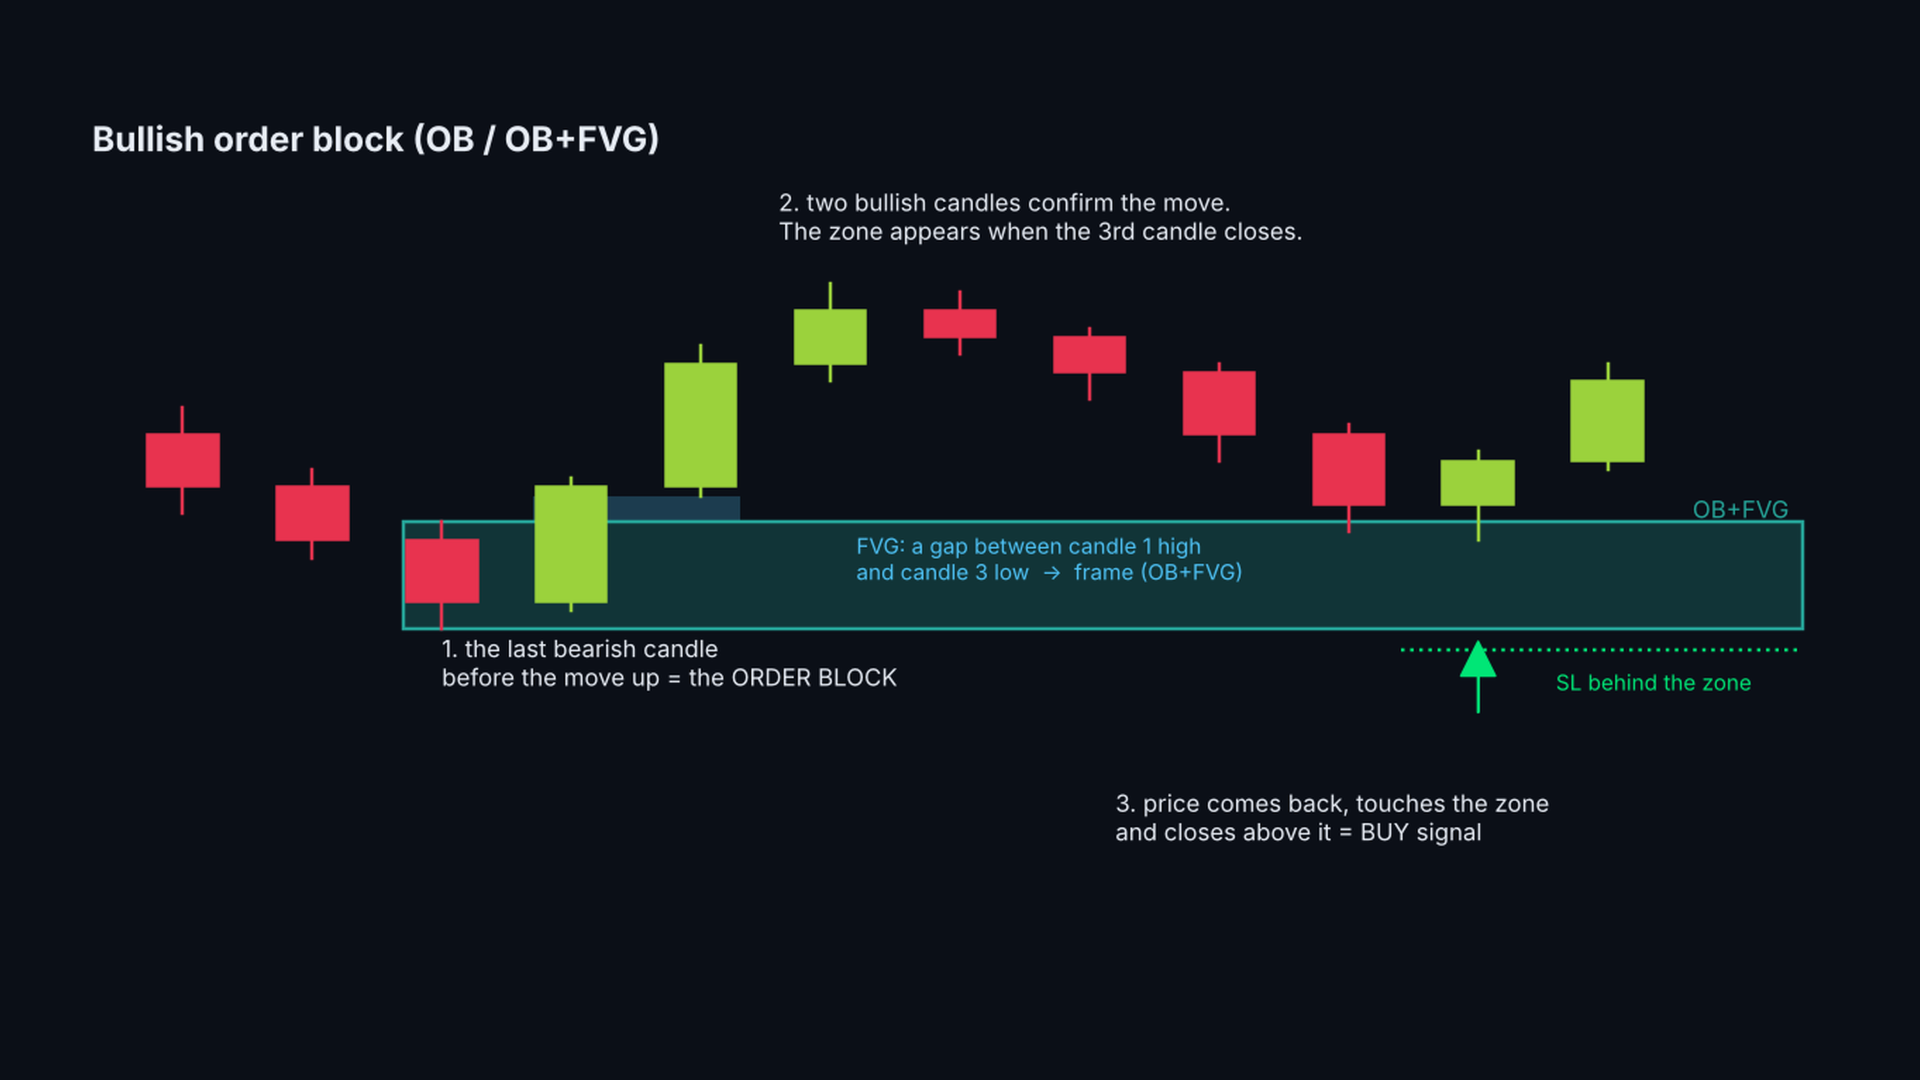
  • Order blocks (OB): the last opposite candle before a move, confirmed when the 3rd candle closes.
  • OB + fair value gap: order blocks whose move left a price gap are marked with a frame.
  • Range order blocks: a consolidation of 12 bars followed by a close beyond it. The whole box is the zone.
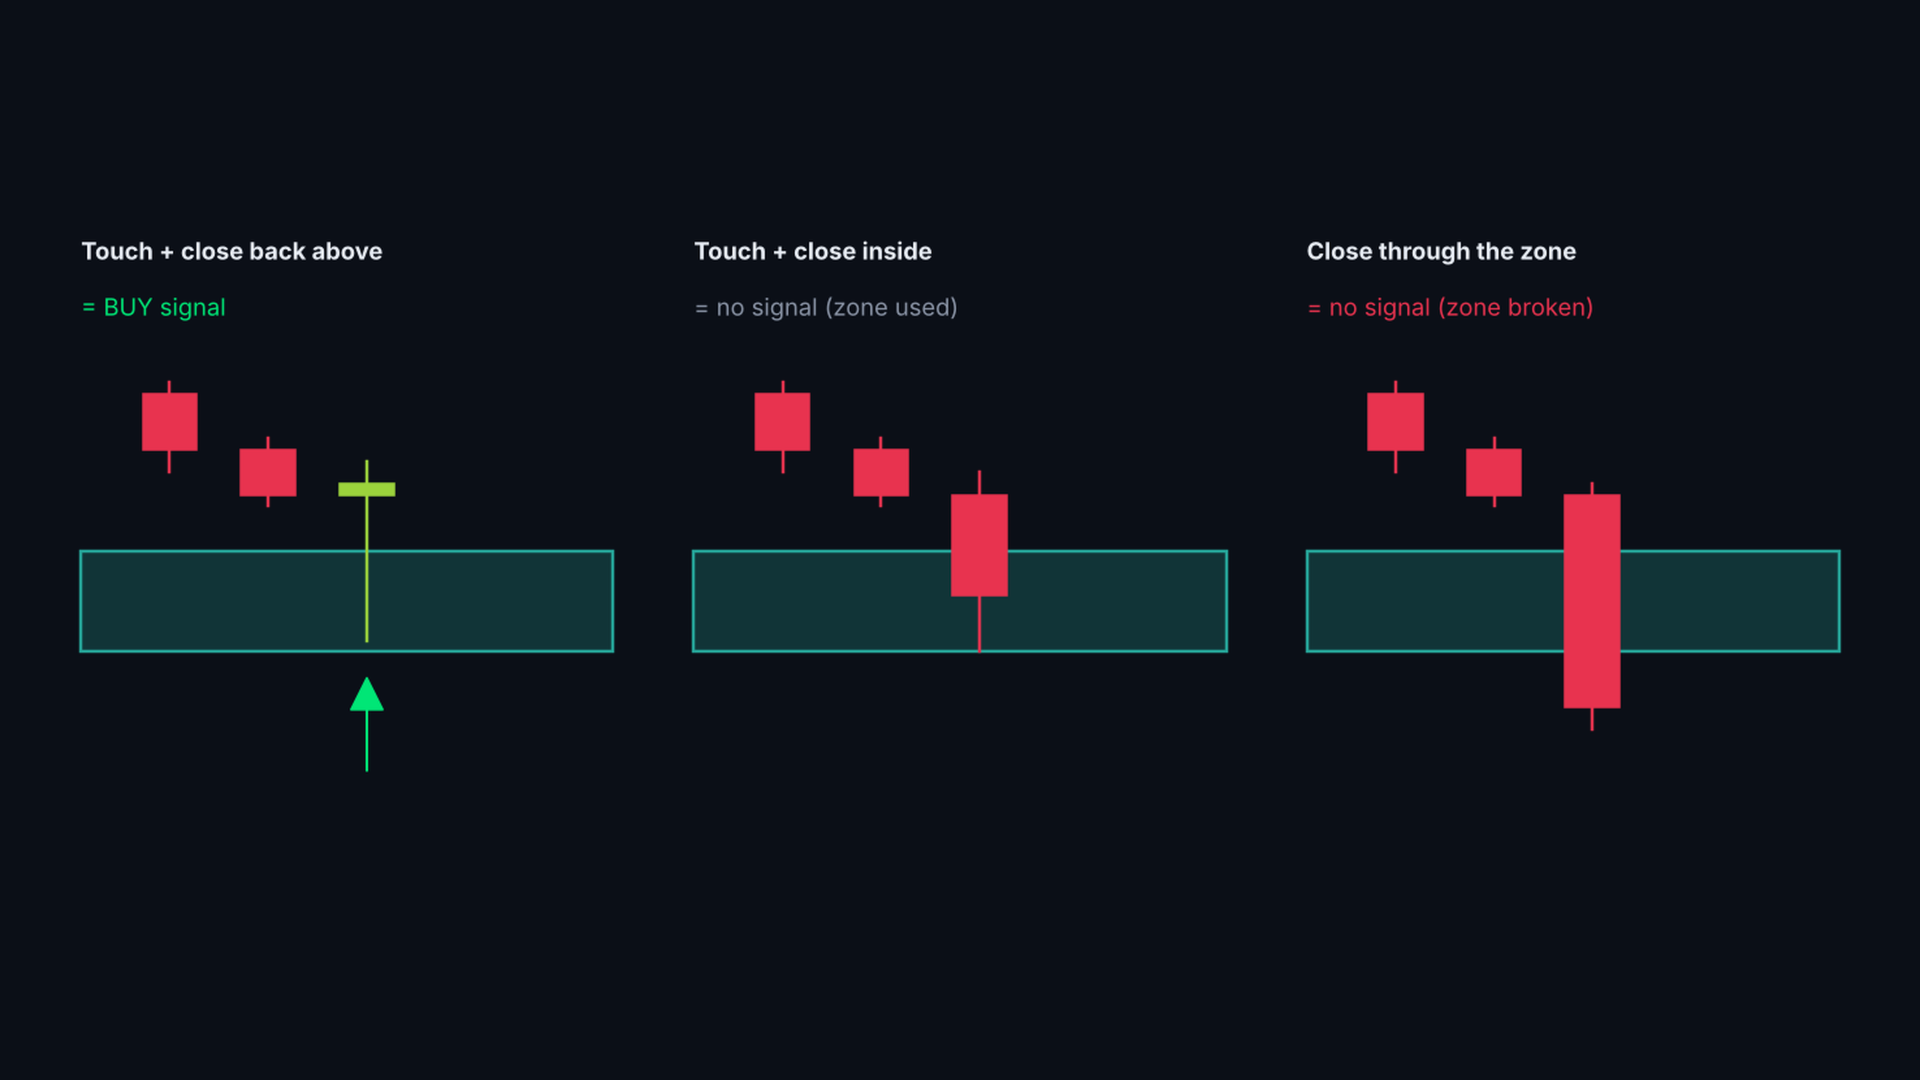
  • Rejection signals: a closed candle that touched an untouched zone and closed back outside it. Arrow + SL line behind the zone.
  • Possible signal: a hollow arrow while the candle is still open and touching a zone. It becomes a signal on the close or disappears.
  • Honest probability: for every signal type the indicator counts how often price reached 1R and 2R before the SL in the past cases on this chart (walk-forward, no look-ahead).
  • Fair value gaps: order blocks whose move left an FVG get a frame (OB+FVG), FVGMinATR sets the minimum gap size.
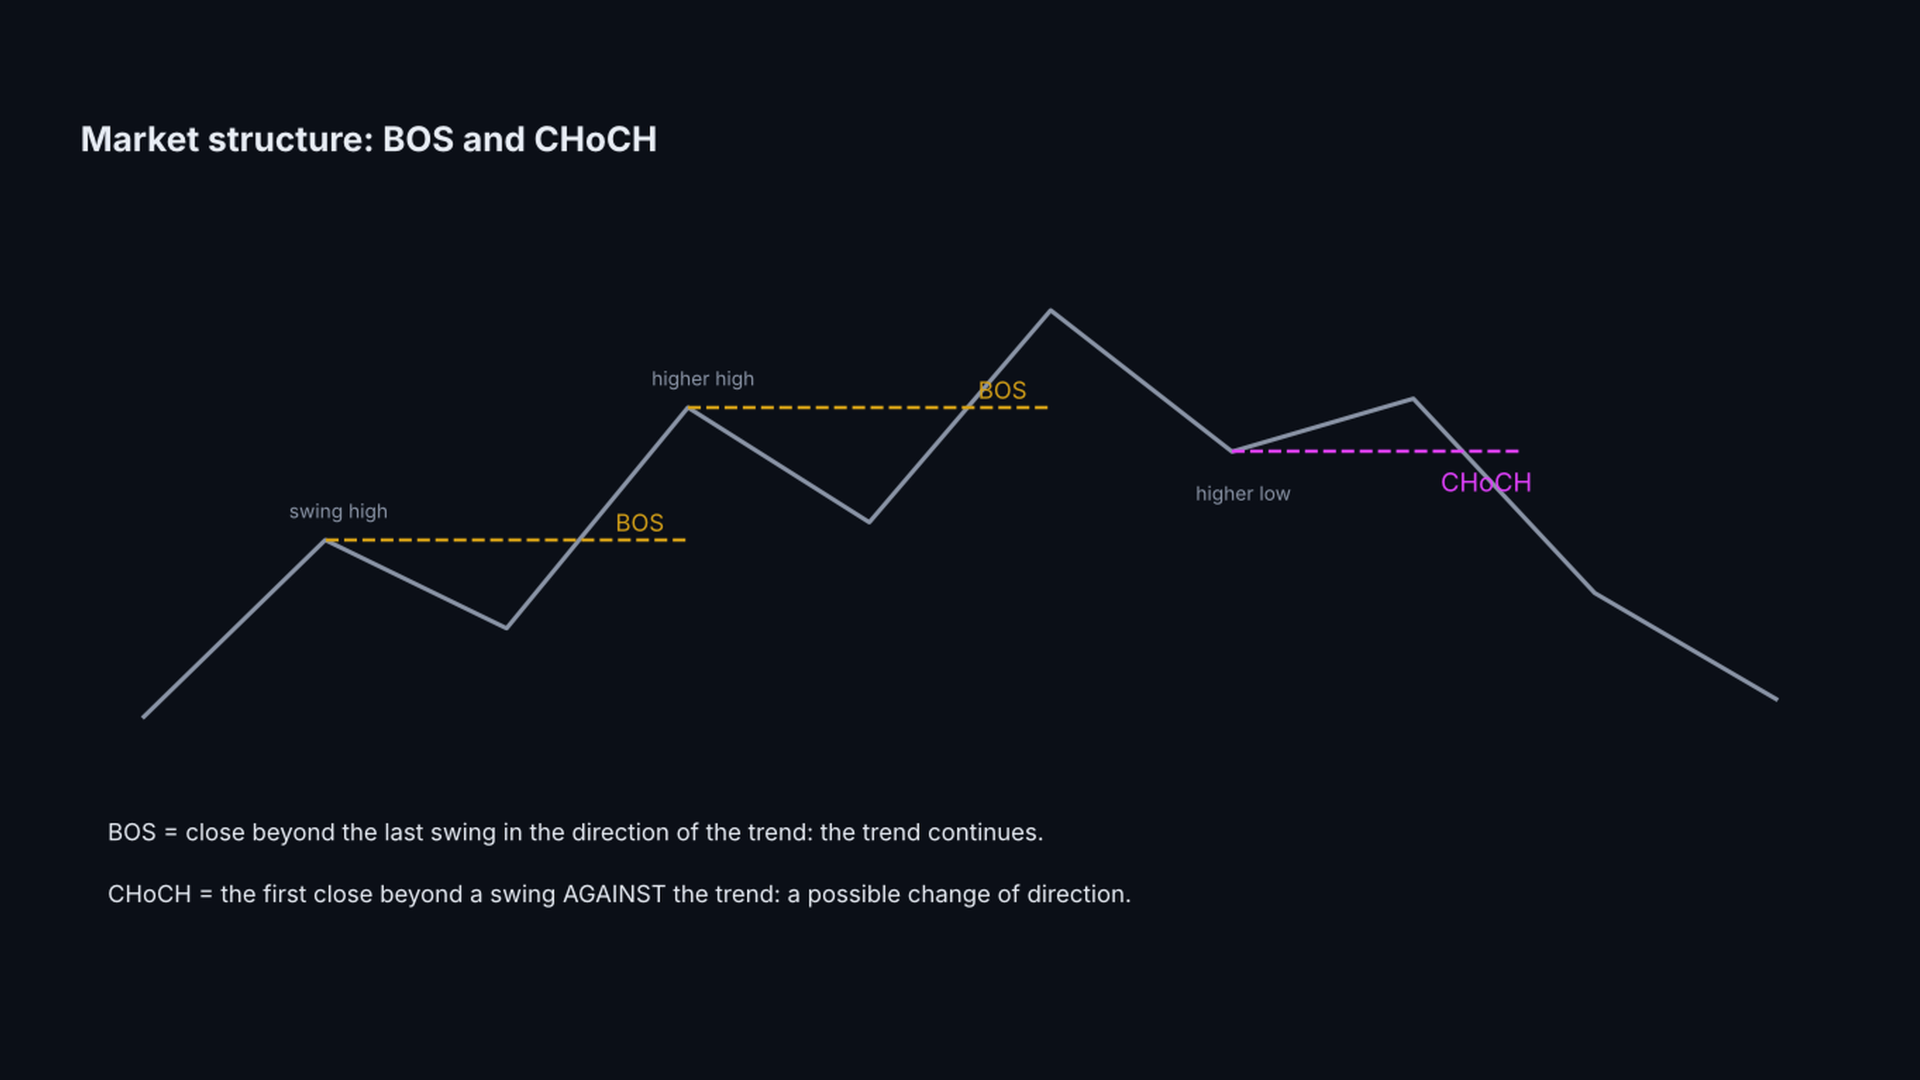
  • Market structure: break of structure (BOS) and change of character (CHoCH) lines.
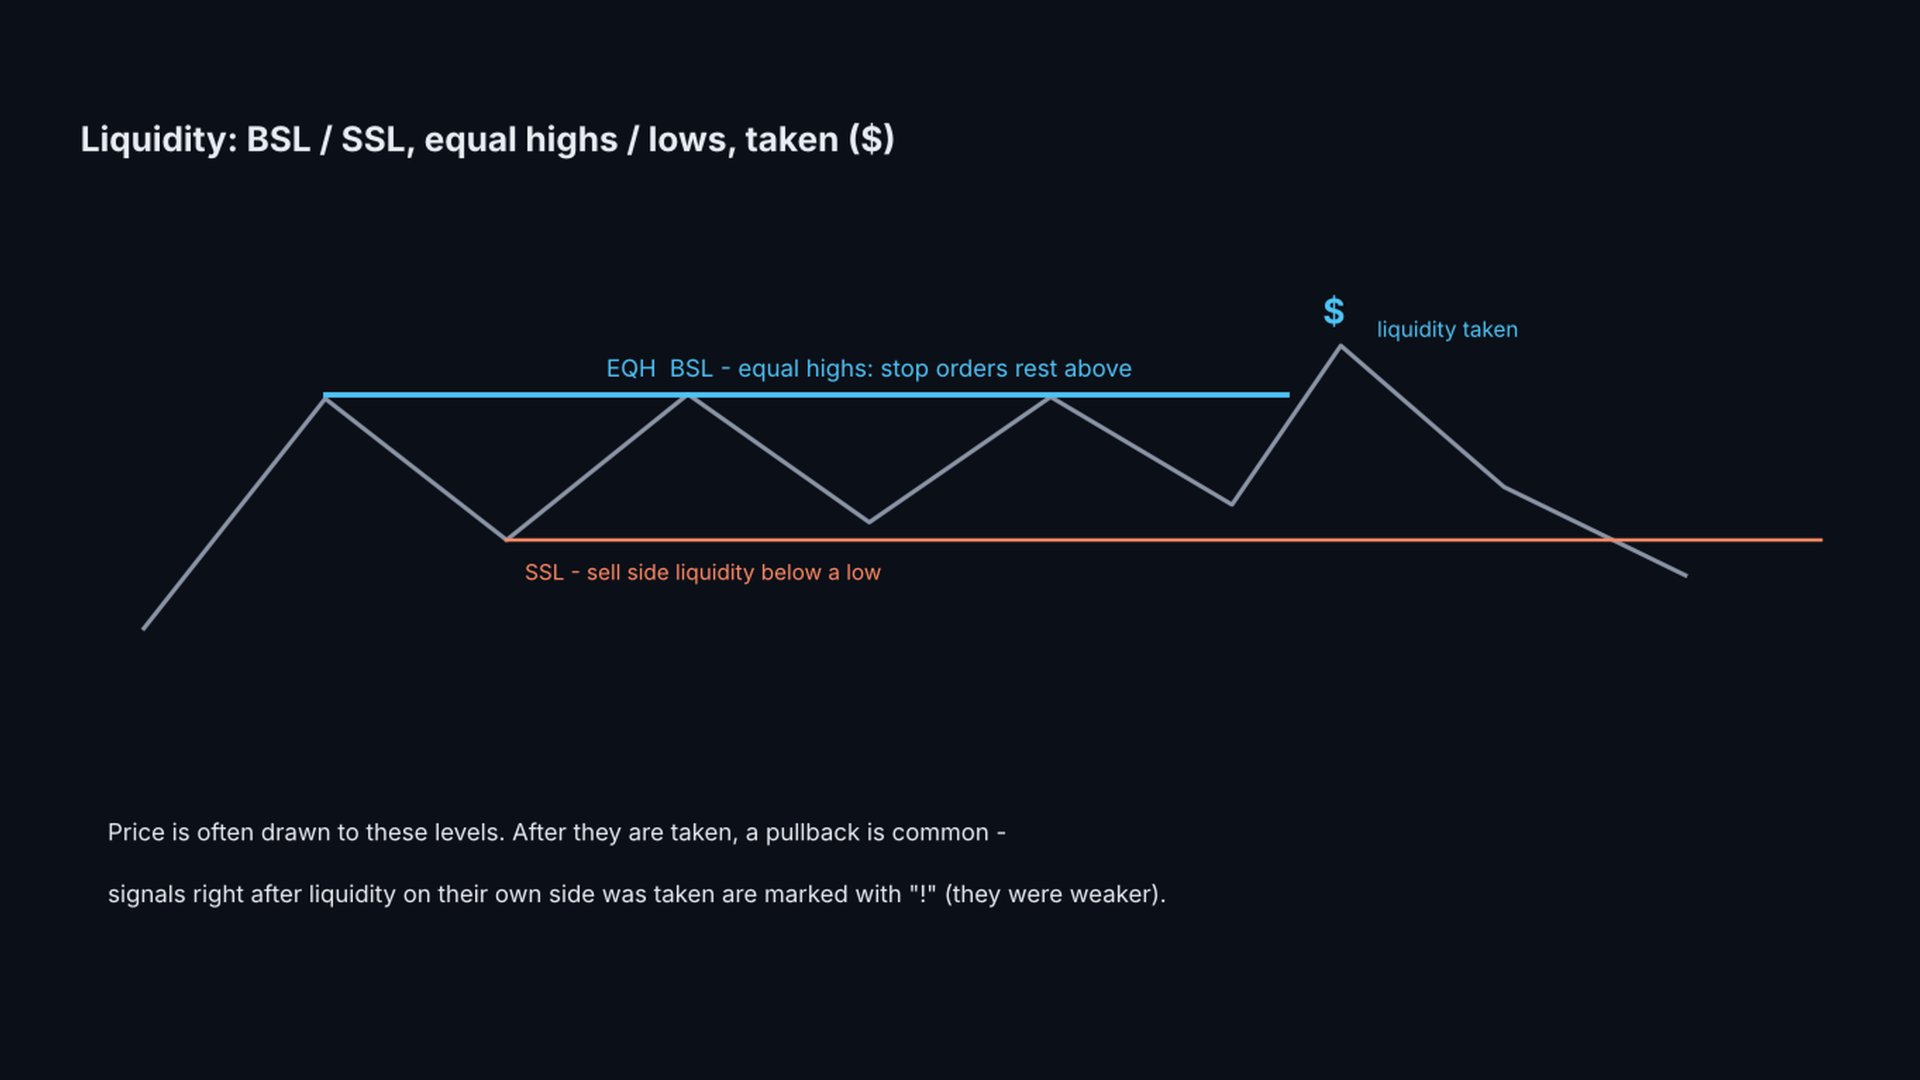
  • Liquidity: resting buy side / sell side liquidity (BSL / SSL), equal highs / lows (EQH / EQL) and where liquidity was taken ($).
  • Caution mark "!" on signals that come right after liquidity on the same side was taken.
  • Hover the mouse over any zone, arrow, line or label: a tooltip explains what it is, with the prices and the SL.
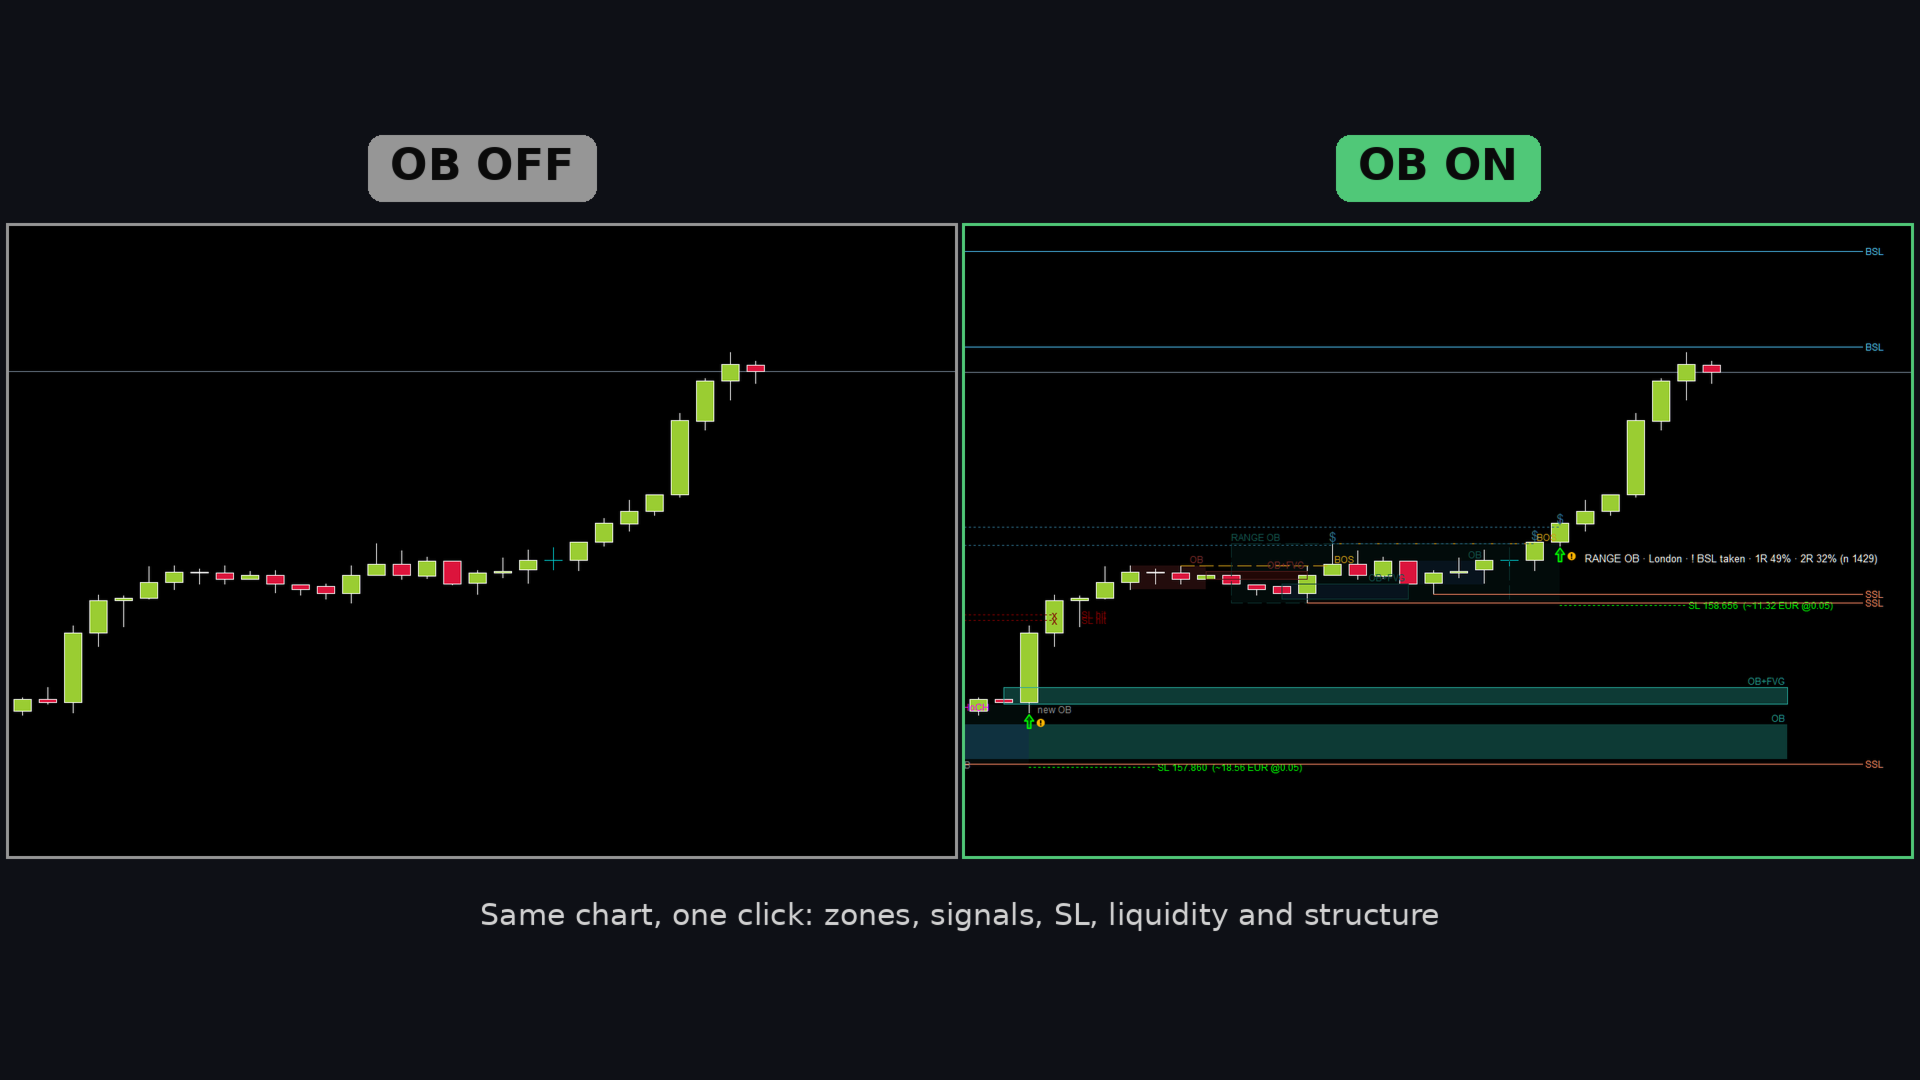
  • "OB ON / OB OFF" button to hide everything with one click. Popup and push alerts.
  • Works on any symbol and timeframe. Light and dark charts (colors adjust automatically).

USER GUIDE

1. QUICK START

1) Attach Smart Order Blocks to a chart. The default settings work on any symbol.
2) Wait a few seconds on the first load: the probability statistics are calculated on up to 50 000 bars (StatsBars).
3) Hover the mouse over anything that is drawn to read what it is.
4) For push notifications: Tools > Options > Notifications in MetaTrader 5, enter your MetaQuotes ID and enable push notifications.

2. THE ZONES

  • Bullish OB (green): the last bearish candle before a move up. Bearish OB (red): the last bullish candle before a move down.
  • An OB is shown only when the move is confirmed: the 2 candles after it move in the same direction and the 3rd candle has closed.
  • OB+FVG (with a frame): the move left a fair value gap (a gap between candle 1 and candle 3).
  • RANGE OB (very light box with a dashed frame): a consolidation of RangeBars bars not higher than RangeMaxATR x ATR, then a close beyond it.
  • States: untouched (normal color), used = already touched (faded), broken = price closed through it ("broken").
  • An untouched zone expires after ZoneMaxBars bars.
  • "new OB" marks the candle that confirmed a zone.

3. THE SIGNALS

  • BUY: a closed candle touched an untouched bullish zone and closed back above it. SELL: the mirror case.
  • The arrow is final after the close. The label shows the zone type, the session and the probability, for example:

  "RANGE OB · London · 1R 55% · 2R 37% (n 120)".

  • SL line: a short dotted line behind the zone (+ SLBufferATR x ATR) with the risk in money, for example "SL 152.569 (~11.40 USD @0.01 lot)". If the SL is hit later, the line is faded, runs to the candle that hit it and shows "x SL hit".
  • SLMode: behind the whole zone (default), behind the middle of the zone, or behind the zone but max SLMaxATR x ATR from its edge. In our tests the stop behind the whole zone was the best on every timeframe; smaller stops were hit more often and were weaker in R.
  • Hollow arrow = possible signal on the open candle. About 1 in 3 becomes a signal. Useful on lower timeframes to look at the chart before the close.
  • SkipInsideRange: no OB signal while the signal candle is still inside a consolidation.
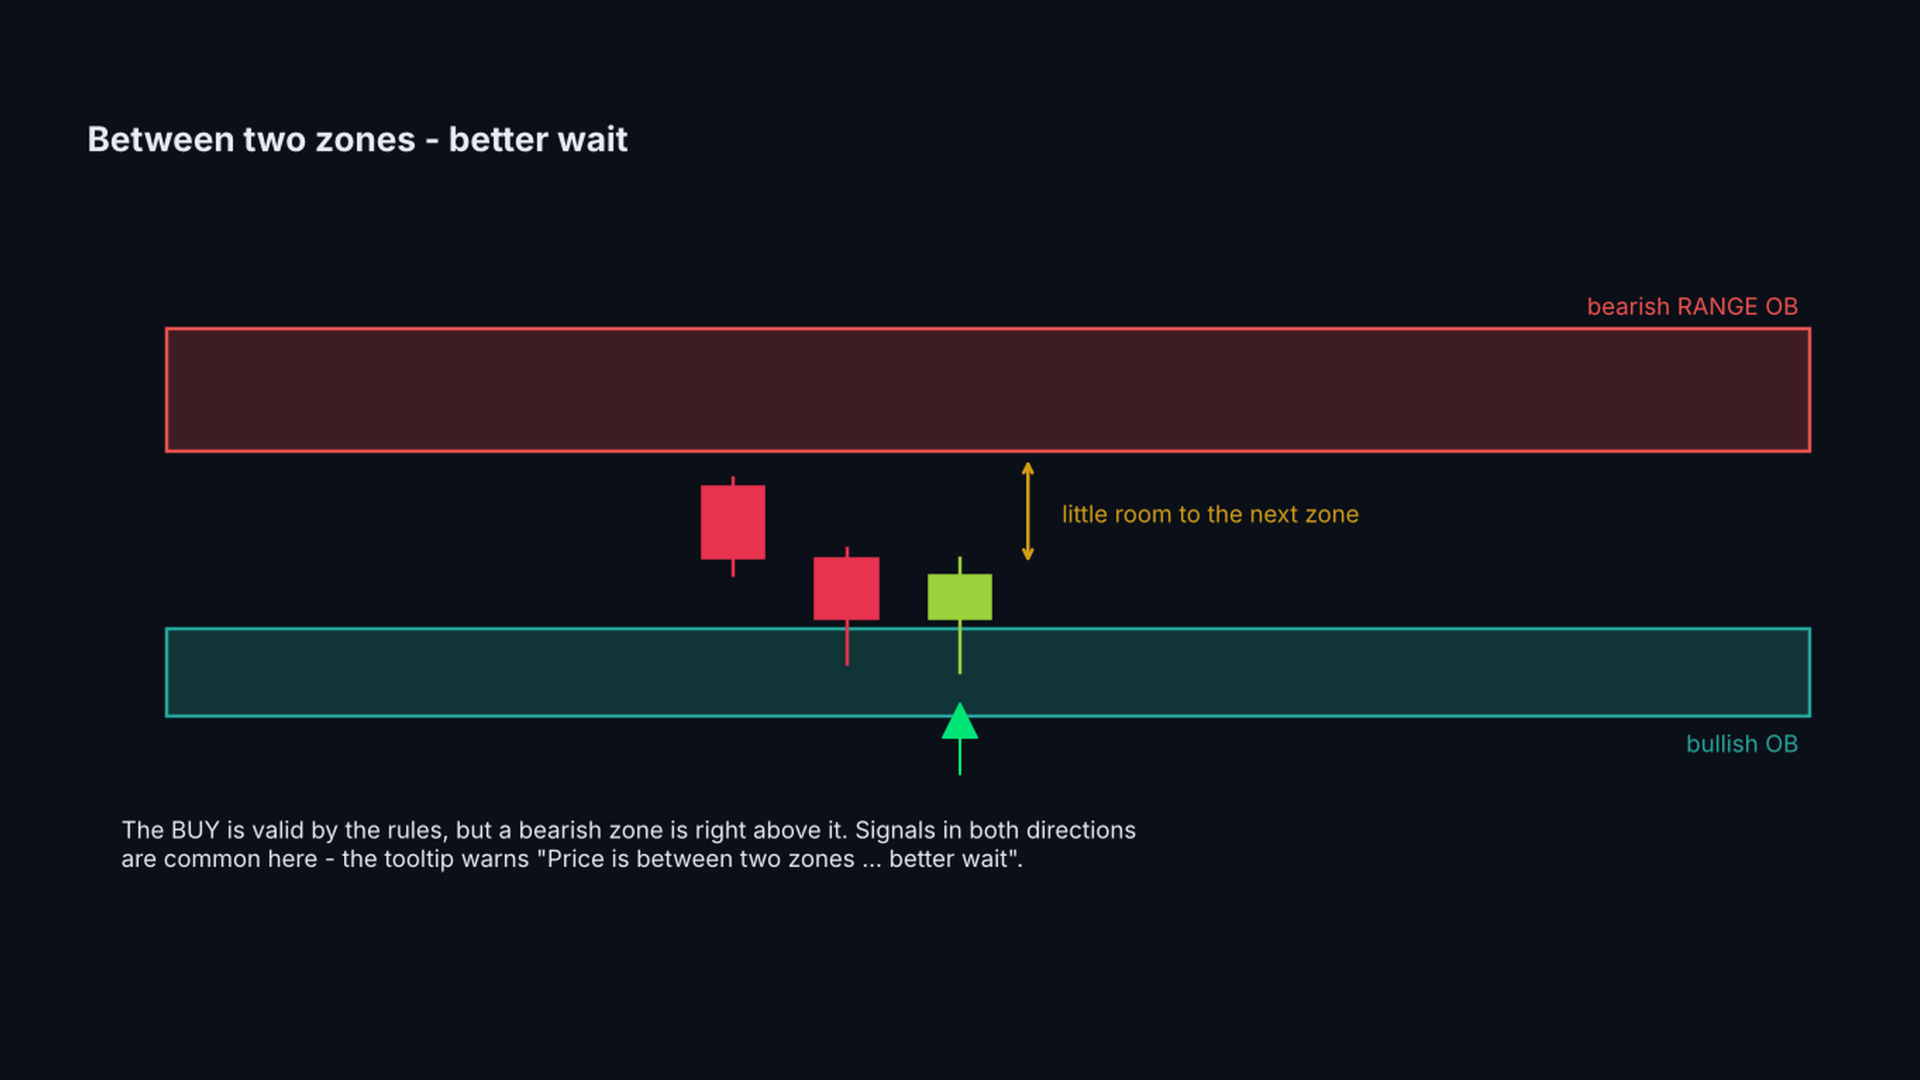
  • The tooltip of every arrow names the zone it comes from (for example "BULLISH OB 4010.30 - 4025.10"). If a zone in the opposite direction is right in front of the signal, the tooltip says "Price is between two zones ... better wait". This happens often: a buy from a green zone just under a red zone is a valid signal by the rules, but the price has little room.
  • The tooltip of every arrow says whether the signal is with or AGAINST the market structure (last BOS / CHoCH). Signals against the structure were not worse on average in our tests, so they are shown by default; HideAgainstStructure hides them if you prefer.
  • Waiting for a confirmation on a lower timeframe (for example a BOS on M5 after an H1 signal) did not help in our tests: the confirmed signals were the good ones, but by the time of the confirmation the price had already moved and the later entry gave the advantage back.

4. THE PROBABILITY - WHAT IT MEANS

  • For every closed past case of the same type (OB, OB+FVG, RANGE OB, with or without rejection, after liquidity taken) the indicator checks what came first: 1R / 2R or the SL.
  • 1R = the SL distance, 2R = twice the SL distance. n = number of past cases. With fewer than MinCases cases it shows "not enough data".
  • It is calculated walk-forward: each case uses only what was known at that time. It is a description of the past on this symbol and timeframe, not a prediction.
  • Use it to compare: which zone types and timeframes have worked better on the symbol you trade.

5. FVG, STRUCTURE AND LIQUIDITY - THE CONTEXT

These show what just happened on the chart. In our tests they did not make the signals better on their own, so use them as context, not as filters:

  • FVG: a gap between candle 1 and candle 3 of a strong move. An OB with an FVG is drawn with a frame (OB+FVG).
  • BOS: a close beyond the last swing high / low in the direction of the structure - the trend continues.
  • CHoCH: the first close beyond a swing against the previous structure - a possible trend change.
  • BSL / SSL: untaken swing highs / lows where stop orders rest. EQH / EQL = equal highs / lows (thicker line).
  • Taken liquidity: a dotted faded line and "$" where price went beyond the level.
  • "!" next to an arrow: liquidity on the same side was taken on the signal candle or the candles before it (LiqCautionBars). In our tests these signals were weaker.

6. A PRACTICAL WAY TO USE IT

This is a tool for manual trading, not a system that takes every arrow. What we found when we developed it (XAUUSD, H1 2020-2026, M5 / M15 2025-2026, costs included):

  • Order block zones are real levels: price reacted from them clearly more often than from random candles, in every year we tested. Use them for where to look, where to put the stop and where to take profit.
  • Waiting for the rejection close was better than entering at the first touch.
  • RANGE OB on H1 was the strongest signal type. Many traders use H1 for the zones and the direction and a lower timeframe (M5 / M15) for the entry.
  • All signals together are only about breakeven after costs. Taking every arrow is not a strategy.
  • When signals come in both directions within a few candles, price is between two zones: better wait.
  • Signals with "!" (right after liquidity on the same side was taken) were weaker.

Past results do not guarantee future results. Check the probability on your own symbol and timeframe, and test on a demo account first.

7. RISK

  • The SL is behind the zone: typically about 1.3 ATR for an OB and about 3 ATR for a RANGE OB. On D1 / H4 this is a large distance in price, but it is normal for the timeframe - an H1 stop is many times smaller in price.
  • Size the position from the SL distance, not from a fixed lot: the tooltip and the SL label show the distance in price, in ATR and in money for MoneyLot (0.01 by default). Keep the money at risk the same on every timeframe.
  • Two or three losses in a row are normal with any setup that wins about half of the time.

8. RISK : REWARD - THE MATH

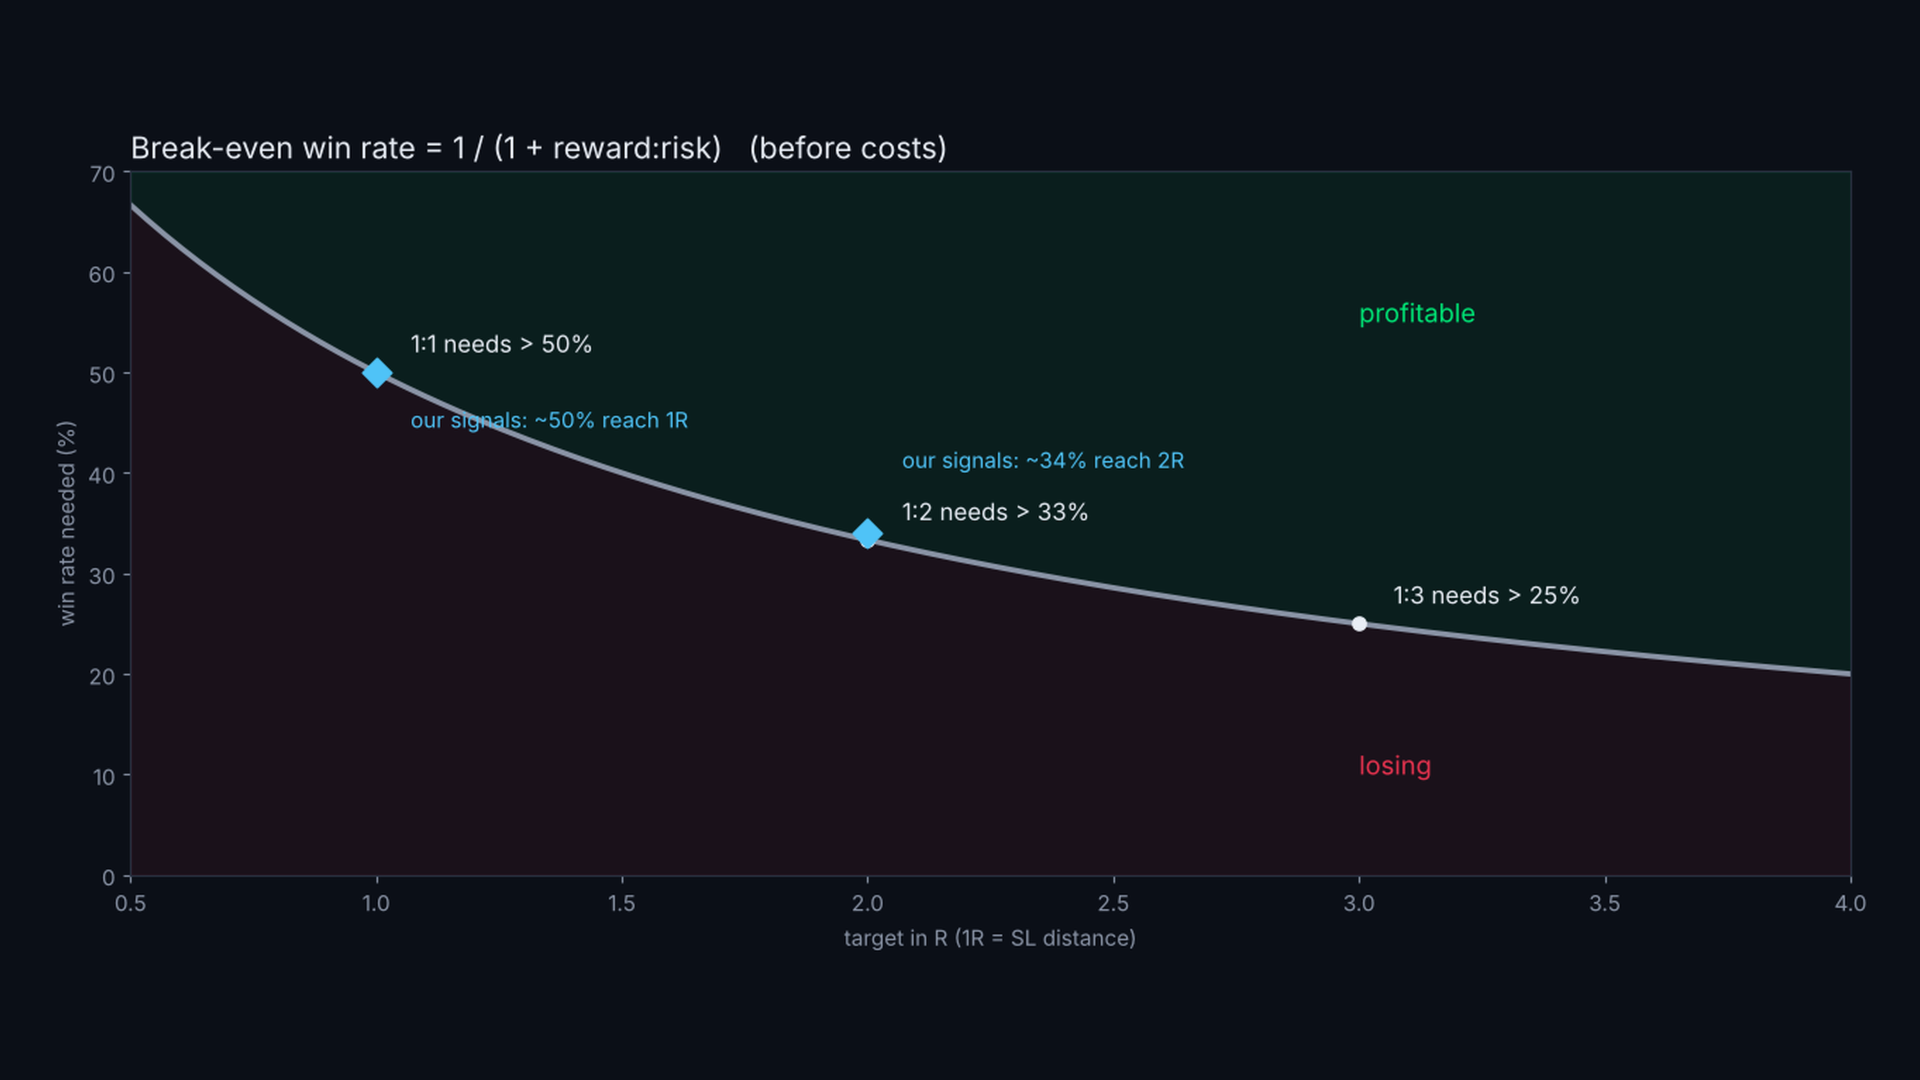
With a fixed target, a setup is profitable only if it wins more often than this (before costs):

  • 1:1 (target = 1 x SL distance): more than 50% of the trades
  • 1:2: more than 33%
  • 1:3: more than 25%

The signals of this indicator reached 1R in about 50% and 2R in about 34% of the cases in our tests - that is about breakeven with a 1:1 or 1:2 target once spread and commission are paid. So:

  • Do not use small targets. Aim for at least 1:2, better 1:3, and let the trade reach the next zone or liquidity level.
  • In our tests the best results came from RANGE OB on H1 (positive at 1:2 and 1:3) and from the higher timeframes (D1). Plain OB signals on M5 were negative at every target.
  • The probability in the label (1R % / 2R %) tells you which targets made sense on your symbol and timeframe: if 2R % is clearly above 33%, a 1:2 target has worked there.

9. FAQ

  • Does it repaint? No. Zones appear after the confirming candle closes, signals after the rejection candle closes. Only the hollow "possible" arrow on the open candle can disappear.
  • Why does the first load take a few seconds? The statistics are calculated on StatsBars bars. Reduce StatsBars for a faster start.
  • Why "not enough data"? There are fewer than MinCases past cases of this type on the chart. Load more history or use a lower timeframe.
  • The session names (Asia, London, NY) use the server time GMT+2 / GMT+3 that most brokers use.
  • Should I close the trade on a CHoCH against it? In our tests this did not help: it cut as many winning trades as losing ones. Use BOS / CHoCH as context.
  • What does the button do? It hides / shows everything the indicator draws. Signals, statistics and alerts keep working.

INPUT PARAMETERS

Order blocks

  • ShowZones, FVGMinATR (min gap size for OB+FVG), ZoneMaxBars (expiry), MaxZonesShown, UsedZonesShown, zone colors and transparency, FrameWidth, ZoneLabels, ShowNewOBMark.

Range order blocks

  • ShowRangeOB, RangeBars (12), RangeMaxATR (3.0), RangeZonesShown, colors, RangeTransparency, SkipInsideRange, HideAgainstStructure (off: hide signals against the last BOS / CHoCH; in tests this gave fewer signals, not better ones).

Signals

  • ShowSignals, SignalsShown (10), BuyColor, SellColor, ArrowSize, ShowSL, SLMode, SLMaxATR (1.5), SLBufferATR (0.1), MoneyLot (0.01), SLLineBars, SLWidth, ShowSignalLabel, LabelsShown, MarkAfterLiquidity, LiqCautionBars, CautionColor, ShowPossible, PossibleColor, PossibleBlink.

Probability

  • ShowProbability, MinCases (30), MaxHoldBars (300), ShowPanel (statistics panel), ShowButton, PanelFontSize.

Structure

  • ShowBOS, ShowCHoCH, PivotBars (3), colors, style, width, StructShown.

Liquidity

  • ShowLiquidity, LiqLevels, EqualTolATR, BSLColor, SSLColor, styles and widths, ShowTaken, TakenShown.

General

  • HistoryBars (objects only for the last N bars), StatsBars (statistics on the last N bars), TextColor (None = automatic).

Alerts

  • AlertPopup, AlertPush, AlertSignal, AlertPossible, AlertCancel, AlertNewOB, AlertTouch, AlertLiquidity.

IMPORTANT

Smart Order Blocks is an analysis tool. It does not open trades. The probabilities describe the past on your chart; they are not a promise for the future. The decision, the stop and the position size are yours.
Önerilen ürünler
Contraction Expansion Meter A clear and powerful volatility indicator that visualizes market contraction and expansion in real time. Based on Bollinger Bands logic, the indicator measures the relative width of the bands and compares it to its own moving average. This creates a highly intuitive oscillator that shows when the market is compressing (contraction / squeeze) or expanding (volatility breakout). What you see on the chart: Histogram Blue bars → Expansion (volatility is increasing) Red ba
Hrum
Yvan Musatov
4 (1)
The Hrum indicator was created to neutralize temporary pauses and rollbacks. It analyzes price behavior and, if there is a temporary weakness in the trend, you can notice this from the indicator readings, as in the case of a pronounced change in trend direction. Entering the market is not difficult, but staying in it is much more difficult. With the Giordano Bruno indicator and its unique trend line, staying on trend will become much easier! Every rise and every fall is reflected in your emoti
Heikin –  Smart Volume Support Overview It provides enhanced visualization of price trends and momentum, with advanced customization options, theme integration, and seamless compatibility with volume-based tools. Designed for manual traders, scalpers, and algorithmic analysts, this indicator offers superior clarity for trend detection, momentum strength, and reversal spotting — especially when combined with volume analysis. Key Features Pure Heikin Ashi Candles Generated natively (not overlays
AlgoKing Chandelier Exit Indicator (MT5) The Chandelier Exit Indicator is a volatility based indicator that maximizes returns using the Average True Range (ATR) value and the highest high or lowest low of a period. Benefits Should be used as a trailing stop. Helps you exit a position when you have a respectable profit. Identifies a high probability of a trend reversal when the price moves against the prevailing trend by a distance equal to 3x the average volatility. Join the AlgoKing Lightning
**News Monitor Allert** Trading the financial markets without being aware of the economic calendar is a critical mistake that leads to unnecessary losses. Even the best technical strategy can fail instantly during a high-impact news release. This utility provides the ultimate solution, acting as a safeguard for your capital. One of the most powerful features of this indicator is its ease of use. Unlike many other tools on the market, **you do not need to configure any external links, download
Volume Bands Chart
Rafael Caetano Pinto
This indicator marks the relevant volume levels among the day. The two relevant levels are the candle with more volume and the period with more volume of lots transacted.  The filled red background is the range of price with the most relevant volume of the day (probably the big player that is command the game). The purple lines shows the range of price with most volume (probably a area where some big player is accumulating before force a market direction). There is also the dot lines that marks
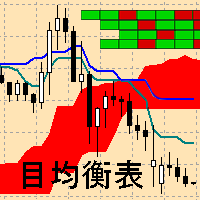
Ichimoku Map (instant look at the markets) - built on the basis of the legendary Ichimoku Kinko Hyo indicator. The task of the Ichimoku Map is to provide information about the market strength on the selected time periods and instruments, from the point of view of the Ichimoku indicator. The indicator displays 7 degrees of buy signal strength and 7 degrees of sell signal strength. The stronger the trend, the brighter the signal rectangle in the table. The table can be dragged with the mouse. The
NeuronSniper is a complete ICT (Inner Circle Trader / smart-money) workspace and setup engine for MetaTrader 5 from Neuron Systems. It maps the whole picture, market structure, liquidity, order blocks, fair value gaps and premium/discount, and then marks one strict, high-quality reversal setup with a fixed risk:reward plan. It is an indicator for chart analysis only: it draws on the chart, it does not place, modify or close trades, it does not send orders, and it does not manage positions or acc
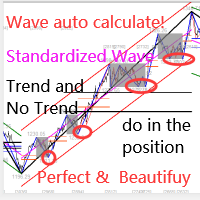
Bu gösterge, pratik ticaret için mükemmel olan otomatik dalga analizine yönelik bir göstergedir! Dava... Not:   Dalga sınıflandırması için Batılı isimleri kullanmaya alışkın değilim. Tang Lun'un (Tang Zhong Shuo Zen) adlandırma kuralının etkisiyle, temel dalgayı   kalem   , ikincil dalga bandını ise   segment   olarak adlandırdım. aynı zamanda segmentin trend yönü vardır. Adlandırma   esas olarak trend segmentidir   (bu adlandırma yöntemi gelecekteki notlarda kullanılacaktır, öncelikle söyleyey
KT DMA is a modified and advanced version of the classic Displaced Moving Averages with buy/sell crossover alerts and a Multi-Timeframe scanner that shows DMA's direction across each real-time time frame. A Displaced Moving Average is a simple moving average that moves ahead or backward in a time frame (either short-term or long-term). It also allows you to predict price movement more accurately. Features Depicts the trend direction using the alignment of three moving averages. Buy/Sell signals
KT Volatility Oscillator MT5
KEENBASE SOFTWARE SOLUTIONS
KT Volatilite Osilatörü, geçmiş ve mevcut piyasa verilerini matematiksel bir formül kullanarak analiz eder ve sonucu bir osilatör formunda gösterir. Yükselen ve azalan dalgalar, varlığın yüksek ve düşük volatilitesine karşılık gelir.  Kısaca, volatilite bir varlığın belirli bir zaman diliminde fiyat dalgalanmalarının ölçüsüdür. Volatilite olmasaydı, piyasada çok az hareket olurdu ve traderlar fiyat değişimlerinden kazanç sağlayamazdı. Forex Piyasasında Volatilite Kullanımı Forex piyasasında vol
Indicator description of Yijing Guaxiang Oscillation Mean Indicator: (1) This Yijing Guaxiang change indicator is based on the Yin-Yang transformation thought of the "I Ching" philosophy in ancient Chinese culture, integrating the results of the long-short game in each candlestick K-line period of the financial trading K-line chart, using China's oldest prediction coding method, in the form of the 64 hexagrams of the I Ching, combining the Yin-Yang of each line of the hexagram with the Yin-Yang
Hurst-YZ Engine measures the one thing those indicators can't: whether the market is structurally trending or structurally mean-reverting, right now. It does this with two pieces of real quant math, the kind used on institutional research desks, not repackaged crossovers. Early-bird pricing active: Only $65 for the next 10 licenses. The price increases by $15 after every 10 copies sold to maintain premium value until it reaches its final target value of $150. Secure your copy at the lowest tie
Shqiponja Gold EA is an advanced automated trading system specifically designed and optimized for Gold (XAU/USD) scalping and trend-following strategies. Built with precise price action mechanics, it targets structural market movements to capture high-probability entries. Key Features: - Optimized for XAU/USD: Tailored specifically to handle the volatility and price action of Gold. - Smart Trend Filtering: Integrates multi-timeframe structural analysis to avoid false breakouts. - Risk Manageme
KT Connors RSI MT5
KEENBASE SOFTWARE SOLUTIONS
KT Connors RSI is a modified and more advanced version of the original Connors RSI developed by Larry Connors. It was designed to help traders generate trade signals based on short-term price movements. The Connors combine the standard RSI calculation with two additional elements: a short-term RSI, ROC, and a moving average. Features Provides more transparent and more actionable buy and sell signals using the overbought/oversold zones. Incorporates short-term RSI and moving average, providing
Horus Market Structure is an analysis indicator for MetaTrader 5. It combines price structure, liquidity and trend context in one chart. FEATURES - BOS and CHoCH structure marks, confirmed pivots and liquidity sweeps. - Automatic multi-swing and best-pair trendlines. - Scored analytical BUY/SELL marks with suggested Entry, SL and TP1-TP3 levels. - Multi-timeframe Order Blocks and Fair Value Gaps. - Adaptive MAX BUY/SELL zones, Stochastic K/D on price, swing zigzag and tick-volume profile. - Mul
VWAP Breakout Entry draws an anchored VWAP from market structure pivots and marks trade entries when price retests it after a breakout. Every signal comes with a stop loss and three take-profit levels, and the chart shows the full trade the way a charting platform would. Symbol : GBPUSD Timeframe : M15 / 15 Minutes Default settings are optimized for GBPUSD on M15 How it works The indicator detects swing highs and lows and anchors a VWAP to the latest structure leg. When price breaks structure a
Buy Sell Signal MTF - Advanced Reversal Indicator Buy Sell Signal MTF is a highly optimized, professional-grade trend reversal indicator designed for MetaTrader 5. It uses a sophisticated dual-layer algorithm combining Volatility (ATR) and Momentum (Stochastic Oscillator) to pinpoint highly accurate entry levels without cluttering your chart with false signals. Whether you are a scalper, day trader, or swing trader, this indicator is built to deliver precision and reliability. The signals are 1
FREE
MT5 için "Üstel Trend Histogramı" Kripto Forex Göstergesi, Yeniden Boyama Yok. - Üstel Trend Histogramı göstergesi, trend tespiti amacıyla oldukça etkilidir. - En iyi kullanım şekli, Destek/Direnç Seviyeleri ve Yeniden Test tekniğiyle birleştirmektir (resimlere bakın): - Gösterge yeni bir trend tespit ettiğinde, yerel SR seviyesini bulun ve o bölgenin Yeniden Test edilmesini bekleyerek ilgili bekleyen emri düzenleyin. - Yeni trend yükselişteyse, Alış Limiti bekleyen emri düzenleyin; yeni trend
SMC Inducement Flow is a MetaTrader 5 indicator designed to visualize market structure, inducement sweeps, Fair Value Gaps and compression momentum in one clean workflow. Core idea: the indicator helps traders follow structural flow by marking BOS and CHoCH events, tracking active inducement levels, highlighting sweep behavior and exposing useful buffers for discretionary analysis or EA development. Launch price: this product is published with an introductory promotional price. The price may be
Avez-vous toujours rêvé de pouvoir entrer sur le marché juste après la clôture d'une bougie… et de voir le marché évoluer immédiatement dans votre sens ? Avez-vous toujours souhaité détecter les retournements de tendance plus tôt, éviter les faux signaux et, surtout, saisir les tendances longues avant la majorité des traders ? Aujourd'hui, je vais vous présenter mon nouvel indicateur : Prophète du retournement intelligent. Contrairement aux indicateurs traditionnels qui réagissent avec un certa
FlatOut Movings Robot: Yatay piyasanın (flat) mutlak kontrolü. Trendde güvenli navigasyon. Hareketli ortalamalara (moving average) dayalı indikatör stratejilerinin ortak bir kabusu vardır. Piyasa faz değiştirdiği an, bakiyeniz erimeye başlar. Klasik hareketli ortalamalar, yatay piyasada onlarca sahte kesişim üretir. Standart filtreler ise acımasızca gecikir. Geceleri terminal başında stres içinde oturur ve hareketin tam bitiş noktasında işleme girersiniz. Bu yazılım belirli bir görevi çözmek iç
McGinley Trend Pullback Strategy - Multi-Average Trend and Pullback System McGinley Trend Pullback Strategy is an automated trading system that trades only when four averages line up in trend order and price confirms against the session VWAP. It enters on a fresh alignment and on pullback bounces off the McGinley Dynamic line, and it uses a Zero-Lag EMA filter to avoid catching the first move after a reversal. Every trade has a stop loss and a take profit. It does not use martingale, grid strat
Your Treand
Tatiana Savkevych
The Your Trend indicator not only signals an immediate buy or sell. It indicates a short-term and long-term trend. operations. The simplest way to use the indicator is to open a trade in the direction of an existing trend. The indicator allows you to study the real and historical market trends in more detail! Shows the opening points of transactions for sale or purchase, and also indicates the direction of the trend on: short-term and long-term periods. The analysis is based on the selected tim
If you are unsure how to use this indicator, please feel free to reach out to me. I will explain it to you and provide reading materials to help you make the most of it. TD Sequential Scanner: An Overview The TD Sequential scanner is a powerful technical analysis tool designed to identify potential price exhaustion points and trend reversals in financial markets. Developed by Tom DeMark, this method is widely used by traders to gauge market cycles and potential turning points with precision. Ho
MetaForecast M5
Vahidreza Heidar Gholami
5 (3)
MetaForecast, fiyat verilerindeki harmonileri kullanarak herhangi bir piyasanın geleceğini tahmin eder ve görselleştirir. Piyasa her zaman tahmin edilemezken, fiyatlarda bir desen varsa, MetaForecast geleceği mümkün olduğunca doğru bir şekilde tahmin edebilir. Benzer ürünlere göre, MetaForecast piyasa eğilimlerini analiz ederek daha kesin sonuçlar üretebilir. Giriş Parametreleri Past size (Geçmiş boyut) MetaForecast'ın gelecekteki tahminler oluşturmak için kullandığı çubuk sayısını belirtir. Mo
# Momentum Curvature - Acceleration versus velocity *Category: Momentum | Difficulty: intermediate | Window: separate window below the chart | Markets: Universal (Forex, indices, commodities, crypto, stocks) | Suggested timeframes: M15, M30, H1, H4, D1* ## Short description > Measures price acceleration, the second derivative of the smoothed series, and compares it with velocity. It detects loss of thrust before direction changes. ### Overview Anyone who drives knows the brake pedal acts o
"Battles between bulls and bears continue to influence price development long after the combat has ended, leaving behind a messy field that observant technicians can use to manage risk and find opportunities. Apply "trend mirror" analysis to examine these volatile areas, looking for past action to impact the current trend when price turns and crosses those boundaries." RSI Mirrors and Reflections is a robust technique using multiple RSI periods, mirrors and reflections based on RSI values to ind
Crypto Hades Adaptive-Swing  Dynamic Fibonacci Matrix & MTF Trend Alignment Crypto Hades Adaptive-Swing  is an elite institutional-grade Expert Advisor designed specifically for extreme cryptocurrency volatility (BTCUSD, ETHUSD). Named after Hades, the Greek god of the underworld, this EA waits patiently for deep pullbacks and strikes at the most advantageous "underworld" price levels using a dynamic mathematical matrix. Unlike standard trend followers that buy at the top, Hades uses a Multi-
Bu ürünün alıcıları ayrıca şunları da satın alıyor
Trend Sniper X
Sarvarbek Abduvoxobov
4.86 (44)
Trend Sniper X , tüccarların trend yönünü ve olası dönüş noktalarını netlik ve hassasiyetle belirlemelerine yardımcı olan MetaTrader 5 için çoklu zaman dilimli bir trend takip göstergesidir. MT4 için: https://www.mql5.com/en/market/product/193245 Fiyat Bilgisi: Mevcut fiyat tanıtım amaçlıdır ve gelecek güncellemeler ile yeni özellikler yayınlandıkça değişebilir. Bonus Fırsatı: Bu indikatör için ÜCRETSİZ Oto-Trade Assistant EA'yı almak için lütfen satın aldıktan sonra yazara mesaj gönderin. Code
Şehre yeni bir Kral geldi - Gösterge + Emir Yönetimi göstergeleri (TP1 + TP2 + TP3) + Opsiyonel Telegram Sinyal Gönderici DAHİL (ÜCRETSİZ) (TAM TRADING ve SİNYAL SİSTEMİ) Altın için en iyi EA’mız: Gold Slayer Bu gösterge; gelişmiş bir strateji, özelleştirilebilir emir yönetimine sahip bir trading sistemi ve envelope uzantılarını birleştiren bir mean reversion sistemi içerir. Ayrıca RSI gibi birçok akıllı onay filtresiyle desteklenerek yüksek olasılıklı dönüş girişlerini AL ve SAT sinyalleriyle y
Smart Trend Trading System — MetaTrader 5 Satın aldıktan sonra Smart Universal Expert Advisor'ı ÜCRETSİZ edinmek ve beraberinde çevrimiçi kurs, PDF kılavuzu ve özel gruba erişim almak için MQL5 üzerinden bana mesaj gönderin. STTS; trend yönünü, giriş ve çıkış sinyallerini, dönüş bölgelerini ve önemli fiyat seviyelerini doğrudan grafiğinizde bir araya getirir. Sistemi manuel işlemler için kullanabilir veya ayrı bir uyumlu EA’yı bağlayarak seçtiğiniz ayarlarla otomatik işlem gerçekleştirebilirsini
Zoryk Gold
Reda El Koutbane
4.79 (19)
ZORYK — MetaTrader 5 İçin Gelişmiş XAUUSD Sinyal Sistemi Bu hissi biliyorsunuz. Altını analiz etmek için uzun zaman harcarsınız. Doğru giriş noktasını beklersiniz. Sonunda işlemi açarsınız ve fiyat hemen aleyhinize hareket etmeye başlar. İşlemi çok erken kapatırsınız, Stop Loss seviyesini değiştirirsiniz veya birkaç saniye tereddüt edersiniz. Daha sonra piyasa, başlangıçta beklediğiniz hedefe tam olarak ulaşır; ancak siz artık işlemin içinde değilsinizdir. Sorun her zaman yön değildi. Asıl sorun
İşlem avantajınızı görüş alanınıza alın! M5 Sniper , MeanFX tarafından geliştirilen yeni bir indikatördür. Hassas işlem sinyallerini adaptif TP/SL seviyeleriyle birleştirir — bunun sonucunda mümkün olan en iyi istatistiksel işlemleri oluşturur! Fiyat her 5 satın alımda bir artar, bir sonraki fiyat 69$ olacaktır. Satın aldıktan sonra ipuçları/rehber ve bonus EA almak için bana mesaj gönderin. Onu öne çıkaran nedir? Kanıtlanmış istatistiksel performans Gold XAUUSD üzerinde ( neredeyse her varlıkta
Entry Points Pro, emri vermeden önce nereden gireceğinizi, stopu nereye koyacağınızı ve hangi lotla işlem yapacağınızı gösterir. FİYAT Şu anda 199 USD: bu fiyattan 10 kopya, sonra 249 USD. Nihai fiyat 349 USD. Paramı piyasalarda işlem yaparak kazanıyorum ve bunu gösteriyorum, bu yüzden bu indikatörü herkese satmak zorunda değilim. Bu, kendi kafasıyla düşünen traderlar için bir araç, sihirli bir düğme değil. Kırılım yoksa işlem de yok. Gri ok, iptal edilmiş bir sinyaldir: fiyat sinyal mumunu kır
Ultra Indicator
Ihor Otkydach
5 (1)
ULTRA, “hepsi bir arada” prensibiyle çalışan bir teknik göstergedir; piyasayı bağımsız olarak analiz eder, işlem sinyalleri üretir, stop-loss emirlerinin verileceği seviyeleri gösterir ve kârı garantilemek ya da zararı en aza indirmek için işlemlerin ne zaman kapatılması gerektiğini önerir. Başka bir deyişle, piyasayı nasıl analiz edeceğinizi bilmeseniz, seviyeleri (stop-loss'unuzu nereye koyacağınızı) belirleyemeseniz ya da para yönetimi konusunda zorluk yaşasanız da fark etmez. ULTRA tüm bunla
Gann Made Easy , bay teorisini kullanarak ticaretin en iyi ilkelerine dayanan, profesyonel ve kullanımı kolay bir Forex ticaret sistemidir. WD Gann. Gösterge, Zararı Durdur ve Kâr Al Seviyeleri dahil olmak üzere doğru SATIN AL ve SAT sinyalleri sağlar. PUSH bildirimlerini kullanarak hareket halindeyken bile işlem yapabilirsiniz. Satın alma işleminden sonra, alım satım talimatlarını ve harika ek göstergeleri ücretsiz olarak almak için lütfen benimle iletişime geçin! Muhtemelen Gann ticaret yöntem
SuperScalp Pro
Van Minh Nguyen
4.54 (37)
SuperScalp Pro - Professional Multi-Layer Confluence Scalping System SuperScalp Pro, klasik Supertrend sistemini birden fazla akıllı doğrulama filtresiyle geliştiren ileri düzey bir scalping göstergesidir. Yanlış sinyalleri önemli ölçüde azaltırken başarı olasılığı daha yüksek Buy/Sell işlem fırsatlarını belirlemenize yardımcı olur. Buy ve Sell okları doğrudan grafik üzerinde net bir şekilde görüntülenir. ATR tabanlı Stop Loss ve Take Profit seviyeleri de gerçek zamanlı olarak otomatik hesaplanı
GoldenX Entry MT5
VividMind Digital Solutions
5 (17)
GoldenX Entry, adaptif Smart Entry Trend algoritmasına, sinyal skorlaması sistemine, piyasa rejimi algılayıcısına ve volatilite filtresine sahip bir MT5 indikatörüdür. Her sinyal; hesaplanmış bir giriş seviyesi, üç adet Take-Profit seviyesi (TP1, TP2, TP3) ve bir Stop-Loss seviyesi içerir. Farklı piyasa koşullarına uyum sağlamak için tasarlanmış çok katmanlı analitik yapı üzerine kuruludur ve yerleşik optimizasyon aracı ile istatistik takip sistemini birleştirir. Risk-ödül (RR) metrikleri ve geç
Gold Trend Coach MT5
Cristhian Alexander Gaibor Cuasquer
4.27 (11)
MetaTrader 5 için altında (XAUUSD) repaint yapmayan al-sat sinyalleri. Her sinyal bir stop loss ve üç take profit ile gelir. BOS ve CHoCH içeren Smart Money Concepts filtresi sayesinde yapıya karşı değil, yapıyla birlikte işlem açarsın. Paneldeki canlı Mentor, girişten TP3'e kadar her adımda sana yol gösterir. Alarmlar doğrudan telefonuna ve kendi Telegram kanalına gelir. İşte Gold Trend Coach. Artık asla yalnız işlem yapma. Satın alımla birlikte ÜCRETSİZ ALICI KİTİ: 1. Telegram Alert Bridge: s
SMC Intraday Formula
VividMind Digital Solutions
5 (26)
Önce dürüst olalım. Hiçbir gösterge tek başına sizi kârlı yapmaz. Eğer biri size aksini söylüyorsa, size bir hayal satıyordur. Mükemmel al/sat okları gösteren her gösterge, kusursuzmuş gibi görünecek şekilde yapılabilir — sadece geçmişin doğru bir bölümünü yakınlaştırıp kazanan işlemleri ekran görüntüsü almanız yeterlidir. Biz bunu yapmıyoruz.  SMC Intraday Formula bir araçtır. Piyasa yapısını sizin için okur, en yüksek olasılıklı fiyat bölgelerini belirler ve şu anda akıllı paranın izinin nası
Boba Analysis Suite
Trade Ready Solutions LLC
5 (2)
Boba Analysis Suite Boba Analysis Suite, MetaTrader 5 için geliştirilmiş bir analiz göstergesidir. Piyasa yapısını, önemli fiyat bölgelerini ve genel piyasa bağlamını tek bir grafik görünümünde bir araya getirir. Trader ve trading eğitmeni olarak edinilen uygulamalı deneyimden yola çıkarak geliştirilmiştir. Piyasanın yönünü değerlendirme, önemli seviyeleri belirleme ve birden fazla zaman dilimini birlikte inceleme gibi adımlardan oluşan sistematik bir analiz sürecini destekler. Piyasa Bağlamını
Sonraki Güncelleme — Sürüm 2.52 Çok Yakında! [YENİ] Piyasa Analizinizi ve İşlem Sürecinizi Geliştirmek İçin Tasarlanmış 4 Büyük Yeni Özelliğe Hazır Olun İşlem ihtiyaçlarınızı karşılamak üzere tasarlanmış 4 yeni özellikle piyasa analizini bir üst seviyeye taşıyoruz. İşte yeni özellikler: 1. TRADE OVERVIEW DASHBOARD 2. CONFLUENCE AT ZONE 3. STRONG & WEAK HIGH/LOW 4. OTE 1. TRADE OVERVIEW DASHBOARD Piyasanın genel görünümünü daha kolay anlamanıza yardımcı olan, işlem kararlarınızı desteklemek için
FX Power MT5 NG
Daniel Stein
5 (33)
FX Power: Daha Akıllı Ticaret Kararları için Para Birimlerinin Gücünü Analiz Edin Genel Bakış FX Power , her piyasa koşulunda başlıca para birimlerinin ve altının gerçek gücünü anlamak için vazgeçilmez bir araçtır. Güçlü para birimlerini alıp zayıf olanları satarak, FX Power ticaret kararlarınızı basitleştirir ve yüksek olasılıklı fırsatları ortaya çıkarır. İster trendlere sadık kalın ister Delta'nın aşırı değerlerini kullanarak tersine dönüşleri öngörün, bu araç ticaret tarzınıza mükemmel bir
M1 Sniper MT5
Oleg Rodin
5 (7)
M1 SNIPER   kullanımı kolay bir işlem göstergesi sistemidir. M1 zaman dilimi için tasarlanmış bir ok göstergesidir. Gösterge, M1 zaman diliminde scalping için bağımsız bir sistem olarak kullanılabilir ve mevcut işlem sisteminizin bir parçası olarak kullanılabilir. Bu işlem sistemi özellikle M1'de işlem yapmak için tasarlanmış olsa da, diğer zaman dilimleriyle de kullanılabilir. Başlangıçta bu yöntemi XAUUSD ve BTCUSD ticareti için tasarladım. Ancak bu yöntemi diğer piyasalarda işlem yaparken de
FiboSniper Pro
Van Minh Nguyen
5 (4)
FiboSniper Pro – Multi-Filter Fibonacci System with Auto SL/TP and Control Panel FiboSniper Pro, seçilmiş Buy ve Sell sinyalleri üretmek için dinamik Fibonacci Envelopes ile birden fazla doğrulama filtresini birleştiren teknik bir göstergedir. Fibonacci seviyeleri Moving Average ve ATR temel alınarak hesaplanır ve ardından ADX, EMA, RSI, ATR, Volume, Time ve Candle yapısı ile filtrelenir. Gösterge, ATR tabanlı otomatik Stop Loss ve Take Profit seviyelerini doğrudan grafik üzerinde görüntüler ve
Auto Optimized SpeedAngle , sürekli İleriye Dönük Optimizasyon (Walk-Forward Optimization, WFO) yoluyla eğri uydurmayı (curve-fitting) ortadan kaldıran kurumsal düzeyde bir momentum vektörleme sistemidir. Piyasa rejimleri değiştiğinde etkinliğini yitiren statik girdilere güvenmek yerine, gösterge, örneklem dışı (Out-of-Sample, OOS) doğrulama kullanarak parametrelerini dinamik olarak yeniden kalibre eder ve böylece gösterilen sinyallerin geçmişteki rastgele anomalileri değil, gerçek bir istatisti
Sqn Max Indicator Sqn Max is an exclusive indicator to trade the market with high effectiveness. The indicator is based on price action, volatility and trend. This indicator is as simple as possible but not too simple. The indicator can generate alerts to ease the trading process. You don't have to stay all day in front of your screen. The indicator can be used with any class of assets and with any time frame. It is possible to achieve better results trading our list of selected assets. We achi
Smc Pro ToolKit
Talal N Z Aljarusha
5 (14)
SMC PRO TOOLKIT — SMART MONEY ANALYSIS & STRUCTURED TRADE PLANNING SMC Pro ToolKit is a professional Smart Money Concepts analysis workspace for MetaTrader 5. It combines market structure, multi-timeframe analysis, institutional price zones, setup evaluation, confirmation tools, volume context, alerts, and risk planning inside one organized chart environment. One workspace. Multiple layers of confirmation. One structured trading plan. OPEN COMPLETE USER GUIDE MULTI-CONDITION SETUP ENGINE At
SIO Oscillator: Kendi Kendini Optimize Eden Yarı Varyans Dengesizlik Osilatörü İndikatörü satın alın, ona dayalı Uzman Danışmanı (EA) ÜCRETSİZ edinin. Çoğu osilatör, tüm fiyat hareketlerini aynı şekilde değerlendirir. SIO ise yükseliş ve düşüş baskısını birbirinden ayırır ve aralarındaki dengesizliği ölçerek piyasayı gerçekte kimin kontrol ettiğini gösterir: alıcılar mı, satıcılar mı. Dengesizlik bir uç noktaya ulaştığında SIO, giriş, Stop Loss ve Take Profit seviyeleriyle birlikte net bir sinya
Power Candles MT5
Daniel Stein
4.58 (12)
Power Candles V3 - Kendi Kendini Optimize Eden Güç Göstergesi Power Candles V3, döviz ve enstrüman gücünü, eklendiği her grafikte eyleme geçirilebilir bir ticaret planına dönüştürür. Sadece mumları renklendirmek yerine, arka planda canlı bir otomatik optimizasyon çalıştırır ve önünüzdeki sembol için en iyi Stop Loss, Take Profit ve sinyal eşiğini size sunar. Tek bir tıklama ile canlı ticarete uyarlanır - giriş, Stop Loss ve Take Profit ışınları grafikte tam fiyatlarla görünür ve uyarılar yön bil
Atomic Analyst MT5
Issam Kassas
4.51 (65)
Atomic Analyst — MetaTrader 5 Satın aldıktan sonra Smart Universal Expert Advisor'ı ÜCRETSİZ edinmek ve beraberinde çevrimiçi kurs, PDF kılavuzu ve özel gruba erişim almak için MQL5 üzerinden bana mesaj gönderin. Atomic Analyst; fiyat hareketini, trend yönünü, giriş ve çıkış sinyallerini, Stop Loss ve birden fazla Take Profit seviyesini doğrudan grafiğinizde bir araya getirir. SİNYALİ GÖRÜN. İŞLEM KOŞULLARINI ANLAYIN. Atomic Analyst, analizini anlaşılır görsel bilgiler halinde sunar: • Olası gir
Unix Scalper
Issam Kassas
4 (4)
Unix Scalper — MetaTrader 5 Satın aldıktan sonra Smart Universal Expert Advisor'ı ÜCRETSİZ edinmek ve beraberinde çevrimiçi kurs, PDF kılavuzu ve özel gruba erişim almak için MQL5 üzerinden bana mesaj gönderin. İşlem fırsatını belirleyin. Planı görün. Nasıl işlem yapacağınıza karar verin. UNIX Scalper; piyasa analizini, BUY/SELL/WAIT kararlarını ve Entry, Stop Loss, TP1 ve TP2 seviyelerini düzenli bir panelde bir araya getirir. SİNYALİ VE PLANI GÖRÜN • Net kararlar: BUY, SELL veya WAIT. • Belir
Tokyo mt5 Indicator
Vasiliy Strukov
5 (15)
Tokyo Indicator; trend yönü, potansiyel işlem sinyalleri ve piyasa koşulları hakkında net ve görsel bir genel bakış sunar. Renk kodlu ve kademeli trend çizgisi, yükseliş evrelerini (mavi) düşüş evrelerinden (macenta) ayırt eder. Trend değiştiğinde, buna karşılık gelen yön okları potansiyel alım ve satım fırsatlarını vurgular. Entegre bir panel; mevcut sinyali, piyasa eğilimini, momentumu, volatiliteyi ve sinyal kalitesini tek bir kullanışlı görünümde bir araya getirir. Bu sayede yatırımcılar, fa
Astral Structure
Ottaviano De Cicco
Astral Structure Kurulumu değerlendirin. İlk planı görün. Lansmana özel - $99. Lansman sonrasında $149. Bir piyasa yapısı kurulumu birkaç soruyu birlikte getirir: Geniş görünüm uyumlu mu, stop referansı nerede ve hedefler nasıl tanımlanıyor? Astral Structure, kararlarını piyasa yapısına dayandıran takdire dayalı yatırımcılar için bu soruları tek çalışma alanında toplar. İlgili kuruluma odaklanın. En son uygun kurulumu, yönünü ve koşulları karşılayıp karşılamadığını birlikte inceleyin. Zaman dili
Crystal Heikin Ashi Signals
Muhammad Jawad Shabir
5 (5)
Crystal Heikin Ashi Signals—Professional Trend & Signal Detection Indicator Advanced Heikin Ashi Visualization with Intelligent Signal System for Manual & Automated Trading Final Price: $149 ---------> Price goes up $10 after every 10 sales . Limited slots available — act fast . Overview User Guide PDF Crystal Heikin Ashi Signals is a professional-grade MetaTrader 5 indicator that combines pure Heikin Ashi candle visualization with an advanced momentum-shift detection system. Designed for both m
Trend Catcher ind mt5
Ramil Minniakhmetov
5 (18)
TREND YAKALAYICI GÖSTERGE Trend Yakalayıcı Gösterge, yazarın tescilli ve özelleştirilmiş uyarlanabilir trend analiz göstergelerinin bir kombinasyonunu kullanarak piyasa fiyat hareketlerini analiz eder. Kısa vadeli gürültüyü filtreleyerek ve temel momentum gücüne, volatilite genişlemesine ve fiyat yapısı davranışına odaklanarak gerçek piyasa yönünü belirler. Ayrıca, hareketli ortalamalar, RSI ve volatilite filtreleri gibi yumuşatma ve trend filtreleme özelleştirilmiş göstergelerinin bir kombina
Çoklu Para Birimi Güç ve Momentum Göstergesi MT5 Dynamic Forex28 Navigator, uzun süredir popüler olan göstergelerimizin evrimidir ve beşinin gücünü bir arada sunar: Advanced Currency Strength28 Indicator (700 inceleme) Advanced Currency IMPULSE with ALERT (530 inceleme) Currency Strength EXOTICS GOLD Impulse with Alert CS28 Combo Signals (son Bonus) Dört gösterge satın alıp grafiklerinizde üst üste yığmanıza gerek yok. Hepsi tek bir güçlü göstergede birleşiyor: 28 Forex paritesinin gücü, onları
Scalper Vault, gün içi işlemlerde istikrar yakalamak isteyen yatırımcılar için tasarlanmış, güçlü ve tam donanımlı bir alım satım sistemidir. Bu yüksek hassasiyetli gösterge; hem Forex hem de İkili Opsiyon yatırımcıları için kurumsal düzeyde analizler sunan, bağımsız ve eksiksiz bir alım satım sistemi işlevi görür. SATIN ALIM İŞLEMİNDEN SONRA BENİMLE İLETİŞİME GEÇİN; ALIM SATIM İPUÇLARIMI VE HARİKA BİR BONUSU ALIN! Tahmin yürütme zorunluluğunu ve karmaşık manuel analiz süreçlerini ortadan kaldı
Yazarın diğer ürünleri
MACD Adaptive is a MACD that adjusts its periods to the market and never repaints. Every bar is calculated only with the data available up to that bar. If you reload the chart or restart the terminal, the history looks exactly the same as it did live. What you see in the past is what you would have seen in real time. MAIN FEATURES Adaptive periods: shorter in a clean trend, longer in choppy noise. Can be switched off for a classic MACD. Buy / Sell arrows on a CLOSED bar (final, never disappear)
FREE
Plan, test and track your trades directly on the MT5 chart: a long / short position tool with partial take profits, a moving stop loss, a trading journal, statistics and alerts. Click LONG or SHORT, click on the chart where the entry should be, drag the SL and TP - and you see the risk and the reward in money, the R:R and the lot for your risk %. Press SAVE and the tool stays on the chart: it is tracked candle by candle on the history and live, and every saved trade goes into the statistics and
A free long / short position tool for MetaTrader 5: click where the entry should be, drag the stop loss and the take profit, and see the risk and the reward in money, the R:R and the lot for your risk % of the balance. No more counting points and pip values before every trade: the tool shows the lot that keeps your risk at the % you choose, with the commission included. The indicator does not open or close trades. It is a planning tool, the decision is yours. MAIN FEATURES Click to place: press
FREE
A free chart-pattern indicator for MetaTrader 5 that tells you the truth about each pattern: how often it really reached 1R and 2R on your symbol and timeframe, next to what a random entry with the same stop did. Most pattern indicators only draw arrows. This one measures them. Every signal shows its historical win % and the "random %" for the same direction and stop size, so you can see at once whether a pattern has an edge on the chart you trade - or not. The indicator does not open or close t

FREE
Filtrele:
Değerlendirme yok
Değerlendirmeye yanıt