Simba Market Forecast Machine

SIMBA MARKET FORECAST MACHINE

Stop Chasing BUY/SELL Signals. Start Forecasting the Market.

You probably already have enough indicators.

RSI. MACD. Moving averages. Stochastic. Trend indicators. Buy arrows. Sell arrows.

The problem is not finding another indicator.

The problem is understanding what the market is actually doing.

A normal indicator may tell you:

BUY

But what happens next?

Where is price likely to go?

How strong is the setup?

What market regime are you in?

What could invalidate the idea?

What is the alternative scenario?

How much uncertainty exists?

And most importantly:

How has this type of forecast actually performed on your own market data?

This is where SIMBA Market Forecast Machine takes a different approach.

SIMBA is not designed to simply produce another BUY or SELL arrow.

It is designed to help you scan the market, classify the environment, build scenarios, estimate probabilities, identify targets, define invalidation and measure its own forecasting history.

And as its forecast history grows, its probability estimates can be recalibrated using the results recorded on your own MT5 terminal.

NO MORE BLIND BUY SIGNALS

A BUY signal by itself tells you very little.

SIMBA is designed to give you the information around the forecast.

For example:

PRIMARY: BULLISH

Probability: 68%
Forecast Score: 78/100
Execution Score: 84/100
Target: 1.08750
Invalidation: 1.08120
R:R: 2.4
Uncertainty: 18%

ALTERNATIVE: BEARISH

Trigger: Structural invalidation below 1.08120

This is fundamentally different from simply seeing:

BUY ↑

SIMBA gives you a market scenario rather than asking you to blindly follow a signal.

And when the market does not provide enough evidence?

NO FORECAST

That is not a malfunction.

It is part of the design.

WHAT IS SIMBA?

SIMBA Market Forecast Machine is a multi-symbol, multi-timeframe probabilistic market forecasting and decision-support engine for MetaTrader 5.

It combines:

  • Market structure

  • Trend

  • Momentum

  • Volatility

  • Liquidity behavior

  • Supply and demand

  • Support and resistance

  • Fibonacci analysis

  • Multi-timeframe confirmation

  • Scenario generation

  • Probability estimation

  • Uncertainty analysis

  • Historical forecast calibration

into one integrated market-analysis environment.

The purpose is simple:

SCAN THE MARKET.

UNDERSTAND THE REGIME.

BUILD THE SCENARIO.

IDENTIFY THE TARGET.

DEFINE THE INVALIDATION.

MEASURE THE UNCERTAINTY.

LET THE TRADER DECIDE.

SIMBA does not place trades.

You remain in control.

MORE THAN A TRADITIONAL INDICATOR

A traditional indicator usually answers a narrow question.

Is momentum high?

Is price above an average?

Is the market overbought?

Did a crossover occur?

SIMBA attempts to answer a much broader question:

“Given the current market structure and conditions, what are the most probable paths from here?”

It therefore combines several analytical layers instead of relying on a single indicator output.

WHAT SIMBA ANALYZES

MARKET STRUCTURE

SIMBA can evaluate:

  • Swing highs and lows

  • Break of Structure

  • Liquidity sweeps

  • Displacement

  • Supply and demand areas

  • Structural Fibonacci

  • Higher-timeframe support and resistance

TREND & MOMENTUM

The forecasting framework can incorporate:

  • EMA 20

  • EMA 50

  • EMA 200

  • DEMA 9

  • DEMA 20

  • ADX

  • Stochastic

  • Parabolic SAR

  • ATR

VOLATILITY

SIMBA evaluates the current volatility environment to help distinguish between conditions such as:

  • Strong trend

  • Expansion

  • Compression

  • Range

  • High volatility

  • Potential exhaustion

  • Transition

The objective is not to predict every candle.

The objective is to understand what type of market you are trading.

MULTI-TIMEFRAME MARKET READING

Markets behave differently depending on the timeframe.

A bullish M5 movement does not automatically mean the H1 or H4 structure is bullish.

SIMBA therefore evaluates multiple timeframes so the current forecast can be considered within a broader market context.

This helps answer an important question:

“Is the current movement supported by the bigger picture?”

Instead of trading one timeframe in isolation, SIMBA gives you a structured multi-timeframe view.

THE SIMBA MARKET BOARD

Why analyze one chart at a time?

SIMBA can monitor multiple symbols from a centralized dashboard.

Depending on your configuration, you can scan up to 20 symbols and compare them in one place.

Each market can display information such as:

  • Symbol

  • Current price

  • Direction

  • Market regime

  • Forecast score

  • Execution score

  • Uncertainty

  • Target

  • Invalidation

  • R:R

  • Higher-timeframe support

  • Higher-timeframe resistance

  • Forecast status

You can quickly see where the market is offering cleaner conditions and where uncertainty is elevated.

You don't have to trade everything.

You only need to know where your attention may be justified.

MARKET REGIME

A strategy that works well during a strong trend can behave very differently inside a range.

SIMBA therefore classifies the market environment.

Possible states include:

  • STRONG BULL

  • BULL

  • STRONG BEAR

  • BEAR

  • RANGE

  • EXPANSION

  • EXHAUSTION

  • REVERSAL

  • HIGH VOLATILITY

  • LOW VOLATILITY

  • TRANSITION

  • UNCERTAIN

The regime becomes an important part of the forecasting process.

This means SIMBA is not simply asking:

“Is price going up?”

It is asking:

“What kind of environment is price moving through?”

THE SCENARIO TREE

Markets do not owe you the outcome you expect.

That is why SIMBA does not have to rely on a single path.

The scenario engine can present:

PRIMARY SCENARIO

The direction currently supported by the strongest combination of market conditions.

ALTERNATIVE SCENARIO

The opposing scenario and the condition that could activate it.

RANGE SCENARIO

The possibility that price remains trapped between important levels instead of producing a clean directional move.

This creates a more realistic way of looking at markets:

Primary path → Alternative path → Range possibility

rather than:

BUY → Hope

TARGET LADDER

SIMBA can identify multiple potential destinations instead of forcing the analysis around one arbitrary take-profit level.

Potential target sources can include:

  • Structural Fibonacci

  • Daily pivot levels

  • H1 support/resistance

  • Supply/demand boundaries

  • Structural price levels

The engine can organize these into a target ladder.

For example:

TP1 — 1.08420
TP2 — 1.08610
TP3 — 1.08850
TP4 — 1.09100

Depending on the forecast, the ladder can provide information such as:

  • Price

  • Probability

  • Distance

  • ATR distance

  • R-multiple

  • Expected bars

  • Allocation guidance

This allows traders to see the potential path rather than focusing on one final destination.

INVALIDATION

A professional market thesis needs a point where the thesis is no longer valid.

SIMBA therefore identifies an invalidation level for the current scenario.

For example:

Bullish scenario

Entry area: 1.08400
Target: 1.08950
Invalidation: 1.08150

If price reaches the structural invalidation area, the bullish scenario is no longer supported under the current model.

This does not mean SIMBA knows exactly what happens next.

It means the trader knows:

“This is where my current market thesis stops making sense.”

UNCERTAINTY GATE

One of SIMBA's most important features is its ability to recognize when the market is unclear.

Uncertainty can increase when there is:

  • Conflicting timeframe structure

  • Weak trend strength

  • Compressed volatility

  • Conflicting directional scores

  • Rapid regime changes

  • Poor structural confirmation

  • Unstable market conditions

When uncertainty becomes too high, SIMBA can refuse to produce a directional forecast.

Instead:

NO FORECAST — HIGH UNCERTAINTY

This is a powerful concept.

A system does not always need to tell you what to trade.

Sometimes the most useful information is:

“Conditions are not clear enough.”

THE SELF-CALIBRATING ENGINE

THE FEATURE THAT MAKES SIMBA DIFFERENT

This is one of the most important parts of the SIMBA architecture.

Most indicators operate with fixed logic.

The developer defines the calculations.

You install the indicator.

It continues producing outputs according to those rules.

SIMBA goes one step further.

It records what happened after its forecasts.

Every completed forecast cycle can be recorded to a CSV file in your MT5 terminal.

The record can include information such as:

  • Open time

  • Close time

  • Symbol

  • Market regime

  • Session

  • Volatility state

  • Direction

  • Entry

  • Target

  • Invalidation

  • Forecast score

  • Execution score

  • ATR

  • R:R

  • Uncertainty

  • Target source

  • Invalidation source

  • Outcome

  • Realized R

  • Bars to outcome

  • Maximum favorable movement

  • Maximum adverse movement

  • Target-ladder results

In simple terms:

SIMBA records what it believed.

Then it records what actually happened.

That creates a historical forecast dataset on your own terminal.

HOW THE CALIBRATION WORKS

When a new forecast is generated, SIMBA can compare the current setup with previously recorded forecast cycles.

The engine can categorize forecasts according to characteristics such as:

  • Market regime

  • Direction

  • Forecast-score range

It then examines previous outcomes in the corresponding category.

For example:

Suppose SIMBA has historically produced bullish forecasts during a strong-bull regime.

If those forecasts have frequently reached their targets, the historical evidence can increase the calibrated confidence associated with similar future forecasts.

If those forecasts have frequently failed, the calibrated confidence can move lower.

The system uses Bayesian smoothing to prevent a tiny sample from immediately dominating the estimate.

Conceptually:

p = (wins + k × prior) / (total + k)

This allows the system to gradually move from its initial model assumptions toward measured historical outcomes as more data becomes available.

FROM INITIAL ESTIMATE TO MEASURED HISTORY

Imagine SIMBA begins with an initial bullish probability estimate.

Early stage

There may be little historical data.

The probability therefore relies more heavily on the initial model.

Growing history

As more forecast cycles close, actual outcomes begin influencing the calibration.

Mature history

After sufficient observations, the displayed probability can increasingly reflect the measured historical performance of similar forecasts.

The important point is:

The system does not simply assume that every setup has the same probability forever.

It can measure how its own forecast categories have performed and adjust the confidence assigned to similar future scenarios.

YOUR MARKET. YOUR DATA. YOUR CALIBRATION.

This is where the concept becomes especially interesting for traders.

Different markets behave differently.

Gold does not behave exactly like EURUSD.

US100 does not behave exactly like GBPUSD.

London does not behave exactly like the Asian session.

A trending environment does not behave exactly like a compressed range.

SIMBA's forecast history can therefore reveal differences across:

SYMBOLS

Which markets have produced stronger forecast outcomes?

REGIMES

Do strong-trend forecasts perform better than range forecasts?

SCORE LEVELS

Do high-confidence forecasts actually outperform weaker forecasts?

SESSIONS

Are certain trading periods producing stronger outcomes?

TARGET SOURCES

Which types of targets have historically been reached more often?

This transforms the CSV from a simple log file into a research dataset for your trading process.

THIS IS NOT UNCONTROLLED “AI”

SIMBA should be understood precisely.

It does not use a neural network.

It does not require a GPU.

It does not rewrite its own source code.

It does not randomly change trading rules.

It does not continuously optimize every parameter.

The core analytical framework remains controlled.

What changes is the confidence calibration based on observed forecast outcomes.

That distinction matters.

SIMBA is not trying to become an unpredictable black box.

It is trying to answer a much simpler question:

“How well has this type of forecast actually performed?”

WHY THIS MATTERS

A static indicator can tell you what its rules currently say.

A calibrated forecasting engine can additionally tell you how similar forecasts have historically performed.

That is a significant difference.

You are no longer looking only at:

“The model says bullish.”

You can also ask:

“How have similar bullish forecasts performed?”

That is a much better question for a trader.

THE CSV IS YOUR FORECAST MEMORY

The CSV log is not just a technical file.

It can become your historical record of SIMBA's forecasting behavior.

You can:

BACK IT UP

Keep your forecast history safe.

REVIEW IT

Open the data in Excel or another analysis tool.

STUDY IT

Compare outcomes by:

  • Symbol

  • Regime

  • Session

  • Forecast score

  • Direction

  • Target source

  • R-multiple

LEARN FROM IT

Discover where the forecasting framework appears strongest and where it struggles.

The longer you run SIMBA, the more historical evidence you can accumulate.

FROM SIGNAL CHASING TO FORECAST ANALYSIS

The difference can be summarized like this:

TRADITIONAL INDICATOR

BUY

SIMBA

BULLISH

Probability: 68%
Regime: Strong Bull
Target: 1.08950
Invalidation: 1.08150
R:R: 2.6
Uncertainty: 17%
Alternative: Bearish below invalidation
Historical calibration: Based on previous similar forecasts

That is a completely different way to approach the chart.

WHY TRADERS MAY FIND SIMBA USEFUL

1. IT REDUCES BLIND SIGNAL CHASING

Instead of following a BUY or SELL arrow without context, you can examine the complete market scenario.

2. IT SHOWS UNCERTAINTY

Not every market condition deserves a prediction.

SIMBA can tell you when confidence is low.

3. IT SHOWS INVALIDATION

You know where the current market thesis stops being supported.

4. IT SHOWS MULTIPLE POTENTIAL TARGETS

Instead of treating the market as entry → one TP, you can examine a target ladder.

5. IT MONITORS MULTIPLE MARKETS

Scan multiple symbols without manually switching between numerous charts.

6. IT RECORDS ITS OWN FORECAST HISTORY

Every completed cycle can become part of your research dataset.

7. IT CAN RECALIBRATE PROBABILITIES

Historical outcomes can influence future confidence estimates for similar forecast categories.

SIMBA DOES NOT PROMISE PERFECTION

This is important.

SIMBA is not a crystal ball.

It will be wrong.

Markets can move unexpectedly.

A 70% probability does not mean the next trade must win.

A 40% probability does not mean the market cannot move in that direction.

Probability is not certainty.

That is why SIMBA combines probability with:

  • Invalidation

  • Alternative scenarios

  • R:R

  • Market regime

  • Uncertainty

  • Historical outcomes

The objective is not to eliminate uncertainty.

The objective is to make uncertainty visible.

WHO IS SIMBA FOR?

DISCRETIONARY TRADERS

For traders who want to make their own decisions but want stronger market context.

MULTI-MARKET TRADERS

For traders watching multiple Forex pairs, Gold, indices, commodities or other supported MT5 instruments.

SYSTEMATIC TRADERS

For traders who want structured market information to complement their own rules.

PROP-FIRM TRADERS

For traders who understand that avoiding poor-quality opportunities can be just as important as finding good ones.

DATA-DRIVEN TRADERS

For traders who want to measure their process instead of relying entirely on intuition.

WHO IS SIMBA NOT FOR?

SIMBA is probably not for you if you want:

  • Guaranteed BUY/SELL signals

  • Guaranteed profits

  • 100%+ win-rate promises

  • A completely automatic trading robot

  • A system that makes every trading decision for you

  • A magic indicator that predicts every market movement

SIMBA is built for traders who understand that markets are uncertain.

ANALYSIS ONLY — YOU REMAIN IN CONTROL

SIMBA does not automatically execute trades.

It does not:

  • Open positions

  • Close positions

  • Modify positions

  • Control your broker account

  • Guarantee execution

  • Guarantee profits

It is a forecasting and analysis tool.

You decide whether to trade.

You decide how much to risk.

You decide where to enter.

You decide where to place your stop.

You decide how to manage the position.

SIMBA provides the market intelligence.

You make the final decision.

THE SIMBA WORKFLOW

01 — SCAN

Monitor multiple markets.

02 — DETECT

Analyze structure, momentum, trend, volatility and important levels.

03 — CLASSIFY

Determine the current market regime.

04 — SCORE

Evaluate bullish, bearish and range conditions.

05 — BUILD

Generate primary, alternative and range scenarios.

06 — FORECAST

Estimate probabilities and potential targets.

07 — CHECK

Measure uncertainty and identify invalidation.

08 — RECORD

Store the completed forecast outcome.

09 — CALIBRATE

Use accumulated historical outcomes to refine future probability estimates.

10 — DECIDE

The trader makes the final decision.

WHAT YOU GET

Depending on the product edition and configuration, SIMBA can provide:

  • MT5 Market Forecast Machine

  • Multi-symbol market dashboard

  • Multi-timeframe analysis

  • Market regime classification

  • Forecast scoring

  • Execution scoring

  • Scenario tree

  • Target ladder

  • Invalidation levels

  • Uncertainty assessment

  • Structural analysis

  • Support/resistance analysis

  • Supply/demand analysis

  • Historical forecast logging

  • CSV calibration data

  • Probability recalibration

  • Product documentation

  • Updates according to the purchased edition

Please review the specific MT5 Market listing for the exact features included in your edition.

IMPORTANT — USER MANUAL

After purchasing or renting SIMBA Market Forecast Machine, please contact the developer to receive the User Manual and setup instructions before using the product.

The manual will help you understand the dashboard, settings, forecasting features, calibration system, and recommended setup.

Please contact the developer after purchase or rental to receive the manual.

THE BOTTOM LINE

You probably do not need another indicator.

You need a better way to read the market.

A traditional indicator may tell you:

BUY.

SIMBA asks:

What is the market regime?

What is the preferred scenario?

What is the alternative?

Where is the target?

Where is the invalidation?

How uncertain is the forecast?

And how have similar forecasts performed before?

Then SIMBA records the outcome.

The history grows.

The calibration grows.

Your understanding of the system grows.

That is the philosophy behind SIMBA.

STOP CHASING SIGNALS. START READING THE MARKET.

SCAN.

FORECAST.

MEASURE.

CALIBRATE.

DECIDE.

SIMBA Market Forecast Machine

More than an indicator.

More than a BUY/SELL signal.

A forecasting engine built to turn market data into structured scenarios, measurable probabilities and actionable context.

The market is uncertain.

Your analysis should acknowledge that.

PRODUCT IDENTITY

Developed by: ShieldNexus
Developer: NDACYAYISENGA Emmanuel
Trading Engine: SIMBA Trading Engine
Product Edition: SIMBA Community Edition

SIMBA Market Forecast Machine
Powered by the SIMBA Trading Engine

© NDACYAYISENGA Emmanuel / ShieldNexus

Product version and features may be updated over time.

Risk Warning: Trading financial markets involves substantial risk. Past or simulated performance does not guarantee future results. Use appropriate risk management and test the EA on a demo account before live deployment.


Рекомендуем также
Интеллектуальный алгоритм индикатора Godfather с точностью определяет тренд, отфильтровывает рыночный шум и генерирует входные сигналы и уровни выхода. Индикатор поможет в поиске точек входа при анализе графика цены. Программа сначала получает «снимок» графика, затем анализирует его. Результаты сообщаются трейдеру в виде сигналов. Основная цель данного индикатора это определение моментов входов и выходов из сделок, поэтому индикатор отображает только линию тренда и точки входа, тоесть отображае
Раскройте истинные скрытые закономерности рынка с помощью торговой системы PREDATOR AURORA — финального босса гибридных торговых индикаторов. Увидьте то, что другие не видят! Система торговли PREDATOR AURORA — это мощный инструмент, созданный для тех, кто отказывается прятаться в тенях посредственности. Это не просто еще один индикатор; это код для читов; это ваше нечестное преимущество — сложная гибридная охотничья система, которая отслеживает движения рынка с летальной точностью в джунглях,
Индикатор Диапазона Коробки для MT5 Индикатор Диапазона Коробки   для MT5 помогает трейдерам визуализировать ключевые ценовые зоны, автоматически определяя и выделяя рыночные структуры. Он динамически рисует   верхние, нижние и средние уровни   на основе ценового движения, что делает его эффективным инструментом для   определения зон поддержки и сопротивления, прорывов и разворотов тренда . Основные особенности: •   Автоматическое определение диапазонов   – Обнаруживает ценовые зоны на основе
FREE
Chart Replay Indicator MT5 Overview Chart Replay Indicator is a chart replay and training tool for MetaTrader that allows users to replay historical market data bar by bar directly on the chart. It is designed for manual backtesting, strategy training, and market behavior analysis without relying on future price information. Candles are displayed progressively to reproduce the flow of historical data. This indicator does not provide trading signals and does not execute or manage trades. Key Feat
CISD Levels Pro automatically draws CISD Buy and Sell levels directly on your chart. It highlights pending levels while they are forming, then marks confirmed levels after the confirmation candle closes. Optional confirmation arrows help you spot the signal quickly. This tool is designed for traders who want clean, simple CISD level visualization without extra indicators or clutter. Key Features Draws Bullish (BUY) CISD levels and Bearish (SELL) CISD levels Shows Pending levels (dashed) and
**   All Symbols   x   All Timeframes   scan just by pressing scanner button ** ***  Contact me to send you instruction and add you in "Head & Shoulders Scanner group" for sharing or seeing experiences with other users. + FREE Trading Utility MT5 Introduction: Head and Shoulders   Pattern  is a very repetitive common type of price reversal patterns.   The pattern appears on all time frames and can be used by all types of traders and investors.   The  Head and Shoulders  Scanner indicator  Scans
Уникальный индикатор, реализующий профессиональный и количественный подход к торговле на возврате к среднему. Он использует тот факт, что цена отклоняется и возвращается к среднему предсказуемым и измеримым образом, что позволяет использовать четкие правила входа и выхода, которые значительно превосходят неколичественные торговые стратегии. [ Installation Guide | Update Guide | Troubleshooting | FAQ | All Products ] Четкие торговые сигналы Удивительно легко торговать Настраиваемые цвета и разме
General Description In the simplest terms this is a contrarian intra-day scalping system. Built to try and let correct trades run as far as possible and flip the trade when indicated. The indicator looks at historical daily trading ranges to lay out levels at which it takes long and short positions based on the statistical levels. The indicator is built around index futures, mainly around S&P and the DOW but can be used an any futures contract mainly using AMP Futures to trade. The indicator is
Prop Firm Shield is a risk management panel for MetaTrader 5, built for prop firm traders who need control over their daily limits. You configure each limit and the tool watches the account around the clock, acting automatically when a limit is reached: closing positions, deleting pending orders and blocking new trading until the next day. Features: - Daily Take Profit - three modes: fixed USD, percent of the day-start balance, or target balance - Daily Stop Loss - three modes: fixed USD, percen
Bid Price Timer Indicator — Точность и умный контроль цены! Повышайте точность своей торговли с Bid Price Timer Indicator — мощным инструментом, созданным для трейдеров, которые ценят время, точность и ясность в каждом движении рынка. Ключевые особенности: Фиксированный таймер – Всегда отображается справа на графике (можно настроить X_Offset). Динамическое слежение за ценой – Таймер плавно движется вверх и вниз , следуя за Bid ценой в реальном времени. Автоматическое позицион
Это мультисимвольный и мультифреймовый сканер для нашего индикатора - ACB Breakout Arrows . По умолчанию он сканирует сигналы на покупку/продажу по 28 валютным парам и 9 таймфреймам одновременно .  Особенности Сканирует 252* комбинации символов и таймфреймов с одного графика. Откройте график с найденным сигналом и предустановленным шаблоном одним щелчком мыши.  Простое перетаскивание панели в любое место на графике. Оповещения в реальном времени с помощью всплывающих окон, звуков, push-уведомле
Single Arrow Reversal — Market Description — ru Single Arrow Reversal MT5 — подтверждённые разворотные стрелки, метки объёма и цели Фибо Один отказ. Одна стрелка. Один подтверждённый вход. Single Arrow Reversal — самостоятельный индикатор разворотных сигналов для MetaTrader 5. Экстремум ZigZag — лишь кандидат : стрелка печатается на более поздней ЗАКРЫТОЙ свече, которая отвергает этот экстремум , а не на самом экстремуме. Поэтому подтверждённые стрелки не перерисовываются . Вокруг движка — три с
Introduction This indicator detects volume spread patterns for buy and sell opportunity. The patterns include demand and supply patterns. You might use each pattern for trading. However, these patterns are best used to detect the demand zone (=accumulation area) and supply zone (=distribution area). Demand pattern indicates generally potential buying opportunity. Supply pattern indicates generally potential selling opportunity. These are the underlying patterns rather than direct price action. T
SPECIAL LAUNCH OFFER: $30 (1-Month Rent) Limited time offer to build our community and gather feedback! AmbM GOLD Institutional Scalper A high-precision M5 algorithm for XAUUSD (Gold) , engineered to trade exclusively at Institutional Liquidity Levels ($5/$10 psychological marks). PERFORMANCE DATA (BUY ONLY) • Win Rate: 87.09%. • Safe Growth: +$4,113 profit on $10k (13.75% Max Drawdown). • Extreme Stress Test: Successfully generated +$22,997 in a 5-year stress test (2020-2026), proving
Introduction to Fractal Pattern Scanner Fractal Indicator refers to the technical indicator that makes use of the fractal geometry found in the financial market. Fractal Pattern Scanner is the advanced Fractal Indicator that brings the latest trading technology after the extensive research and development work in the fractal geometry in the financial market. The most important feature in Fractal Pattern Scanner is the ability to measure the turning point probability as well as the trend probabil
Этот индикатор представляет собой индикатор автоматического волнового анализа, который идеально подходит для практической торговли! Случай... Примечание.   Я не привык использовать западные названия для классификации волн. Из-за влияния соглашения об именах Тан Лунь (Тан Чжун Шуо Дзен) я назвал основную волну   ручкой   , а вторичную полосу волн —   сегментом   Ат. в то же время сегмент имеет направление тренда. Именование   в основном является трендовым сегментом   (этот метод именования буде
Shadow Pulse Краткое описание Shadow Pulse — профессиональный индикатор для определения точек разворота на основе метода возврата к среднему значению (mean reversion). Генерирует высокоточные сигналы покупки и продажи с использованием интеллектуальной системы многоуровневой фильтрации. Торговая стратегия Индикатор разработан для работы на любых таймфреймах от M1 до H4 и показывает исключительные результаты при скальпинге на золоте (XAUUSD). Может эффективно применяться как для агрессивной торгов
XFlow показывает расширяющийся ценовой канал помогающий определять тренд и моменты его разворота. Используется также при сопровождении сделок для установки тейк-профит/стоп-лосс и усреднений. Практически не имеет параметров и очень прост в использовании - просто укажите важный для вас момент истории и индикатор рассчитает ценовой канал. ОТОБРАЖАЕМЫЕ ЛИНИИ ROTATE - толстая сплошная линия. Центр общего вращения цены. Цена делает широкие циклические движения вокруг линии ROTATE. Положение цены окол
Caicai L&S Yield Histogram Important Notice: This indicator is an integral tool of the automated EA Caicai Long and Short Pair Trading . This indicator visually displays the percentage deviation (Yield %) of a pair's current spread relative to its own historical mean. It is an excellent tool for quickly visualizing the gross financial potential of a market distortion in Long & Short operations. Main Features: Percentage Visualization: Understand the size of the distortion in palpable percentage
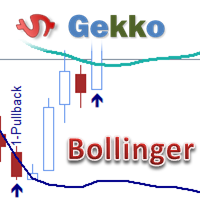
This is Gekko's Bollinger Bands indicator. It extends the use of the famous Bollinger Bands and calculates strong entry and exit signals using price action on the edge and on the middle bands. You can set it up in many different ways, eg: pullback, pullback against trend, middle band crossing and middle band crossing against trend. Inputs Number of Bars to Plot Indicator:  number of historical bars to plot the indicator, keep it low for better performance; Produces Signal Only When a Bar Closes:
SmartColorFibo
Sergio Rodrigues Vieira
SmartColorFibo – Visual and Customizable Fibonacci for MetaTrader 5 SmartColorFibo transforms the native MetaTrader 5 Fibonacci tool into a clearer, more organized, and customizable visualization while maintaining the convenience of working directly on the chart. The indicator was developed for traders who use Fibonacci retracements and extensions and want to identify different price regions more easily through visual representation. Main Features • Colored filling between Fibonacci levels. • C
Introducing the Bollinger Flipper Indicator – Your Ultimate Trading Edge!   Are you tired of second-guessing your entries and exits? The Bollinger Flipper Indicator is here to flip the game in your favor.   Built with the power of Bollinger Bands + Level 3 Power System + ZigZag Fractals, this advanced tool is designed to spot high-probability buy & sell signals with precision. SPECIAL BONUS (VALID TILL JUNE 2026)- OUR DAILY SCALPER EA for BTCUSD and VIX75 •································
Impulse fractals indicator - is counter-trend oriented complex market fractal pattern.  Market creates bull/bear impulse, trend starts, fractals on impulsed wave are an agressive pullback signals. Buy arrow is plotted when market is bearish and it's impulse showed up-side fractal, and sell arrow is plotted when market is bullish and it's impulse showed dn-side fractal. Main indicator's adjustable inputs : impulsePeriod - main period of impulse histogram  filterPeriod  - smoothes impulse accordi
Manyal trading system, CovEchoTrend Robot, focuses on reliability and flexibility. By employing statistical analysis methods to study the relationships between the base indicator and market patterns, the system enables a deeper understanding of market processes. Intelligent pattern analysis: The application of statistical data processing helps identify key trend reversal points more accurately, signaling significant market shifts. Informed decision-making is based on the intersection of indicato
BinaWin NoTouch
Juan Fernando Urrego Alvarez
BinaWin NoTouch - это индикатор, который посылает сигнал тревоги, когда сделка находится в правильной позиции, чтобы дождаться пробоя бокового рынка. Он специально разработан для торговли по стратегии «без касания» платформы Binary.Com с синтетическими индексами N.10, N.25, N.50, N.75 и N.100. Аналогичным образом, торговля может быть осуществлена ​​с помощью обычной стратегии CALL и PUT любой платформы бинарных опционов. Требования к использованию индикатора: 1. Иметь учетную запись на Bina
FREE
The ZigZag Buy Level is a specialized tool for traders who utilize market structure and classic ZigZag patterns to define key support and entry points. It automatically identifies "Main Highs"—significant highs confirmed by the subsequent price action—and then calculates a high-probability "Buy Level" based on a specified percentage pullback from that Main High to the last corrective low. This indicator helps you anticipate deep retracement entries, clearly marking them on the chart with labels
移動平均線クロス、ボリンジャーと移動平均線のクロス、移動平均線の角度でサイン表示 MT5インジケータ こちらに サイト があります。 このインジケータは3つのパターンでサインを表示(切り替え可能)します。 ① 移動平均線のクロス ② ボリンジャーバンドと短期移動平均線とのクロス ③ ボリンジャーバンドと短期移動平均線とのクロスと、中期移動平均線と長期移動平均線の角度 ⓸ ボリンジャーバンドと短期移動平均線とのクロス(サインを交互に表示) 移動平均線のクロス 指定した短期移動平均線と長期移動平均線のゴールデンクロスでは買いサイン、デットクロスでは売りサインを表示します。 ディフォルトでは短期は5,長期は20となっています。 もちろん変更可能になります。 移動平均線の種類をEMA(指数平滑移動平均線)やSMMA(平滑化移動平均)などに変更可能で適する価格も変更可能になります。 ボリンジャーバンドと短期移動平均線のクロス ボリンジャーバンド(以降BB)と短期移動平均線のクロスでサインを表示します。 ディフォルトではBB+1σと5MAのゴールデンクロスで買いサイン、BB-1σと5MAのデット
VFI Quantum
Nikita Berdnikov
5 (1)
Представляем VFI (Volume Flow Indicator) – индикатор для торговли, который анализирует соотношение объема и движения цены для выявления ключевых торговых возможностей. Индикатор отображает силу и направление потока объемов, предоставляя четкие сигналы о потенциальных точках входа и выхода. Сигналы формируются на основе пересечения нулевой линии, пересечения линии VFI и ее экспоненциальной скользящей средней (EMA), а также при выходе индикатора из зон перекупленности и перепроданности. Внимание!
FREE
Introduction to the Manual Backtesting Indicator on MQL5 The MetaTrader platform provides an excellent backtesting tool for evaluating Expert Advisors (EAs). However, when it comes to manually backtesting a strategy to assess its effectiveness, this tool has some limitations: You cannot manually draw zones or trend lines while in backtesting mode. You cannot switch timeframes to check time alignment. For example, if my strategy requires additional confirmation from a higher timeframe (HTF), this
С этим продуктом покупают
Trend Sniper X
Sarvarbek Abduvoxobov
4.9 (40)
Trend Sniper X — это трендовый индикатор для MetaTrader 5, работающий на нескольких таймфреймах, который помогает трейдерам точно и ясно определять направление тренда и потенциальные точки разворота. для MT4: https://www.mql5.com/en/market/product/193245 Информация о цене: Текущая цена является промо-ценой и может измениться по мере выхода предстоящих обновлений и новых функций. Бонусное предложение: Чтобы получить БЕСПЛАТНЫЙ авто-трейд советник Assistant EA для этого индикатора, пожалуйста, на
Smart Trend Trading System — MetaTrader 5 После покупки напишите мне на MQL5, чтобы БЕСПЛАТНО получить Smart Universal Expert Advisor, а также доступ к онлайн-курсу, руководство в формате PDF и доступ к закрытой группе. STTS объединяет направление тренда, сигналы входа и выхода, зоны разворота и важные ценовые уровни прямо на графике. Торгуйте по системе вручную или подключите отдельный совместимый советник для автоматического исполнения с выбранными вами настройками. ОДНА СИСТЕМА. ЧЕТЫРЕ ТОРГОВ
Gann Made Easy   - это профессиональная, но при этом очень простая в применении Форекс система, основанная на лучших принципах торговли по методам господина У.Д. Ганна. Индикатор дает точные BUY/SELL сигналы, включающие в себя уровни Stop Loss и Take Profit. ПОЖАЛУЙСТА, СВЯЖИТЕСЬ СО МНОЙ ПОСЛЕ ПОКУПКИ, ЧТОБЫ ПОЛУЧИТЬ ТОРГОВЫЕ ИНСТРУКЦИИ И ОТЛИЧНЫЕ ДОПОЛНИТЕЛЬНЫЕ ИНДИКАТОРЫ БЕСПЛАТНО! Вероятно вы уже не раз слышали о торговли по методам Ганна. Как правило теория Ганна отпугивает от себя не только
ARIPoint
Temirlan Kdyrkhan
1 (4)
ARIBot is a powerful trading companion designed to generate high-probability entry signals with dynamic TP/SL/DP levels based on volatility. Built-in performance tracking shows win/loss stats, PP1/PP2 hits, and success rates — all updated live. Key Features: Buy/Sell signals with adaptive volatility bands Real-time TP/SL/DP levels based on ATR Built-in MA Filter with optional ATR/StdDev volatility Performance stats panel (Success, Profit/Loss, PP1/PP2) Alerts via popup, sound, push, or email Cus
Auto Optimized SpeedAngle — это система векторизации импульса институционального уровня, которая исключает подгонку под исторические данные (curve-fitting) за счет непрерывной форвард-оптимизации (Walk-Forward Optimization, WFO). Вместо того чтобы полагаться на статические входные параметры, которые теряют эффективность при смене рыночных режимов, индикатор динамически перекалибрует свои настройки, используя валидацию на вневыборочных данных (Out-of-Sample, OOS). Это гарантирует, что отображаемы
Neuro Poseidon - новый индикатор от Дарьи Резуевой. Он сочетает точные торговые сигналы с адаптивными уровнями TP/SL , в результате создавая максимально выгодные сделки! TO SWITCH TO   ENG   PLEASE CHOOSE IT IN THE UPPER-RIGHT CORNER OF THE WEBSITE Напишите мне и получите  Neuro Poseidon Assistant  в подарок для автоматизации вашей торговли! Что отличает его от других индикаторов? 1. Доказанная прибыльность на всех активах и таймфреймах 2. На графике присутствуют только подтвержденные сигналы н
Entry Points Pro — топ-1 индикатор по количеству отзывов (600 отзывов и 31 000 скачиваний обеих версий). Индикатор даёт самые перспективные точки входа в сделки без перерисовки на любых инструментах. Индикатор покажет заранее стрелкой точку входа в сделку, укажет цену входа и нарисует на графике уровень входа и стопа, а так же рассчитает рабочий лот под твой депозит и риск, а панель статистики поможет выбрать самый перспективный инструмент и таймфрейм .  Тебе остаётся поставить отложенный ордер
Welcome to ENTRY IN THE ZONE AND SMC MULTI TIMEFRAME SPECIAL BENEFIT / FOR OUR MQL5 CUSTOMERS FREE ACCESS TO THE NEW TOOL  — COMING SOON — Learn more on our official website  : https://www.fableedge.net Entry In The Zone and SMC Multi Timeframe is a real-time market analysis tool based on Smart Money Concepts (SMC), designed to analyze market structure, price direction, and key trading zones. It supports both Single-Timeframe Analysis and Multi-Timeframe Analysis, providing a clearer view of the
Unix Scalper — MetaTrader 5 После покупки напишите мне на MQL5, чтобы БЕСПЛАТНО получить Smart Universal Expert Advisor, а также доступ к онлайн-курсу, руководство в формате PDF и доступ к закрытой группе. Найдите торговую ситуацию. Оцените план. Выберите способ торговли. UNIX Scalper объединяет анализ рынка, решения BUY/SELL/WAIT и уровни Entry, Stop Loss, TP1 и TP2 в одной удобной панели. УВИДЬТЕ СИГНАЛ И ТОРГОВЫЙ ПЛАН • Понятные решения: BUY, SELL или WAIT. • Определённые уровни: Entry, Stop
M1 SNIPER   — это простая в использовании торговая система. Это стрелочный индикатор, разработанный для тайм фрейма M1. Индикатор можно использовать как отдельную систему для скальпинга на тайм фрейме M1, а также как часть вашей существующей торговой системы. Хотя эта торговая система была разработана специально для торговли на M1, ее можно использовать и с другими тайм фреймами. Первоначально я разработал этот метод для торговли XAUUSD и BTCUSD. Но я считаю этот метод полезным и для торговли на
Adaptive Price Action Engine Купи индикатор — получи советник (EA) к нему бесплатно Самооптимизирующийся мульти-таймфреймовый анализ тренда и свечных моделей Рынок постоянно меняется — и не каждая модель Price Action имеет одинаковую ценность в разных рыночных режимах. Adaptive Price Action Engine создан для адаптации к изменяющимся рыночным условиям, объединяя трендовую структуру, мульти-таймфреймовый анализ, свечные модели и статистическую оптимизацию в единой аналитической системе. Два адапти
Power Candles V3 — самооптимизирующийся индикатор силы Power Candles V3 преобразует силу валюты и инструмента в готовый к использованию торговый план на каждом графике, к которому он прикреплен. Вместо того, чтобы просто раскрашивать свечи, он выполняет автоматическую оптимизацию в режиме реального времени в фоновом режиме и предоставляет вам оптимальные значения Stop Loss, Take Profit и порог сигнала для выбранного вами символа. Один клик — и все готово для реальной торговли: на графике появляю
Scalper Vault   — это профессиональная торговая система, которая дает вам все необходимое для успешного скальпинга. Этот индикатор представляет собой полную торговую систему, которую могут использовать трейдеры форекс и бинарных опционов. Рекомендуемый тайм фрейм М5. Система дает точные стрелочные сигналы в направлении тренда. Она также предоставляет вам сигналы выхода и рассчитывает рыночные уровни Ганна. Индикатор дает все типы оповещений, включая PUSH-уведомления. Пожалуйста, напишите мне пос
Atomic Analyst — MetaTrader 5 После покупки напишите мне на MQL5, чтобы БЕСПЛАТНО получить Smart Universal Expert Advisor, а также доступ к онлайн-курсу, руководство в формате PDF и доступ к закрытой группе. Atomic Analyst объединяет анализ ценового движения, направление тренда, сигналы входа и выхода, уровни Stop Loss и несколько уровней Take Profit прямо на графике. УВИДЬТЕ СИГНАЛ. ОЦЕНИТЕ ТОРГОВУЮ СИТУАЦИЮ. Atomic Analyst представляет результаты анализа в понятном визуальном виде: • Стрелки п
Каждый покупатель этого индикатора получает дополнительно Бесплатно: Авторскую утилиту "Bomber Utility", которая автоматически сопровождает каждю торговую операцию, устанавливает уровни Стоп Лосс и Тейк профит и закрывает сделки согласно правилам этой стратегии, Сет-файлы для настройки этого индикатора на различных активах, Сет-файлы для настройки Bomber Utility в режимы: "Минимум Риска", "Взвешенный Риск" и "Стратегия Выжидания", Пошаговый видео-мануал, который поможет вам быстро установить, н
Crystal Heikin Ashi Signals—Professional Trend & Signal Detection Indicator Advanced Heikin Ashi Visualization with Intelligent Signal System for Manual & Automated Trading Final Price: $149 ---------> Price goes up $10 after every 10 sales . Limited slots available — act fast . Overview User Guide PDF Crystal Heikin Ashi Signals is a professional-grade MetaTrader 5 indicator that combines pure Heikin Ashi candle visualization with an advanced momentum-shift detection system. Designed for both m
DayTrader PRO DayTrader PRO — это передовой торговый индикатор, сочетающий фильтр Лагерра (Laguerre Filter) Джона Элерса с мощным движком автоматической оптимизации. Вместо использования фиксированных параметров индикатор автоматически подбирает оптимальные настройки на основе недавних рыночных условий, что позволяет адаптироваться к изменяющейся волатильности без необходимости ручной корректировки. Индикатор генерирует четкие сигналы на ПОКУПКУ и ПРОДАЖУ, а также адаптивные уровни Stop Loss и T
Quant Direction — это инструмент трехмерного анализа рынка. Он обеспечивает полностью объективный, основанный на алгоритмах анализ рынка, одновременно вычисляя точные процентные отклонения по нескольким параметрам. Разработанный с использованием передовых инструментов моделирования на основе искусственного интеллекта и тщательно протестированный, алгоритм предназначен для интерпретации рынка с уникальной точностью. Он может анализировать любую валютную пару или финансовый инструмент на вашей пла
Btmm state engine pro
Garry James Goodchild
5 (4)
BTMM State Engine Pro by G-Labs — Beat The Market Maker indicator for MetaTrader 5. Asian session range, London and New York kill zones, level progression (L1/L2/L3), peak formation detection (PFH/PFL), entry signals, and a multi-pair scanner from one chart. Stop scanning charts one pair at a time. The State Engine tracks the BTMM daily cycle automatically — Asian box, room boundaries, level blocks, peak formations, and filtered entries — while the scanner dashboard shows level, peak status, d
SkyHammer Signal Pro Профессиональный трендовый индикатор без перерисовки с фиксированными уровнями Entry, SL и TP SkyHammer Signal Pro — это структурированный индикатор тренда и momentum, созданный для трейдеров, которым нужны четкие, зафиксированные и проверяемые торговые сигналы. Лучше всего он работает на младших таймфреймах, таких как M1 и M5 . Индикатор не пытается предсказывать вершины или основания рынка. Вместо этого он ожидает подтвержденную рыночную структуру, направление тренда, силу
Precision Spike Detector
Francisco Mandomo Simbine
5 (2)
Precision Spike Detector V3 – Institutional-Grade AI Trading System Attention: The price increases by US$50 for every 10 purchases.  Final price: US$599 Precision Spike Detector V3   is a   state-of-the-art, institutional-grade market analysis system   for   MetaTrader 5 , designed to detect   high-probability market movements   in synthetic indices such as   Boom, Crash, GainX, and PainX . After purchase, send me a private message to receive the optimized configuration files,  the installation
UZFX {SSS} Scalping Smart Signals v5.0 MT5 — это высокопроизводительный торговый индикатор без перерисовки, разработанный для скальперов, дейтрейдеров и свинг-трейдеров, которым требуются точные сигналы в режиме реального времени на быстро меняющихся рынках. Разработанный компанией (UZFX-LABS), этот индикатор сочетает в себе анализ ценового действия, подтверждение тренда и интеллектуальную фильтрацию для генерации высоковероятных сигналов на покупку и продажу, предупреждающих сигналов и возможно
PainX 400 FAKEOUT DETECTOR MT5 Custom Indicator  ·  Sell-Side Bias  ·  Scalping  ·  RSI(6) Filtered   OVERVIEW   The Spike Fakeout Detector is a non repaint precision technical indicator built exclusively for Crash / PainX synthetic indices on the platform. It is engineered around one of the most consistent and exploitable patterns on this instrument — the false breakout above resistance followed by a sharp price drop. Crash/PainX is a growing index that produces a significant price drop app
Currency Strength Wizard   — очень мощный индикатор, предоставляющий вам комплексное решение для успешной торговли. Индикатор рассчитывает силу той или иной форекс-пары, используя данные всех валют на нескольких тайм фреймах. Эти данные представлены в виде простых в использовании индексов валют и линий силы валют, которые вы можете использовать, чтобы увидеть силу той или иной валюты. Все, что вам нужно, это прикрепить индикатор к графику, на котором вы хотите торговать, и индикатор покажет вам
Mahra Pro Indicator MT5
Mahra Said Mohammed Al Kaabi
Mahra Pro Indicator MT5 Overview Mahra Pro is a MetaTrader 5 chart indicator designed to support structured analysis of XAUUSD (Gold). It combines trend, momentum, volatility and price-structure conditions to identify potential buy and sell setups and display them directly on the chart. The indicator does not open, modify or close trades. All trading decisions and order execution remain under the user's control. Main features • Buy and sell signal arrows on the chart. • Fast and slow EMA lines w
Turn every candle into a bid x ask footprint built from real tick data. See who is actually trading at each price, with delta, volume profile, imbalance zones and a scored setup engine that prints entry, stop and target Order Flow Footprint Chart Pro Most indicators tell you what price did. This one tells you who did it. Order Flow Footprint Chart Pro rebuilds every candle on your chart from raw tick data and shows you the volume that traded at each individual price inside it, split into the am
M1 Quantum MT5
Hamed Dehgani
4.2 (10)
Торговые сигналы в реальном времени с использованием M1 Quantum: Сигнал  (Сделка выполнена автоматически с помощью Quantum Trade Assistant , бесплатно включённого в этот продукт.) Последние новости : Выпущена версия 1.64. Теперь для всех сделок Stop Loss размещается за соответствующими зонами поддержки/сопротивления. Функция Smart Close также была улучшена для повышения производительности EA в этой версии. С 9 августа live-сигнал работает на версии 1.64. План цен: Текущая цена: $169 (Предложени
SR Liquidity   — это торговый индикатор, предназначенный для выявления скрытых зон, где концентрируется рыночная ликвидность и наблюдается наиболее сильная реакция цены. Эти особые зоны ликвидности выступают в качестве мощных уровней поддержки и сопротивления, предоставляя вам четкую картину того, где с наибольшей вероятностью произойдет разворот рынка. Вместо построения стандартных линий поддержки и сопротивления, индикатор SR Liquidity анализирует реальное поведение цены, выявляя зоны концентр
Это, пожалуй, самый полный индикатор автоматического распознавания гармонического ценообразования, который вы можете найти для платформы MetaTrader. Он обнаруживает 19 различных паттернов, воспринимает проекции Фибоначчи так же серьезно, как и вы, отображает зону потенциального разворота (PRZ) и находит подходящие уровни стоп-лосс и тейк-профит. [ Руководство по установке | Руководство по обновлению | Устранение неполадок | FAQ | Все продукты ] Он обнаруживает 19 различных гармонических ценов
Finesia Scalper - Высокая вероятность и система Non-Repainting Ищете мощный торговый индикатор с высокой вероятностью, который устраняет догадки из вашего графика? Finesia Scalper — это профессиональный торговый инструмент, 100% без перерисовки (non-repainting), разработанный для обеспечения максимальной точности. Построенный на проверенном алгоритме, этот индикатор органично объединяет три высокоэффективные торговые методологии в одну единую систему. Результатом является высокоточная система ди
Другие продукты этого автора
Simba Prop Firm EA
Emmanuel Ndacyayisenga
SIMBA PROP FIRM EA PROP-FIRM-FOCUSED EXECUTION & ADAPTIVE RISK MANAGEMENT Trade the opportunity. Protect the account. Respect the rules. SIMBA Prop Firm EA is an Expert Advisor designed for traders who want a more structured approach to prop-firm trading, risk management, trade execution, and position management . A prop-firm account is not managed like an ordinary trading account. The account may have a large nominal balance, but your practical trading capacity is determined by the firm's daily
SIMBA GRAVITY SIGNAL Find Where Price Has Weight Every trader has experienced it. You open a chart and begin marking levels. Support. Resistance. Previous highs. Previous lows. VWAP. Higher timeframe structure. Before long, the chart is covered with lines. The real challenge is no longer finding information. The challenge is knowing which information actually matters. SIMBA GRAVITY SIGNAL was built to solve that problem. Instead of treating every level equally, SIMBA analyzes multiple layers of
FREE
SIMBA MarketPicker SIMBA MarketPicker is a MetaTrader 5 indicator designed for market scanning, comparison, and market selection . It is provided free of charge and is intended to help traders organize multiple instruments in one view, compare their current technical conditions, and identify markets that may deserve further analysis. iInstead of examining every symbol individually, MarketPicker provides a structured view of configured markets and applies the same analytical framework across them
FREE
Simba Bot Scanner
Emmanuel Ndacyayisenga
SIMBA BOT SCANNER 2.77 Scan. Select. Execute. Protect. Manage. One MetaTrader 5 Expert Advisor. Multiple layers of trading intelligence. SIMBA Bot Scanner is a multi-market MT5 trading system designed to bring market scanning, setup evaluation, market selection, automated execution, trade management, risk control and manual-trading protection into one integrated environment. If you are looking for an MT5 Expert Advisor to support your prop-firm challenge, funded-account workflow, or personal tra
SIMBA POSITION MANAGER Trade Your Setup. Understand Your Position. You found the setup. You opened the trade. Now what? This is where many traders struggle. Finding an entry is only one part of trading. Once a position is open, you still need to understand whether the trade is progressing, how much risk remains, when the position reaches important R-multiples, whether momentum is strengthening or weakening, and whether market conditions continue to support the trade. SIMBA Position Manager is de
SIMBA Manual Assistant Pro You Already Know How to Enter. Now Manage the Trade With a Plan. You already have a trading strategy. Maybe you trade support and resistance. Maybe breakouts, price action, moving averages, market structure, supply and demand, or something completely different. You know how you want to enter. But what happens after you enter? Should you move your stop-loss to break-even? Should you take partial profit? Should you let the trade run? Is that pullback normal, or is the m

SIMBA Price Navigator Stop asking “Buy or Sell?” — start asking “Where is price going, and what would prove me wrong?” You can have a great trading strategy and still struggle with one simple question: Where is price likely to go next? Your strategy may tell you when to enter. Your indicators may tell you the trend. Your Fibonacci levels may show important areas. But what about the destination ? That is where SIMBA Price Navigator comes in. SIMBA Price Navigator is an MT5 analysis indicator desi
SIMBA POSITION MANAGER PRO You already know how to enter. SIMBA helps you manage what happens next. After more than 5 years of trading, I have learned something that many traders discover the hard way: Finding an entry is not the hardest part of trading. Managing the position after you enter is. There is almost nothing more frustrating than closing a good trade too early... Only to watch price continue directly toward the take-profit you originally planned. And there is almost nothing worse than

Simba Cloud EA
Emmanuel Ndacyayisenga
SIMBA CLOUD EA  ADAPTIVE TRADING • INTELLIGENT RISK CONTROL • AUTOMATED POSITION MANAGEMENT Read the market. Adapt to the regime. Control the risk. Protect the profit. SIMBA CLOUD EA is a regime-adaptive Expert Advisor for MetaTrader 5, designed to combine market analysis, adaptive risk management, capital protection, multi-symbol monitoring, and automated position management in one system. Markets do not behave the same way all the time. A strong trend, a normal trend, a range, and a choppy mar
Фильтр:
Нет отзывов
Ответ на отзыв