Simba Market Forecast Machine

  • 指标
  • Emmanuel Ndacyayisenga
    Emmanuel Ndacyayisenga
    • Founder & Lead Developer | Quant Trader & MQL5 Developer 在  ShieldNexus
    • 卢旺达
    • 808
    NDACYAYISENGA Emmanuel is a quantitative trader and MQL5 Expert Advisor developer focused on transforming practical trading concepts into systematic and automated trading solutions.
  • 版本: 2.10
  • 激活: 10
SIMBA MARKET FORECAST MACHINE

Stop Chasing BUY/SELL Signals. Start Forecasting the Market.

You probably already have enough indicators.

RSI. MACD. Moving averages. Stochastic. Trend indicators. Buy arrows. Sell arrows.

The problem is not finding another indicator.

The problem is understanding what the market is actually doing.

A normal indicator may tell you:

BUY

But what happens next?

Where is price likely to go?

How strong is the setup?

What market regime are you in?

What could invalidate the idea?

What is the alternative scenario?

How much uncertainty exists?

And most importantly:

How has this type of forecast actually performed on your own market data?

This is where SIMBA Market Forecast Machine takes a different approach.

SIMBA is not designed to simply produce another BUY or SELL arrow.

It is designed to help you scan the market, classify the environment, build scenarios, estimate probabilities, identify targets, define invalidation and measure its own forecasting history.

And as its forecast history grows, its probability estimates can be recalibrated using the results recorded on your own MT5 terminal.

NO MORE BLIND BUY SIGNALS

A BUY signal by itself tells you very little.

SIMBA is designed to give you the information around the forecast.

For example:

PRIMARY: BULLISH

Probability: 68%
Forecast Score: 78/100
Execution Score: 84/100
Target: 1.08750
Invalidation: 1.08120
R:R: 2.4
Uncertainty: 18%

ALTERNATIVE: BEARISH

Trigger: Structural invalidation below 1.08120

This is fundamentally different from simply seeing:

BUY ↑

SIMBA gives you a market scenario rather than asking you to blindly follow a signal.

And when the market does not provide enough evidence?

NO FORECAST

That is not a malfunction.

It is part of the design.

WHAT IS SIMBA?

SIMBA Market Forecast Machine is a multi-symbol, multi-timeframe probabilistic market forecasting and decision-support engine for MetaTrader 5.

It combines:

  • Market structure

  • Trend

  • Momentum

  • Volatility

  • Liquidity behavior

  • Supply and demand

  • Support and resistance

  • Fibonacci analysis

  • Multi-timeframe confirmation

  • Scenario generation

  • Probability estimation

  • Uncertainty analysis

  • Historical forecast calibration

into one integrated market-analysis environment.

The purpose is simple:

SCAN THE MARKET.

UNDERSTAND THE REGIME.

BUILD THE SCENARIO.

IDENTIFY THE TARGET.

DEFINE THE INVALIDATION.

MEASURE THE UNCERTAINTY.

LET THE TRADER DECIDE.

SIMBA does not place trades.

You remain in control.

MORE THAN A TRADITIONAL INDICATOR

A traditional indicator usually answers a narrow question.

Is momentum high?

Is price above an average?

Is the market overbought?

Did a crossover occur?

SIMBA attempts to answer a much broader question:

“Given the current market structure and conditions, what are the most probable paths from here?”

It therefore combines several analytical layers instead of relying on a single indicator output.

WHAT SIMBA ANALYZES

MARKET STRUCTURE

SIMBA can evaluate:

  • Swing highs and lows

  • Break of Structure

  • Liquidity sweeps

  • Displacement

  • Supply and demand areas

  • Structural Fibonacci

  • Higher-timeframe support and resistance

TREND & MOMENTUM

The forecasting framework can incorporate:

  • EMA 20

  • EMA 50

  • EMA 200

  • DEMA 9

  • DEMA 20

  • ADX

  • Stochastic

  • Parabolic SAR

  • ATR

VOLATILITY

SIMBA evaluates the current volatility environment to help distinguish between conditions such as:

  • Strong trend

  • Expansion

  • Compression

  • Range

  • High volatility

  • Potential exhaustion

  • Transition

The objective is not to predict every candle.

The objective is to understand what type of market you are trading.

MULTI-TIMEFRAME MARKET READING

Markets behave differently depending on the timeframe.

A bullish M5 movement does not automatically mean the H1 or H4 structure is bullish.

SIMBA therefore evaluates multiple timeframes so the current forecast can be considered within a broader market context.

This helps answer an important question:

“Is the current movement supported by the bigger picture?”

Instead of trading one timeframe in isolation, SIMBA gives you a structured multi-timeframe view.

THE SIMBA MARKET BOARD

Why analyze one chart at a time?

SIMBA can monitor multiple symbols from a centralized dashboard.

Depending on your configuration, you can scan up to 20 symbols and compare them in one place.

Each market can display information such as:

  • Symbol

  • Current price

  • Direction

  • Market regime

  • Forecast score

  • Execution score

  • Uncertainty

  • Target

  • Invalidation

  • R:R

  • Higher-timeframe support

  • Higher-timeframe resistance

  • Forecast status

You can quickly see where the market is offering cleaner conditions and where uncertainty is elevated.

You don't have to trade everything.

You only need to know where your attention may be justified.

MARKET REGIME

A strategy that works well during a strong trend can behave very differently inside a range.

SIMBA therefore classifies the market environment.

Possible states include:

  • STRONG BULL

  • BULL

  • STRONG BEAR

  • BEAR

  • RANGE

  • EXPANSION

  • EXHAUSTION

  • REVERSAL

  • HIGH VOLATILITY

  • LOW VOLATILITY

  • TRANSITION

  • UNCERTAIN

The regime becomes an important part of the forecasting process.

This means SIMBA is not simply asking:

“Is price going up?”

It is asking:

“What kind of environment is price moving through?”

THE SCENARIO TREE

Markets do not owe you the outcome you expect.

That is why SIMBA does not have to rely on a single path.

The scenario engine can present:

PRIMARY SCENARIO

The direction currently supported by the strongest combination of market conditions.

ALTERNATIVE SCENARIO

The opposing scenario and the condition that could activate it.

RANGE SCENARIO

The possibility that price remains trapped between important levels instead of producing a clean directional move.

This creates a more realistic way of looking at markets:

Primary path → Alternative path → Range possibility

rather than:

BUY → Hope

TARGET LADDER

SIMBA can identify multiple potential destinations instead of forcing the analysis around one arbitrary take-profit level.

Potential target sources can include:

  • Structural Fibonacci

  • Daily pivot levels

  • H1 support/resistance

  • Supply/demand boundaries

  • Structural price levels

The engine can organize these into a target ladder.

For example:

TP1 — 1.08420
TP2 — 1.08610
TP3 — 1.08850
TP4 — 1.09100

Depending on the forecast, the ladder can provide information such as:

  • Price

  • Probability

  • Distance

  • ATR distance

  • R-multiple

  • Expected bars

  • Allocation guidance

This allows traders to see the potential path rather than focusing on one final destination.

INVALIDATION

A professional market thesis needs a point where the thesis is no longer valid.

SIMBA therefore identifies an invalidation level for the current scenario.

For example:

Bullish scenario

Entry area: 1.08400
Target: 1.08950
Invalidation: 1.08150

If price reaches the structural invalidation area, the bullish scenario is no longer supported under the current model.

This does not mean SIMBA knows exactly what happens next.

It means the trader knows:

“This is where my current market thesis stops making sense.”

UNCERTAINTY GATE

One of SIMBA's most important features is its ability to recognize when the market is unclear.

Uncertainty can increase when there is:

  • Conflicting timeframe structure

  • Weak trend strength

  • Compressed volatility

  • Conflicting directional scores

  • Rapid regime changes

  • Poor structural confirmation

  • Unstable market conditions

When uncertainty becomes too high, SIMBA can refuse to produce a directional forecast.

Instead:

NO FORECAST — HIGH UNCERTAINTY

This is a powerful concept.

A system does not always need to tell you what to trade.

Sometimes the most useful information is:

“Conditions are not clear enough.”

THE SELF-CALIBRATING ENGINE

THE FEATURE THAT MAKES SIMBA DIFFERENT

This is one of the most important parts of the SIMBA architecture.

Most indicators operate with fixed logic.

The developer defines the calculations.

You install the indicator.

It continues producing outputs according to those rules.

SIMBA goes one step further.

It records what happened after its forecasts.

Every completed forecast cycle can be recorded to a CSV file in your MT5 terminal.

The record can include information such as:

  • Open time

  • Close time

  • Symbol

  • Market regime

  • Session

  • Volatility state

  • Direction

  • Entry

  • Target

  • Invalidation

  • Forecast score

  • Execution score

  • ATR

  • R:R

  • Uncertainty

  • Target source

  • Invalidation source

  • Outcome

  • Realized R

  • Bars to outcome

  • Maximum favorable movement

  • Maximum adverse movement

  • Target-ladder results

In simple terms:

SIMBA records what it believed.

Then it records what actually happened.

That creates a historical forecast dataset on your own terminal.

HOW THE CALIBRATION WORKS

When a new forecast is generated, SIMBA can compare the current setup with previously recorded forecast cycles.

The engine can categorize forecasts according to characteristics such as:

  • Market regime

  • Direction

  • Forecast-score range

It then examines previous outcomes in the corresponding category.

For example:

Suppose SIMBA has historically produced bullish forecasts during a strong-bull regime.

If those forecasts have frequently reached their targets, the historical evidence can increase the calibrated confidence associated with similar future forecasts.

If those forecasts have frequently failed, the calibrated confidence can move lower.

The system uses Bayesian smoothing to prevent a tiny sample from immediately dominating the estimate.

Conceptually:

p = (wins + k × prior) / (total + k)

This allows the system to gradually move from its initial model assumptions toward measured historical outcomes as more data becomes available.

FROM INITIAL ESTIMATE TO MEASURED HISTORY

Imagine SIMBA begins with an initial bullish probability estimate.

Early stage

There may be little historical data.

The probability therefore relies more heavily on the initial model.

Growing history

As more forecast cycles close, actual outcomes begin influencing the calibration.

Mature history

After sufficient observations, the displayed probability can increasingly reflect the measured historical performance of similar forecasts.

The important point is:

The system does not simply assume that every setup has the same probability forever.

It can measure how its own forecast categories have performed and adjust the confidence assigned to similar future scenarios.

YOUR MARKET. YOUR DATA. YOUR CALIBRATION.

This is where the concept becomes especially interesting for traders.

Different markets behave differently.

Gold does not behave exactly like EURUSD.

US100 does not behave exactly like GBPUSD.

London does not behave exactly like the Asian session.

A trending environment does not behave exactly like a compressed range.

SIMBA's forecast history can therefore reveal differences across:

SYMBOLS

Which markets have produced stronger forecast outcomes?

REGIMES

Do strong-trend forecasts perform better than range forecasts?

SCORE LEVELS

Do high-confidence forecasts actually outperform weaker forecasts?

SESSIONS

Are certain trading periods producing stronger outcomes?

TARGET SOURCES

Which types of targets have historically been reached more often?

This transforms the CSV from a simple log file into a research dataset for your trading process.

THIS IS NOT UNCONTROLLED “AI”

SIMBA should be understood precisely.

It does not use a neural network.

It does not require a GPU.

It does not rewrite its own source code.

It does not randomly change trading rules.

It does not continuously optimize every parameter.

The core analytical framework remains controlled.

What changes is the confidence calibration based on observed forecast outcomes.

That distinction matters.

SIMBA is not trying to become an unpredictable black box.

It is trying to answer a much simpler question:

“How well has this type of forecast actually performed?”

WHY THIS MATTERS

A static indicator can tell you what its rules currently say.

A calibrated forecasting engine can additionally tell you how similar forecasts have historically performed.

That is a significant difference.

You are no longer looking only at:

“The model says bullish.”

You can also ask:

“How have similar bullish forecasts performed?”

That is a much better question for a trader.

THE CSV IS YOUR FORECAST MEMORY

The CSV log is not just a technical file.

It can become your historical record of SIMBA's forecasting behavior.

You can:

BACK IT UP

Keep your forecast history safe.

REVIEW IT

Open the data in Excel or another analysis tool.

STUDY IT

Compare outcomes by:

  • Symbol

  • Regime

  • Session

  • Forecast score

  • Direction

  • Target source

  • R-multiple

LEARN FROM IT

Discover where the forecasting framework appears strongest and where it struggles.

The longer you run SIMBA, the more historical evidence you can accumulate.

FROM SIGNAL CHASING TO FORECAST ANALYSIS

The difference can be summarized like this:

TRADITIONAL INDICATOR

BUY

SIMBA

BULLISH

Probability: 68%
Regime: Strong Bull
Target: 1.08950
Invalidation: 1.08150
R:R: 2.6
Uncertainty: 17%
Alternative: Bearish below invalidation
Historical calibration: Based on previous similar forecasts

That is a completely different way to approach the chart.

WHY TRADERS MAY FIND SIMBA USEFUL

1. IT REDUCES BLIND SIGNAL CHASING

Instead of following a BUY or SELL arrow without context, you can examine the complete market scenario.

2. IT SHOWS UNCERTAINTY

Not every market condition deserves a prediction.

SIMBA can tell you when confidence is low.

3. IT SHOWS INVALIDATION

You know where the current market thesis stops being supported.

4. IT SHOWS MULTIPLE POTENTIAL TARGETS

Instead of treating the market as entry → one TP, you can examine a target ladder.

5. IT MONITORS MULTIPLE MARKETS

Scan multiple symbols without manually switching between numerous charts.

6. IT RECORDS ITS OWN FORECAST HISTORY

Every completed cycle can become part of your research dataset.

7. IT CAN RECALIBRATE PROBABILITIES

Historical outcomes can influence future confidence estimates for similar forecast categories.

SIMBA DOES NOT PROMISE PERFECTION

This is important.

SIMBA is not a crystal ball.

It will be wrong.

Markets can move unexpectedly.

A 70% probability does not mean the next trade must win.

A 40% probability does not mean the market cannot move in that direction.

Probability is not certainty.

That is why SIMBA combines probability with:

  • Invalidation

  • Alternative scenarios

  • R:R

  • Market regime

  • Uncertainty

  • Historical outcomes

The objective is not to eliminate uncertainty.

The objective is to make uncertainty visible.

WHO IS SIMBA FOR?

DISCRETIONARY TRADERS

For traders who want to make their own decisions but want stronger market context.

MULTI-MARKET TRADERS

For traders watching multiple Forex pairs, Gold, indices, commodities or other supported MT5 instruments.

SYSTEMATIC TRADERS

For traders who want structured market information to complement their own rules.

PROP-FIRM TRADERS

For traders who understand that avoiding poor-quality opportunities can be just as important as finding good ones.

DATA-DRIVEN TRADERS

For traders who want to measure their process instead of relying entirely on intuition.

WHO IS SIMBA NOT FOR?

SIMBA is probably not for you if you want:

  • Guaranteed BUY/SELL signals

  • Guaranteed profits

  • 100%+ win-rate promises

  • A completely automatic trading robot

  • A system that makes every trading decision for you

  • A magic indicator that predicts every market movement

SIMBA is built for traders who understand that markets are uncertain.

ANALYSIS ONLY — YOU REMAIN IN CONTROL

SIMBA does not automatically execute trades.

It does not:

  • Open positions

  • Close positions

  • Modify positions

  • Control your broker account

  • Guarantee execution

  • Guarantee profits

It is a forecasting and analysis tool.

You decide whether to trade.

You decide how much to risk.

You decide where to enter.

You decide where to place your stop.

You decide how to manage the position.

SIMBA provides the market intelligence.

You make the final decision.

THE SIMBA WORKFLOW

01 — SCAN

Monitor multiple markets.

02 — DETECT

Analyze structure, momentum, trend, volatility and important levels.

03 — CLASSIFY

Determine the current market regime.

04 — SCORE

Evaluate bullish, bearish and range conditions.

05 — BUILD

Generate primary, alternative and range scenarios.

06 — FORECAST

Estimate probabilities and potential targets.

07 — CHECK

Measure uncertainty and identify invalidation.

08 — RECORD

Store the completed forecast outcome.

09 — CALIBRATE

Use accumulated historical outcomes to refine future probability estimates.

10 — DECIDE

The trader makes the final decision.

WHAT YOU GET

Depending on the product edition and configuration, SIMBA can provide:

  • MT5 Market Forecast Machine

  • Multi-symbol market dashboard

  • Multi-timeframe analysis

  • Market regime classification

  • Forecast scoring

  • Execution scoring

  • Scenario tree

  • Target ladder

  • Invalidation levels

  • Uncertainty assessment

  • Structural analysis

  • Support/resistance analysis

  • Supply/demand analysis

  • Historical forecast logging

  • CSV calibration data

  • Probability recalibration

  • Product documentation

  • Updates according to the purchased edition

Please review the specific MT5 Market listing for the exact features included in your edition.

IMPORTANT — USER MANUAL

After purchasing or renting SIMBA Market Forecast Machine, please contact the developer to receive the User Manual and setup instructions before using the product.

The manual will help you understand the dashboard, settings, forecasting features, calibration system, and recommended setup.

Please contact the developer after purchase or rental to receive the manual.

THE BOTTOM LINE

You probably do not need another indicator.

You need a better way to read the market.

A traditional indicator may tell you:

BUY.

SIMBA asks:

What is the market regime?

What is the preferred scenario?

What is the alternative?

Where is the target?

Where is the invalidation?

How uncertain is the forecast?

And how have similar forecasts performed before?

Then SIMBA records the outcome.

The history grows.

The calibration grows.

Your understanding of the system grows.

That is the philosophy behind SIMBA.

STOP CHASING SIGNALS. START READING THE MARKET.

SCAN.

FORECAST.

MEASURE.

CALIBRATE.

DECIDE.

SIMBA Market Forecast Machine

More than an indicator.

More than a BUY/SELL signal.

A forecasting engine built to turn market data into structured scenarios, measurable probabilities and actionable context.

The market is uncertain.

Your analysis should acknowledge that.

PRODUCT IDENTITY

Developed by: ShieldNexus
Developer: NDACYAYISENGA Emmanuel
Trading Engine: SIMBA Trading Engine
Product Edition: SIMBA Community Edition

SIMBA Market Forecast Machine
Powered by the SIMBA Trading Engine

© NDACYAYISENGA Emmanuel / ShieldNexus

Product version and features may be updated over time.

Risk Warning: Trading financial markets involves substantial risk. Past or simulated performance does not guarantee future results. Use appropriate risk management and test the EA on a demo account before live deployment.


推荐产品
Godfather mt5
Ivan Simonika
The intelligent algorithm of the Godfather indicator accurately determines the trend, filters out market noise and generates entry and exit levels. The indicator will help in finding entry points when analyzing the price chart. The program first receives a "snapshot" of the graph, then analyzes it. The results are reported to the trader in the form of signals. The main purpose of this indicator is to determine the moments of entries and exits from transactions, so the indicator displays only th
揭开市场真正隐藏的模式,使用 PREDATOR AURORA 交易系统——混合交易指标的终极王者。看清别人看不到的机会! PREDATOR AURORA 交易系统是一款为拒绝平庸、追求卓越的交易者设计的强大工具。这不仅仅是另一个普通的指标;它是你的秘密武器,是你的不公平优势。它是一种复杂的混合狩猎系统,能够以致命的精确度追踪市场动向,在这个只有强者才能生存的丛林中脱颖而出。受自然界中最强大捕食者的启发,PREDATOR AURORA采用先进的自适应算法,能够无缝适应不断变化的市场条件。就像潜伏在阴影中的捕食者,它能穿透市场噪音,揭示其他人可能永远无法发现的高概率交易机会。 主要特点: 自适应狩猎机制: 能够即时调整以适应市场波动,让你在任何交易环境中都能高效掌控局势。 多时间框架分析: 覆盖6个时间框架(M1到D1),让你从更广阔的视角洞察市场,超越普通分析的局限。 动态状态识别: 通过直观的颜色编码信号实时识别市场状态,为你的每一步操作提供指导。 性能跟踪与结果模拟: 内置信号跟踪算法,帮助你衡量和预测设置的成功率,将每次交易转化为精心计算的胜利。 基于波动性的预设: 提
The  Box Range Indicator  for MT5 helps traders visualize key price zones by automatically detecting and highlighting market structures. It dynamically draws upper, lower, and middle levels based on price action, making it an effective tool for identifying  support and resistance zones, breakouts, and trend reversals . Key Features: • Automatic Box Detection – Identifies price ranges based on market movements. • Dynamic High and Low Updates – Adjusts in real time to reflect market conditions.
FREE
Chart Replay Indicator MT5 Overview Chart Replay Indicator is a chart replay and training tool for MetaTrader that allows users to replay historical market data bar by bar directly on the chart. It is designed for manual backtesting, strategy training, and market behavior analysis without relying on future price information. Candles are displayed progressively to reproduce the flow of historical data. This indicator does not provide trading signals and does not execute or manage trades. Key Feat
CISD Levels Pro automatically draws CISD Buy and Sell levels directly on your chart. It highlights pending levels while they are forming, then marks confirmed levels after the confirmation candle closes. Optional confirmation arrows help you spot the signal quickly. This tool is designed for traders who want clean, simple CISD level visualization without extra indicators or clutter. Key Features Draws Bullish (BUY) CISD levels and Bearish (SELL) CISD levels Shows Pending levels (dashed) and
**   All Symbols   x   All Timeframes   scan just by pressing scanner button ** ***  Contact me to send you instruction and add you in "Head & Shoulders Scanner group" for sharing or seeing experiences with other users. + FREE Trading Utility MT5 Introduction: Head and Shoulders   Pattern  is a very repetitive common type of price reversal patterns.   The pattern appears on all time frames and can be used by all types of traders and investors.   The  Head and Shoulders  Scanner indicator  Scans
PZ Mean Reversion MT5
PZ TRADING SLU
1 (1)
采用专业和量化方法进行均值回归交易的独特指标。它利用了价格以可预测和可衡量的方式转移并返回均值这一事实,这允许明确的进入和退出规则大大优于非量化交易策略。 [ Installation Guide | Update Guide | Troubleshooting | FAQ | All Products ] 清晰的交易信号 非常容易交易 可定制的颜色和尺寸 实现性能统计 优于大多数交易策略 显示合适的止损和止盈水平 它实现了电子邮件/声音/视觉警报 这个怎么运作 该指标从更高的时间范围测量完全可定制的移动平均线的标准偏差,并使用趋势跟踪方法精确地找到交易。交易是通过深入当前图表的价格行为发现的,并在价格返回到平均价格区间时关闭,根据您选择的更高时间范围计算。由于其编码方式,该指标将远离高波动性和强劲趋势市场,并且仅在可预测的情况下进行交易,在可接受的波动性与方向性比率范围内,回归均值是可行的。 指标剖析 绿线是更高时间范围内的移动平均线(也就是平均值) 虚线区域是移动平均线周围的典型价格区间 蓝线是看涨交易的突破价格 红线是看跌交易的突破价格 交易是针对均值进行的,并在典型的价格
General Description In the simplest terms this is a contrarian intra-day scalping system. Built to try and let correct trades run as far as possible and flip the trade when indicated. The indicator looks at historical daily trading ranges to lay out levels at which it takes long and short positions based on the statistical levels. The indicator is built around index futures, mainly around S&P and the DOW but can be used an any futures contract mainly using AMP Futures to trade. The indicator is
Prop Firm Shield Full
Pablo Adolfo Cantos
Prop Firm Shield is a risk management panel for MetaTrader 5, built for prop firm traders who need control over their daily limits. You configure each limit and the tool watches the account around the clock, acting automatically when a limit is reached: closing positions, deleting pending orders and blocking new trading until the next day. Features: - Daily Take Profit - three modes: fixed USD, percent of the day-start balance, or target balance - Daily Stop Loss - three modes: fixed USD, percen
Bid Price Timer Indicator — 精准计时,智能价格追踪! 使用 Bid Price Timer Indicator ,让您的交易更具 时间感与精准度 !这是专为重视 时机、精确与清晰度 的交易者打造的强大工具。 主要功能: 固定计时器显示 —— 始终显示在图表 右侧 (可自定义 X_Offset)。 动态价格追踪 —— 计时器会随 买价 (Bid) 实时 上下移动 。 自动重新定位 —— 当市场价格变化时,计时器会 自动跟随 新的价格水平。 可选水平线 —— 可添加一条 水平线 ,清晰显示 当前买价位置 。 ️ 实时倒计时 —— 每秒自动更新,显示 距离下一根K线的倒计时 ,让您不错过任何交易时机! 交易者喜爱的理由: 帮助您以 毫秒级精度 掌握K线收盘时间 让图表更 简洁、美观、信息丰富 非常适合 剥头皮、日内交易与技术分析 简洁、高效、现代化的设计,让 Bid Price Timer Indicator 成为您市场中精准控制时间的最佳助手!
Apex Heat Zone
Alier Nunez Fonseca
ACB Breakout Arrows Scanner MT5
KEENBASE SOFTWARE SOLUTIONS
这是我们的指标 ACB Breakout Arrows 的多品种、多时间周期扫描器。默认情况下,它可同时在 28 个货币对和 9 个时间周期 上扫描买入/卖出信号,为交易者节省大量查图时间,提高操作效率。  功能特点 可在一个图表中扫描多达 252* 个品种与时间周期的组合,极大地提升监控能力。 点击任一信号即可打开相应图表,并自动加载预设模板,便于快速跟进。 面板可自由拖动并放置于图表上的任意位置。 支持实时提醒功能,包括弹窗提示、声音报警、推送通知和电子邮件提醒,确保不错过任何重要信号。  输入参数 为 ACB Breakout Arrows 设置信号灵敏度,可根据策略需求微调。 Symbols:填写你希望系统扫描的货币对或交易品种。  刷新历史:如发现图表数据缺失或异常,可通过此选项自动下载并更新历史数据。  选择所需扫描的时间周期,可单选或多选。 提醒设置:自定义提醒类型与条件,提升响应效率。 面板颜色与字体大小均可自由调整,支持个性化视觉体验。 
Single Arrow Reversal — Market Description — zh Single Arrow Reversal MT5 — 确认型反转箭头 + 波浪量能标记 + 斐波那契目标 一次拒绝,一支箭头,一笔确认的入场。 Single Arrow Reversal 是 MetaTrader 5 的独立反转信号指标。ZigZag 的极端点只是 候选 :箭头只画在 之后一根收盘并拒绝该极端的已收盘K线 上,绝不画在极端点本身。因此 已确认的箭头不会重绘 。 箭头引擎之外有三层决策辅助:每个摆动的 量能强度标记 、最后一根确认波浪的 斐波那契目标梯 ,以及 实时上下文面板 (摆动趋势、波动率、量能读数、信号顺逆)。单文件,无外部指标、无DLL。 同家族产品:Single Arrow MT4、MTF MT4、Scanner MT4。 箭头的生命周期(请先读) 候选: 内置 O(n) ZigZag 引擎打印摆动极端点(枢轴)。 拒绝窗口: 最多 N 根已收盘K线(默认8),等待一根 反向击穿触发价 (枢轴实体 / 整根K线 / 枢轴收盘价,可选)并以拒绝形态收盘的K线。 箭头
Introduction This indicator detects volume spread patterns for buy and sell opportunity. The patterns include demand and supply patterns. You might use each pattern for trading. However, these patterns are best used to detect the demand zone (=accumulation area) and supply zone (=distribution area). Demand pattern indicates generally potential buying opportunity. Supply pattern indicates generally potential selling opportunity. These are the underlying patterns rather than direct price action. T
SPECIAL LAUNCH OFFER: $30 (1-Month Rent) Limited time offer to build our community and gather feedback! AmbM GOLD Institutional Scalper A high-precision M5 algorithm for XAUUSD (Gold) , engineered to trade exclusively at Institutional Liquidity Levels ($5/$10 psychological marks). PERFORMANCE DATA (BUY ONLY) • Win Rate: 87.09%. • Safe Growth: +$4,113 profit on $10k (13.75% Max Drawdown). • Extreme Stress Test: Successfully generated +$22,997 in a 5-year stress test (2020-2026), proving
Introduction to Fractal Pattern Scanner Fractal Indicator refers to the technical indicator that makes use of the fractal geometry found in the financial market. Fractal Pattern Scanner is the advanced Fractal Indicator that brings the latest trading technology after the extensive research and development work in the fractal geometry in the financial market. The most important feature in Fractal Pattern Scanner is the ability to measure the turning point probability as well as the trend probabil
本指标是实践实战交易完善的波浪自动分析的指标 !  案例... 注: 波浪分级用西方叫法不习惯,因受到缠论(缠中说禅)命名方式习惯的影响,我是将基础波浪命名为 笔 ,将二级波段命名为 段 ,同时具有趋势方向的段命名为 主趋段 (以后笔记中都是这种命名方式,先告知大家),但是算法上和缠论关系不大切勿混淆.反映的是本人分析盘面总结的 千变万化纷繁复杂的运行规律 . 对波段进行了标准化定义,不再是不同人不同的浪  ,    对人为干扰的画法进行了排除,在严格分析进场起到了关键的作用 . 使用这个指标,等于将交易界面提升美感,抛弃最原始的K线交易带你进入新的交易层次.如果不是为了交易,在宣传上也将使客户观感提升层次. 指标内容: 1.   基础波浪 (笔) : 首先我们找出了价格波动过程中的基础波动拐点,当然他的有序性低,为下一步的计算提供基础. 2.   二级波段( 段 ) :在基础波浪的基础上,通过算法分析得到层级更明显的二级波段,二级波段为波浪提供了分析基础 3.   波浪( 浪 ): 有着更清晰的趋势,更清晰直观的方向.分析一个波浪是否延续,需要看二级波段的形态,分析二级的构成
Shadow Pulse Indicator
Anastasia Danilova
Shadow Pulse 简要说明 Shadow Pulse 是一款基于均值回归方法识别反转点的专业指标。它使用智能多级过滤系统生成高精度的买入和卖出信号。 交易策略 该指标设计用于从 M1 到 H4 的任何时间框架,在黄金(XAUUSD)剥头皮交易中表现出色。它既可用于低周期的激进交易,也可用于高周期的中期持仓。 它的工作原理是识别价格动能耗尽的时刻,然后在反弹时进入仓位。系统识别相对于关键水平的价格过度延伸的临界区域,仅在确认反转运动时形成信号。 箭头仅出现在已关闭的蜡烛图上,永不重绘。这保证了信号的绝对稳定性,并允许客观评估指标在任何时间段的历史表现。 • 蜡烛图下方的蓝色箭头 — 开多仓信号(买入) • 蜡烛图上方的红色箭头 — 开空仓信号(卖出) 系统通过灵活的可定制参数自动适应各种金融工具的波动性。该指标在货币对、贵金属、股票指数和加密货币上同样有效。 内置的三级过滤系统智能阻止低波动性和市场不确定时期的虚假信号。每个过滤器独立运作,可以单独启用或禁用,让您精确选择适合您交易风格的信号数量和质量之间的最佳平衡。 信号频率管理功能有效防止横盘整理期间图表过度饱和。可定制的相同
XFlow
Maxim Kuznetsov
XFlow shows an expanding price channel that helps determine the trend and the moments of its reversal. It is also used when accompanying transactions to set take profit/stop loss and averages. It has practically no parameters and is very easy to use - just specify an important moment in the history for you and the indicator will calculate the price channel. DISPLAYED LINES ROTATE - a thick solid line. The center of the general price rotation. The price makes wide cyclical movements around the
Caicai L&S Yield Histogram Important Notice: This indicator is an integral tool of the automated EA Caicai Long and Short Pair Trading . This indicator visually displays the percentage deviation (Yield %) of a pair's current spread relative to its own historical mean. It is an excellent tool for quickly visualizing the gross financial potential of a market distortion in Long & Short operations. Main Features: Percentage Visualization: Understand the size of the distortion in palpable percentage
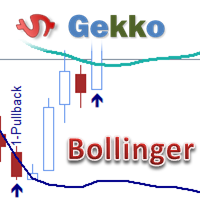
This is Gekko's Bollinger Bands indicator. It extends the use of the famous Bollinger Bands and calculates strong entry and exit signals using price action on the edge and on the middle bands. You can set it up in many different ways, eg: pullback, pullback against trend, middle band crossing and middle band crossing against trend. Inputs Number of Bars to Plot Indicator:  number of historical bars to plot the indicator, keep it low for better performance; Produces Signal Only When a Bar Closes:
SmartColorFibo
Sergio Rodrigues Vieira
SmartColorFibo – Visual and Customizable Fibonacci for MetaTrader 5 SmartColorFibo transforms the native MetaTrader 5 Fibonacci tool into a clearer, more organized, and customizable visualization while maintaining the convenience of working directly on the chart. The indicator was developed for traders who use Fibonacci retracements and extensions and want to identify different price regions more easily through visual representation. Main Features • Colored filling between Fibonacci levels. • C
Introducing the Bollinger Flipper Indicator – Your Ultimate Trading Edge!   Are you tired of second-guessing your entries and exits? The Bollinger Flipper Indicator is here to flip the game in your favor.   Built with the power of Bollinger Bands + Level 3 Power System + ZigZag Fractals, this advanced tool is designed to spot high-probability buy & sell signals with precision. SPECIAL BONUS (VALID TILL JUNE 2026)- OUR DAILY SCALPER EA for BTCUSD and VIX75 •································
Impulse fractals indicator - is counter-trend oriented complex market fractal pattern.  Market creates bull/bear impulse, trend starts, fractals on impulsed wave are an agressive pullback signals. Buy arrow is plotted when market is bearish and it's impulse showed up-side fractal, and sell arrow is plotted when market is bullish and it's impulse showed dn-side fractal. Main indicator's adjustable inputs : impulsePeriod - main period of impulse histogram  filterPeriod  - smoothes impulse accordi
Manyal trading system, CovEchoTrend Robot, focuses on reliability and flexibility. By employing statistical analysis methods to study the relationships between the base indicator and market patterns, the system enables a deeper understanding of market processes. Intelligent pattern analysis: The application of statistical data processing helps identify key trend reversal points more accurately, signaling significant market shifts. Informed decision-making is based on the intersection of indicato
BinaWin NoTouch
Juan Fernando Urrego Alvarez
BinaWin NoTouch is an indicator that sends an alert signal when the trade is in the right position to wait for the breakdown of a side market. It is specially designed to trade under the “No Touch” strategy of the Binary.Com platform with synthetic indexes N.10, N.25, N.50, N.75 and N.100 Similarly, trading can be done with the conventional CALL and PUT strategy of any Binary Options platform. Requirements to use the indicator: 1. Have an account at Binary.Com 2. Configure the Binary.Com d
FREE
The ZigZag Buy Level is a specialized tool for traders who utilize market structure and classic ZigZag patterns to define key support and entry points. It automatically identifies "Main Highs"—significant highs confirmed by the subsequent price action—and then calculates a high-probability "Buy Level" based on a specified percentage pullback from that Main High to the last corrective low. This indicator helps you anticipate deep retracement entries, clearly marking them on the chart with labels
移動平均線クロス、ボリンジャーと移動平均線のクロス、移動平均線の角度でサイン表示 MT5インジケータ こちらに サイト があります。 このインジケータは3つのパターンでサインを表示(切り替え可能)します。 ① 移動平均線のクロス ② ボリンジャーバンドと短期移動平均線とのクロス ③ ボリンジャーバンドと短期移動平均線とのクロスと、中期移動平均線と長期移動平均線の角度 ⓸ ボリンジャーバンドと短期移動平均線とのクロス(サインを交互に表示) 移動平均線のクロス 指定した短期移動平均線と長期移動平均線のゴールデンクロスでは買いサイン、デットクロスでは売りサインを表示します。 ディフォルトでは短期は5,長期は20となっています。 もちろん変更可能になります。 移動平均線の種類をEMA(指数平滑移動平均線)やSMMA(平滑化移動平均)などに変更可能で適する価格も変更可能になります。 ボリンジャーバンドと短期移動平均線のクロス ボリンジャーバンド(以降BB)と短期移動平均線のクロスでサインを表示します。 ディフォルトではBB+1σと5MAのゴールデンクロスで買いサイン、BB-1σと5MAのデット
VFI Quantum
Nikita Berdnikov
5 (1)
Introducing VFI (Volume Flow Indicator) – a trading indicator that analyzes the relationship between volume and price movement to identify key trading opportunities. The indicator displays the strength and direction of volume flow, providing clear signals about potential entry and exit points. Signals are formed based on zero line crossovers, crossovers between the VFI line and its exponential moving average (EMA), and when the indicator exits overbought and oversold zones. Attention! This stra
FREE
Introduction to the Manual Backtesting Indicator on MQL5 The MetaTrader platform provides an excellent backtesting tool for evaluating Expert Advisors (EAs). However, when it comes to manually backtesting a strategy to assess its effectiveness, this tool has some limitations: You cannot manually draw zones or trend lines while in backtesting mode. You cannot switch timeframes to check time alignment. For example, if my strategy requires additional confirmation from a higher timeframe (HTF), this
该产品的买家也购买
Trend Sniper X
Sarvarbek Abduvoxobov
4.9 (40)
Trend Sniper X 是一款适用于 MetaTrader 5 的多周期趋势跟踪指标,可帮助交易者清晰精准地识别趋势方向和潜在的反转点。 适用于 MT4: https://www.mql5.com/en/market/product/193245 价格信息: 当前价格为促销价,随着后续更新和新功能的推出,价格可能会有所变动。 赠品优惠: 购买后联系作者,即可免费获取该指标的 Auto-Trade Assistant EA(自动交易助手 EA)。 Code2Profit 频道 通过多时间框架分析掌控市场! 如何使用 Trend Sniper X 最大化您的胜率:核心规则与交易时段技巧 技术规格 平台 MetaTrader 5 指标类型 多时间周期趋势指标 运行时间周期 任何图表时间周期,可独立选择更高的时间周期 (M1–MN1) 主要交易品种 外汇、黄金 (XAUUSD) 及其他差价合约 (CFD) 推荐账户 任何账户类型 可视化 彩色趋势蜡烛 (买入/卖出/微弱/变化) + 买入/卖出箭头 附加模块 交易时段方框 (悉尼、东京、伦敦、纽约) 主要功能 多时间周期趋势分析: 直接在
Smart Trend Trading System — MetaTrader 5 购买后,请在 MQL5 上给我发消息,即可免费获得 Smart Universal Expert Advisor,以及在线课程、PDF 手册和私人群组访问权限。 STTS 将趋势方向、入场和出场信号、反转区域及重要价格水平集中呈现在图表上。您可以根据系统手动交易,也可以连接单独的兼容 EA,按照您选择的设置自动执行交易。 一套系统,四种交易思路 STTS 将交易方法分为四大类: • 剥头皮交易 — 跟踪短期信号和市场波动。 • 趋势交易 — 评估方向,寻找趋势中的交易机会。 • 反转交易 — 识别潜在的转折区域和方向变化。 • 成交量交易 — 利用成交量相关信息评估市场活跃程度。 入场和出场箭头、趋势信息、支撑与阻力位及反转区域,帮助您直接在图表上分析交易形态。 先从一种方法开始。了解其信号和设置后,再探索其他方法。 从信号到自动化 Smart Universal Expert Advisor 可连接 STTS,让您自动执行受支持的交易信号。 启用自动交易前,请配置指标连接、仓位大小和交易管理设置
Gann Made Easy MT5
Oleg Rodin
5 (10)
Gann Made Easy   是一个专业且易于使用的外汇交易系统,它基于使用先生理论的最佳交易原则。 W.D.江恩。该指标提供准确的买入和卖出信号,包括止损和获利水平。您甚至可以使用推送通知在旅途中进行交易。 购买后请联系我,即可免费获得交易指导和超棒的额外指标! 您可能已经多次听说过江恩交易方法。通常 Gann 的理论不仅对于新手交易者而且对于那些已经有一定交易经验的人来说都是非常复杂的东西。这是因为江恩的交易方法在理论上并不那么容易应用。我花了几年时间来完善这些知识,并将最好的原则应用到我的外汇指标中。 该指标非常易于应用。您所需要的只是将其附加到您的图表并遵循简单的交易建议。该指标不断进行市场分析工作并寻找交易机会。当它检测到一个好的入口点时,它会为您提供一个箭头信号。该指标还显示止损和获利水平。 换句话说,当您像先生一样进行交易时,该指标会为您提供最佳江恩建议。江恩亲自告诉你此时此刻该做什么。但最好的部分是您不需要了解任何有关江恩交易原则的知识,因为该指标会为您完成整个市场分析工作。
ARIPoint
Temirlan Kdyrkhan
1 (4)
ARIPoint is a powerful trading companion designed to generate high-probability entry signals with dynamic TP/SL/DP levels based on volatility. Built-in performance tracking shows win/loss stats, PP1/PP2 hits, and success rates all updated live. Key Features: Buy/Sell signals with adaptive volatility bands Real-time TP/SL/DP levels based on ATR Built-in MA Filter with optional ATR/StdDev volatility Performance stats panel (Success, Profit/Loss, PP1/PP2) Alerts via popup, sound, push, or email Cu
Auto Optimized SpeedAngle 是一款机构级的动量向量化系统,通过持续的前瞻优化(Walk-Forward Optimization, WFO)彻底消除了曲线拟合(curve-fitting)。该指标没有采用在市场 状态转换时容易失效的静态输入参数,而是利用出样外验证(Out-of-Sample, OOS) dynamically 动态重新校准设置,从而确保显示的 信号代表真正的统计优势,而非历史巧合。 核心机构级架构 前瞻优化引擎(Walk-Forward Optimization Engine): 核心算法持续扫描数千种回溯周期(lookback)与阈值组合,严格将数据划分为样本内(in-sample)和样本外(out-of-sample)。只有当参数配置在未知数据环境中证明具备数学优越性时,系统才会对其进行 adoption。 量化目标函数(Quantitative Objective Functions): 优化引擎不一味追求绝对毛利,而是聚焦于机构级的稳定性指标。用户可针对系统质量数(SQN)、期望值(每笔交易的平均 R 倍数)或净 R 值进行优化,从而优
Neuro Poseidon MT5
Daria Rezueva
4.75 (52)
Neuro Poseidon is a new indicator by Daria Rezueva. It combines precise trading signals with adaptive TP/SL levels - creating best possible trades as a result! Message me and get  Neuro Poseidon Assistant  as a gift to automize your trading process! What makes it stand out? 1. Proven profitability on all assets and timeframes 2. Only confirmed BUY and SELL signals present on the chart 3. Adaptive TP & SL levels generated by the software for each trade 4. Easy to understand - suitable for al
Entry Points Pro for MT5
Yury Orlov
4.52 (151)
传奇回归:Entry Points Pro 10。 这款传奇指标曾 3 年稳居 MQL5 Market 前三,如今全面重启。 数百条热情好评(两个版本合计 589 条),每天有数千名交易者用它交易,演示版下载 31,000+   MT4+MT5  次。 五年来我读过你们的每一条评价——在第 10 版里,我没有给出许诺,而是把答案直接做进了产品。指标作者自 1999 年入市, 珍视诚信、自己的声誉和自己的客户 。 Entry Points Pro 给出的入场信号严格不重绘。 而且这一次不再只是作者的一面之词,而是可验证的事实:确认信号只在 K 线收盘后标出,自动化测试记录到 零重绘 (在 EURUSD、XAUUSD 和 BTCUSD 上共 2,486,568 次不变量检查——0 次违规)。测试方法完全公开——您可以在策略测试器中自行复现。 购买后请务必第一时间给我发私信。 我会发给您 扩展版说明书《交易者圣经》 ——使用本指标交易的完整指南——并告诉您如何免费获得 赠品:市场扫描器 ,它能同时分析多个品种和多个时间周期,并在一个界面上显示 Entry Points Pro 此刻在哪里表现
Welcome to ENTRY IN THE ZONE AND SMC MULTI TIMEFRAME SPECIAL BENEFIT / FOR OUR MQL5 CUSTOMERS FREE ACCESS TO THE NEW TOOL  — COMING SOON — Learn more on our official website  : https://www.fableedge.net Entry In The Zone and SMC Multi Timeframe is a real-time market analysis tool based on Smart Money Concepts (SMC), designed to analyze market structure, price direction, and key trading zones. It supports both Single-Timeframe Analysis and Multi-Timeframe Analysis, providing a clearer view of the
Unix Scalper
Issam Kassas
4 (4)
Unix Scalper — MetaTrader 5 购买后,请在 MQL5 上给我发消息,即可免费获得 Smart Universal Expert Advisor,以及在线课程、PDF 手册和私人群组访问权限。 发现交易形态,看清交易计划,选择执行方式。 UNIX Scalper 将市场分析、BUY/SELL/WAIT 决策以及 Entry、Stop Loss、TP1 和 TP2 水平集中在一个清晰的面板中。 看清信号与交易计划 • 明确的决策:BUY、SELL 或 WAIT。 • 明确的价格水平:Entry、Stop Loss、TP1 和 TP2。 • 多时间周期概览:比较面板中各时间周期的信号。 • 辅助分析:趋势、动量、成交量、波动率、支撑与阻力,以及市场质量。 • 灵活的布局:Minimized、Compact、Standard 或 Full。 查看信号,检查价格水平,再判断该交易形态是否符合您的交易规则。 从黄金和比特币开始 建议首先使用的交易品种:XAUUSD 和 BTCUSD。 探索短期剥头皮交易和较高时间周期分析。选择历史K线范围,通过表现曲线查看所选设置
M1 Sniper MT5
Oleg Rodin
5 (7)
M1 SNIPER   是一款易于使用的交易指标系统。它是一个专为 M1 时间框架设计的箭头指标。该指标可以作为独立的系统在 M1 时间框架下进行剥头皮交易,也可以作为您现有交易系统的一部分使用。虽然该交易系统专为 M1 时间框架交易而设计,但它也可以用于其他时间框架。我最初设计此方法是为了交易 XAUUSD 和 BTCUSD。但我发现这种方法在其他市场交易中也同样有用。 指标信号既可以顺势交易,也可以逆势交易。我教授一种特殊的交易技巧,帮助您利用指标信号进行双向交易。该方法基于使用特殊的动态支撑位和阻力位区域。 购买后,您可以立即下载 M1 SNIPER 箭头指标。此外,我还为所有 M1 SNIPER 工具用户免费提供下方屏幕截图所示的 Apollo Dynamic SR 指标!这两个指标的组合可以帮助您更轻松、更准确地利用 M1 时间框架进行交易。 购买后请联系我,免费获取交易提示和奖励指标! 祝您交易成功!
Adaptive Price Action Engine 买指标,免费送EA 自适应多时间框架趋势与K线形态智能分析系统 市场环境始终在变化,不同的市场阶段中,并非所有 Price Action 形态都具有相同的参考价值。 Adaptive Price Action Engine 旨在适应不断变化的市场条件,将 趋势结构、多时间框架分析、K线形态与统计优化 整合到一个统一的分析框架中。 两种自适应模式 Dual Alpha Trend Mode(双 Alpha Trend 模式) 自动搜索适合的 Alpha Trend 参数,并结合低周期与高周期市场结构,使指标能够根据近期市场行为动态调整趋势识别。 Candlestick + Alpha Mode(K线 + Alpha 模式) 将 Alpha Trend 市场状态与 22种多空K线形态 相结合。系统不会简单地对所有形态一视同仁,而是对不同的形态组合进行统计评估,并识别在特定市场环境下表现出更强历史统计特征的配置。 主要功能 趋势参数自动优化 多时间框架市场状态分析 22种多头与空头 Price Action K线形态 对数千种可能
Power Candles MT5
Daniel Stein
4.58 (12)
Power Candles V3 - 自我优化的强度指标 Power Candles V3 把货币与品种的强度直接转化为图表上可执行的交易方案。指标不再仅根据强度给K线着色,而是在后台持续运行实时自动优化,为您正面对的品种给出最佳 Stop Loss、Take Profit 与信号阈值。一键采用,Entry、Stop Loss、Take Profit 线就以精确价格绘制在图表上,提醒消息中直接包含方向。 本工具是 Stein Investments 生态系统的一部分 - 18+ 款工具,加上 Max,您的一对一 AI 交易导师。  随时在线,深入了解每一款指标,在您需要梳理思路的那一刻就在那里。  立即认识他: https://stein.investments 每根收盘K线运行 3,000+ 次交易模拟。9 种强度状态。2 种策略并行测试。一键采用最优配置。 为什么需要这个 大多数强度指标只给您一个数值,然后留下三个问题:相信哪个阈值、用哪个 Stop Loss、走哪个交易方向。Power Candles V3 在每根收盘K线上自动回答这些问题。结果就是一个完整的交易方案 -
Scalper Vault   是一个专业的剥头皮系统,为您提供成功剥头皮所需的一切。该指标是一个完整的交易系统,可供外汇和二元期权交易者使用。推荐的时间范围是 M5。 该系统为您提供趋势方向的准确箭头信号。它还为您提供顶部和底部信号以及江恩市场水平。无论您拥有何种交易经验,该系统都易于使用。您只需要遵循简单的规则并每天重复该过程。 建议将此系统用于主要货币对。感谢您的关注! 请注意,该指标在策略测试器中可能无法正常工作。因此,我建议仅在模拟或真实账户的真实交易条件下使用该系统。 指示器提供所有类型的警报,包括推送通知。 购买指标后请与我联系。我将免费与您分享我的个人交易建议和出色的奖励指标! 祝您交易愉快,盈利!
Atomic Analyst MT5
Issam Kassas
4.47 (60)
Atomic Analyst — MetaTrader 5 购买后,请在 MQL5 上给我发消息,即可免费获得 Smart Universal Expert Advisor,以及在线课程、PDF 手册和私人群组访问权限。 Atomic Analyst 将价格行为、趋势方向、入场和出场信号、止损位及多个止盈位集中呈现在图表上。 看清信号,理解交易形态 Atomic Analyst 将分析结果整理为清晰的可视化信息: • 买入和卖出箭头,用于识别潜在的入场机会。 • 止损位和多个止盈位,帮助规划交易。 • 趋势、强度和动量读数,用于评估市场方向。 • 多时间周期分析,用于比较更广泛的市场背景。 • 彩色K线和提醒,帮助您跟踪变化的市场条件。 结合辅助分析查看信号,再判断该交易形态是否符合您的交易规则。 从短期形态到更大级别的行情 您可以将 Atomic Analyst 用于剥头皮交易、日内交易,或跟踪持续时间更长的市场走势。 建议从 H1 时间周期开始。建议交易品种包括 EURUSD、AUDUSD 和 XAUUSD。 从信号到自动化 Smart Universal Expert A
Divergence Bomber
Ihor Otkydach
4.89 (94)
购买该指标的每位用户将额外免费获得以下内容: 原创工具“Bomber Utility”,该工具会自动跟踪每一笔交易,设置止损和止盈点,并根据策略规则自动平仓; 适用于不同交易品种的指标设置文件(Set 文件); 三种不同风险模式下的 Bomber Utility 设置文件:“最低风险”、“平衡风险” 和 “观望策略”; 一套详细的 视频操作手册,帮助您快速完成安装、配置并开始使用本交易系统。 注意: 要获取以上所有赠品,请通过 MQL5 的私人消息系统联系卖家。 我为您介绍原创的自定义指标 “Divergence Bomber”(背离轰炸机),它是一套基于 MACD 背离交易策略 的“全功能”交易系统。 该技术指标的主要任务是识别 价格与 MACD 指标之间的背离,并发出交易信号(包括推送通知),指示未来价格可能的运动方向。平均而言,这些信号的准确率超过 98%。有关该指标如何工作的详细说明,请观看本页面上的视频演示。 该系统使用 止损订单 和 动态回撤平仓机制 来管理交易。 Divergence Bomber 指标的主要特点: 支持交易的品种: AUDCAD、AUDCHF、AUDS
Crystal Heikin Ashi Signals
Muhammad Jawad Shabir
5 (4)
Crystal Heikin Ashi Signals—Professional Trend & Signal Detection Indicator Advanced Heikin Ashi Visualization with Intelligent Signal System for Manual & Automated Trading Final Price: $149 ---------> Price goes up $10 after every 10 sales . Limited slots available — act fast . Overview User Guide PDF Crystal Heikin Ashi Signals is a professional-grade MetaTrader 5 indicator that combines pure Heikin Ashi candle visualization with an advanced momentum-shift detection system. Designed for both m
DayTrader PRO
Davit Beridze
5 (4)
DayTrader PRO DayTrader PRO 是一款先进的交易指标,它结合了约翰·埃勒斯 (John Ehlers) 的 Laguerre 滤波器与强大的自动优化引擎。该指标不依赖固定的参数,而是根据最新的市场状况自动搜寻最佳设置,帮助您在无需手动调整的情况下适应不断变化的市场波动。 该指标可生成清晰的买入 (BUY) 和卖出 (SELL) 信号,并提供根据当前市场波动率计算得出的自适应止损 (Stop Loss) 和止盈 (Take Profit) 水平。内置的趋势、效率系数 (Efficiency Ratio)、波动率和蜡烛图过滤功能,有助于剔除低质量的交易设置,从而提高信号的准确性。 实时性能面板会显示当前已优化的设置、利润因子 (Profit Factor)、胜率 (Win Rate)、回撤 (Drawdown) 以及其他交易统计数据。DayTrader PRO 还支持弹出窗口、推送、邮件和声音提醒,确保您不会错过任何交易机会。 主要功能 全自动参数优化 自适应买入与卖出信号 基于 ATR 的动态止损与止盈 支持每日、每周或每月重新优化 内置趋势与市场过滤功能 性能统
Quant Direction MT5
Georgios Kalomoiropoulos
Quant Direction 是一款三维市场分析工具。它通过同时计算多个维度上的精确百分比偏差,提供完全客观的、基于算法的市场分析视角。该算法采用先进的人工智能建模工具开发,并经过全面测试,旨在以独特的精准度解读市场。它可以分析您平台上的任何货币对或金融工具。 无论您是短线 交易者、日内 交易者还是波段交易者,Quant Direction 都是您的理想之选。 交易者的真正优势 Quant Direction 的真正优势在于彻底消除情绪、屏幕疲劳和过度思考。它无需手动点击十几个图表来寻找方向并反复质疑自己的偏好,引擎即可在几毫秒内即时处理 8 个时间周期(从 5 个月到月线)。它能准确告诉你任何时刻谁在掌控市场,确保你始终朝着概率最高的方向进行交易。 市场分析的三个维度 该算法将市场分为三个不同的交易维度,为您提供完整的宏观和微观视角: 超短线交易分析: 捕捉即时、快速的动量变化和较低时间框架的执行点。 日内分析: 识别真实的、潜在的每日方向性偏差。 波动分析: 专注于宏观趋势,确保您不会与大盘机构的走势背道而驰。 独家评分引擎 Quant Direction 的底层采用了一套
Btmm state engine pro
Garry James Goodchild
5 (4)
BTMM State Engine Pro by G-Labs — Beat The Market Maker indicator for MetaTrader 5. Asian session range, London and New York kill zones, level progression (L1/L2/L3), peak formation detection (PFH/PFL), entry signals, and a multi-pair scanner from one chart. Stop scanning charts one pair at a time. The State Engine tracks the BTMM daily cycle automatically — Asian box, room boundaries, level blocks, peak formations, and filtered entries — while the scanner dashboard shows level, peak status, d
SkyHammer Signal Pro
Shengzu Zhong
5 (4)
SkyHammer Signal Pro Professional No-Repaint Trend Signal Indicator with Locked Entry, SL and TP Levels SkyHammer Signal Pro is a structured trend and momentum signal indicator designed for traders who want clear, fixed, and verifiable trading signals. It works best on lower timeframes such as M1 and M5 . The indicator does not try to predict tops or bottoms. Instead, it waits for confirmed market structure, trend direction, momentum strength, volatility quality, and target space before generati
Precision Spike Detector
Francisco Mandomo Simbine
5 (2)
Precision Spike Detector V3 – Institutional-Grade AI Trading System Attention: The price increases by US$50 for every 10 purchases.  Final price: US$599 Precision Spike Detector V3   is a   state-of-the-art, institutional-grade market analysis system   for   MetaTrader 5 , designed to detect   high-probability market movements   in synthetic indices such as   Boom, Crash, GainX, and PainX . After purchase, send me a private message to receive the optimized configuration files,  the installation
UZFX {SSS} 超短线智能信号 v5.0 MT5 是一款无重绘的高性能交易指标,专为在快速波动的市场中需要精准、实时信号的超短线交易者、日内交易者和波段交易者设计。该指标由 (UZFX-LABS) 开发,融合了价格行为分析、趋势确认和智能过滤技术,可在所有货币对和时间周期内生成高概率的买卖信号、预警信号以及趋势延续机会。 别再对交易犹豫不决了,开始遵循这一专为追求清晰、精准和纪律性市场执行的交易者设计的结构化信号系统吧。 相信我,这是 MQL5 上最优秀的指标之一,所以千万不要错过!!“为睿智交易者打造的智能信号” 最新 5.0 版本现已发布,价格可能会在未事先通知的情况下上涨至 499.99 美元,所以请尽快入手,以免错失良机!! 最终购买前!如果您想获取免费试用版,请通过 WhatsApp 号码 +923030751987 联系我!! 如果您遇到任何问题“或”有任何不明白的地方,请在私聊中向我咨询!!! 主要功能更新 • 自动买入和卖出信号检测 • 先进的反转识别逻辑 • 潜在市场反转前的预警信号 • 趋势延续确认信号 • 内置风险管理功能,包含入场点、止损点、TP1、
Spike Fakeout Detector
Brighton Mufaro Mudzingwa
PainX 400 FAKEOUT DETECTOR MT5 Custom Indicator  ·  Sell-Side Bias  ·  Scalping  ·  RSI(6) Filtered   OVERVIEW   The Spike Fakeout Detector is a non repaint precision technical indicator built exclusively for Crash / PainX synthetic indices on the platform. It is engineered around one of the most consistent and exploitable patterns on this instrument — the false breakout above resistance followed by a sharp price drop. Crash/PainX is a growing index that produces a significant price drop app
货币强度向导是一个非常强大的指标,为您提供成功交易的一体化解决方案。该指标使用多个时间范围内所有货币的数据来计算这个或那个外汇对的力量。此数据以易于使用的货币指数和货币电力线的形式表示,您可以使用它们来查看这种或那种货币的力量。 您所需要的只是将指标附加到您要交易的图表上,该指标将向您显示您交易的货币的真实强度。该指标还向您显示买卖量压力的极值,您可以在顺势交易时利用这些压力。该指标还显示了基于斐波那契的可能目标。该指标可用于各种交易时间范围。该指标支持各种货币对的交易。   该指标为您提供所有类型的警报,包括推送通知。 购买后请联系我。我将与您分享我的交易技巧,并免费为您提供丰厚的红利指标! 祝您交易愉快,获利丰厚!
Mahra Pro Indicator MT5
Mahra Said Mohammed Al Kaabi
Mahra Pro Indicator MT5 Overview Mahra Pro is a MetaTrader 5 chart indicator designed to support structured analysis of XAUUSD (Gold). It combines trend, momentum, volatility and price-structure conditions to identify potential buy and sell setups and display them directly on the chart. The indicator does not open, modify or close trades. All trading decisions and order execution remain under the user's control. Main features • Buy and sell signal arrows on the chart. • Fast and slow EMA lines w
FootPrint Chart MT5
Gayathiri Gopalakrishnan
Turn every candle into a bid x ask footprint built from real tick data. See who is actually trading at each price, with delta, volume profile, imbalance zones and a scored setup engine that prints entry, stop and target Order Flow Footprint Chart Pro Most indicators tell you what price did. This one tells you who did it. Order Flow Footprint Chart Pro rebuilds every candle on your chart from raw tick data and shows you the volume that traded at each individual price inside it, split into the am
M1 Quantum MT5
Hamed Dehgani
4.2 (10)
使用 M1 Quantum 的实盘交易信号 : 信号 (交易由 Quantum Trade Assistant 自动 执行,并作为本产品 免费 提供。) 最新消息: 版本 1.64 已发布。现在所有交易的止损都会设置在相应的支撑位/阻力位之后。Smart Close 功能也进行了改进,以提升此版本 EA 的性能。 自 8 月 9 日起,实盘信号一直运行在版本 1.64 上。 价格计划: 当前价格: $169 (早期用户优惠) 下一阶段计划价格: $189 计划零售价: $299 开发者提示: 购买后请联系我,以获取 最新推荐的参数设置文件(Set File) 、交易建议,以及加入 VIP 支持群组 ,与其他 M1 Quantum 用户交流经验。 常见问题 - 设置文件 - 安装指南 M1 Quantum 是一款专业的 M1 交易系统,提供快速且精准的交易信号,并内置止损(Stop Loss)、止盈(Take Profit)以及智能资金管理功能。 M1 Quantum 包含专业的资金管理系统,通过专注于 连续盈利交易 ,帮助交易者更快地增长账户资金。 M1 Quantum 指标 的主
SR Liquidity MT5
Oleg Rodin
5 (2)
SR Liquidity   是一款旨在揭示市场流动性高度集中且价格反应最剧烈的隐蔽区域的交易指标。这些特殊的流动性区域充当着强有力的支撑位与阻力位,为您清晰呈现市场最可能发生反转的位置。 SR Liquidity 指标并非简单地绘制常规的支撑/阻力线,而是通过分析实际的价格行为,识别买卖压力积聚的区域。这些区域实际上是推动市场真实波动的流动性池。通过在图表上直观呈现这些区域,该指标能助您在价格反应发生前预判走势——这意味着它实际上能够预测价格方向可能发生的变化。它将原始的价格行为转化为清晰且具实操价值的市场蓝图,标示出那些可能成为市场转折点的关键价位。 该指标适用于任何交易品种和时间周期——包括外汇、指数、金属、加密货币等。支持任意时间周期。 购买后请联系我,以获取交易指南及免费赠送的优质附加指标!
可以说,这是您可以为MetaTrader平台找到的最完整的谐波价格形成自动识别指标。它检测19种不同的模式,像您一样认真对待斐波那契投影,显示潜在的反转区域(PRZ),并找到合适的止损和获利水平。 [ 安装指南 | 更新指南 | 故障排除 | 常见问题 | 所有产品 ] 它检测19种不同的谐波价格形态 它绘制了主要,衍生和互补的斐波那契投影(PRZ) 它评估过去的价格走势并显示每个过去的形态 该指标分析其自身的质量和性能 它显示合适的止损和获利水平 它使用突破来表明合适的交易 它在图表上绘制所有样式比率 它实现了电子邮件/声音/视觉警报 受斯科特·M·卡尼(Scott M. Carney)的书的启发,该指标旨在满足最纯粹和最熟练的交易者的需求。但是,它采取了一种使交易更容易的方式:在向交易发出信号之前,它会等待Donchian朝正确方向突破,从而使交易信号非常可靠。 斐波那契投影与向量无关 它实现了电子邮件/声音/推送警报 它绘制了ABCD投影 重要提示: 为了符合 Scott M. Carney先生 的商标申诉,某些图案名称已重命名为不言自明的替代方式, Scott M.
Finesia Scalper
Robby Suhendrawan
Finesia Scalper - 高胜率 & Non-Repainting 系统 您是否正在寻找一款功能强大、高胜率的交易指标,以消除图表上的猜测? Finesia Scalper 是一款专业级的、100% 不重绘 (non-repainting) 的交易工具,旨在为您提供极致的精准度。 建立在经过验证的算法之上,该指标将三种高效的交易方法无缝结合到一个统一的系统中。其结果是一个高度准确的动态映射系统,准确地告诉您在哪里入场、在哪里放置您的 Stop Loss 以及在哪里锁定您的利润。 严格的 Non-Repainting 逻辑 交易者需要可靠性,而这正是 Finesia Scalper 所提供的。一旦信号被确认并且目标线打印在您的图表上,它们就永远不会移动、消失或重新计算。该系统是完全不重绘的。Stop Loss 始终是 Stop Loss,Take Profit 始终是 Take Profit。所见即所得,让您能够信任您的图表并以绝对的信心进行交易。 如何使用 Finesia Scalper 进行交易 使用该系统进行交易具有高度的机械性和直接性,完全消除了您交易日常中的情绪化决定
作者的更多信息
Simba Prop Firm EA
Emmanuel Ndacyayisenga
SIMBA PROP FIRM EA PROP-FIRM-FOCUSED EXECUTION & ADAPTIVE RISK MANAGEMENT Trade the opportunity. Protect the account. Respect the rules. SIMBA Prop Firm EA is an Expert Advisor designed for traders who want a more structured approach to prop-firm trading, risk management, trade execution, and position management . A prop-firm account is not managed like an ordinary trading account. The account may have a large nominal balance, but your practical trading capacity is determined by the firm's daily
Simba Gravity Signal
Emmanuel Ndacyayisenga
SIMBA GRAVITY SIGNAL Find Where Price Has Weight Every trader has experienced it. You open a chart and begin marking levels. Support. Resistance. Previous highs. Previous lows. VWAP. Higher timeframe structure. Before long, the chart is covered with lines. The real challenge is no longer finding information. The challenge is knowing which information actually matters. SIMBA GRAVITY SIGNAL was built to solve that problem. Instead of treating every level equally, SIMBA analyzes multiple layers of
FREE
Simba Market Picker
Emmanuel Ndacyayisenga
SIMBA MarketPicker SIMBA MarketPicker is a MetaTrader 5 indicator designed for market scanning, comparison, and market selection . It is provided free of charge and is intended to help traders organize multiple instruments in one view, compare their current technical conditions, and identify markets that may deserve further analysis. iInstead of examining every symbol individually, MarketPicker provides a structured view of configured markets and applies the same analytical framework across them
FREE
Simba Bot Scanner
Emmanuel Ndacyayisenga
SIMBA BOT SCANNER 2.77 Scan. Select. Execute. Protect. Manage. One MetaTrader 5 Expert Advisor. Multiple layers of trading intelligence. SIMBA Bot Scanner is a multi-market MT5 trading system designed to bring market scanning, setup evaluation, market selection, automated execution, trade management, risk control and manual-trading protection into one integrated environment. If you are looking for an MT5 Expert Advisor to support your prop-firm challenge, funded-account workflow, or personal tra
Simba Position Manager
Emmanuel Ndacyayisenga
SIMBA POSITION MANAGER Trade Your Setup. Understand Your Position. You found the setup. You opened the trade. Now what? This is where many traders struggle. Finding an entry is only one part of trading. Once a position is open, you still need to understand whether the trade is progressing, how much risk remains, when the position reaches important R-multiples, whether momentum is strengthening or weakening, and whether market conditions continue to support the trade. SIMBA Position Manager is de
SIMBA Manual Assistant Pro You Already Know How to Enter. Now Manage the Trade With a Plan. You already have a trading strategy. Maybe you trade support and resistance. Maybe breakouts, price action, moving averages, market structure, supply and demand, or something completely different. You know how you want to enter. But what happens after you enter? Should you move your stop-loss to break-even? Should you take partial profit? Should you let the trade run? Is that pullback normal, or is the m

Simba Price Navigator
Emmanuel Ndacyayisenga
SIMBA Price Navigator Stop asking “Buy or Sell?” — start asking “Where is price going, and what would prove me wrong?” You can have a great trading strategy and still struggle with one simple question: Where is price likely to go next? Your strategy may tell you when to enter. Your indicators may tell you the trend. Your Fibonacci levels may show important areas. But what about the destination ? That is where SIMBA Price Navigator comes in. SIMBA Price Navigator is an MT5 analysis indicator desi
SIMBA POSITION MANAGER PRO You already know how to enter. SIMBA helps you manage what happens next. After more than 5 years of trading, I have learned something that many traders discover the hard way: Finding an entry is not the hardest part of trading. Managing the position after you enter is. There is almost nothing more frustrating than closing a good trade too early... Only to watch price continue directly toward the take-profit you originally planned. And there is almost nothing worse than

Simba Cloud EA
Emmanuel Ndacyayisenga
SIMBA CLOUD EA  ADAPTIVE TRADING • INTELLIGENT RISK CONTROL • AUTOMATED POSITION MANAGEMENT Read the market. Adapt to the regime. Control the risk. Protect the profit. SIMBA CLOUD EA is a regime-adaptive Expert Advisor for MetaTrader 5, designed to combine market analysis, adaptive risk management, capital protection, multi-symbol monitoring, and automated position management in one system. Markets do not behave the same way all the time. A strong trend, a normal trend, a range, and a choppy mar
筛选:
无评论
回复评论