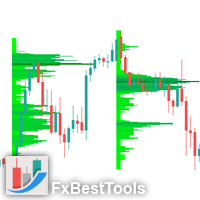
Volume Profile Sessions and Range Pro

See where the market really traded — not just where price went.

Most tools only show you price. This indicator shows you where the volume actually was — the exact levels where traders committed the most money, the zone that held most of the activity, and the spots that tend to trigger support, resistance, or fast, violent moves. It's the difference between guessing at a level and trading a level the market has already proven matters.

Drop it on any chart and instantly get clean, accurate volume profiles for sessions (Tokyo, London, New York), full days, full weeks, a rolling multi-day view, or any custom range you draw yourself.

Why traders reach for this one

  • See the real story, not the candle guess. Profiles are built from granular M1 data, not the timeframe you're looking at — so a single 1-hour candle can't smear its volume evenly across the whole bar and hand you a distorted level.
  • Never trade a blind level. POC, Value Area High/Low, and real peak-detected High/Low Volume Nodes are drawn automatically, using the same Value Area method used on professional platforms.
  • Get alerted the moment it matters. Set a POC touch alert and get a popup, a phone push, or a sound the second price comes back to a level worth watching — with a cooldown so you're not spammed.
  • Run it your way, live. Flip sessions, lines, and histograms on or off from an on-chart panel — no digging through settings mid-trade. Your layout is remembered across timeframes.
  • It won't lie to you when data is thin. If your broker doesn't provide real volume, it switches to tick volume automatically and tells you in the log — so you're never staring at a blank or misleading profile.

What you get

  • Session profiles — a separate volume profile for the Tokyo, London and New York sessions, each in its own dashed box.
  • Daily and Weekly profiles — one profile per day or per week, with start times you can set to match your broker's daily rollover.
  • Right-side multi-day profile — one combined profile of the last several trading days (you choose how many), pinned next to the price scale, with rows growing to the left. Stays put as you scroll and zoom, and can hide itself once you scroll back into history so it never gets in the way.
  • Manual profile on any range — tap two points on the chart and get a full profile for exactly that range. On desktop, drag the box to move it or drag a corner to resize it, and the profile rebuilds automatically.
  • POC, VAH and VAL lines — Point of Control, Value Area High and Value Area Low, using the standard Value Area method.
  • HVN and LVN lines — High and Low Volume Nodes found by real peak-and-valley detection, so small bin-to-bin noise never gets marked as a node.
  • Buy / sell colors — split each row into buy volume and sell volume, or keep it a clean single color.
  • POC touch alert — popup, phone push notification, and/or sound when price comes within your chosen distance of a POC.
  • On-chart control panel — switch sessions, lines and the histogram on or off, change how many days back to show, hide everything with one tap, and draw manual profiles — all without opening the settings window.

Built for accuracy

  • Built from lower-timeframe data (M1 by default), not the candles you happen to be viewing.
  • Up to 1000 price rows per profile for a fine, detailed histogram — or fewer for a chunkier look.
  • Automatic tick-volume fallback with a log notice, so you're never left with a blank or misleading profile.
  • Thin rows near the high and low of a profile stay visible even when you zoom out.

Good to know

  • Session hours are in your broker's server time and must be set for your broker — offsets vary between brokers.
  • Many forex and gold (CFD) brokers only provide tick volume, not real traded volume. The profile then runs on tick volume, still widely used to see where activity concentrated.
  • Volume profile is an analysis tool. It shows where trading happened; it does not predict the future and does not guarantee profit.

Full input parameters

Session hours (server time, 0–23)

  • Tokyo / London / New York start hour and end hour — when each session begins and ends. An end hour earlier than the start hour means the session passes midnight.
  • Daily start hour / end hour — the window of the Daily profile. Set both to the same hour for a full 24-hour day starting at that hour (e.g. 17 and 17 for a 17:00 rollover).
  • Weekly start day / start hour — when the Weekly profile begins (0 = Sunday … 6 = Saturday). The week runs for exactly 7 days from that moment.

Sessions to show

  • Show Tokyo / London / New York session, Show Daily profile, Show Weekly profile — choose which profiles are drawn, or switch them live from the control panel.

Accuracy

  • Data timeframe — the timeframe used to build the profile. Lower is more accurate (M1 by default) but needs more history.

Profile settings

  • Price rows per profile — how many price rows each profile has. More rows give a finer profile.
  • Gap between rows — space between rows as a percent of row height. 0 gives a solid "mountain" look.
  • Widest bar — width of the longest bar as a percent of the session width.
  • Minimum bar width — the smallest width, in pixels, any row can have, so low-volume rows stay visible. 0 turns it off.
  • Days to show / Weeks to show — how many days or weeks back to draw (also changeable on the control panel).
  • Value Area % — share of volume inside the Value Area. 70 is the usual setting.
  • Use real volume — on for real volume, off for tick volume. Falls back to tick volume automatically if the symbol has none.
  • Show volume profile bars / POC line / VAL line / VAH line — turn each element on or off.
  • Show today's forming session — include the session still in progress, so it updates live.
  • Line style — draw lines only inside the session box, or extend them to the right.
  • Show session name label / Show price labels on lines — text labels on or off.

High / Low Volume Nodes

  • Show HVN lines / Show LVN lines — turn node lines on or off.
  • HVN minimum strength / LVN minimum depth — how much a peak or valley must stand out, as a percent of max volume, to count as a node. Higher means fewer, stronger nodes.
  • Min gap between nodes — minimum distance between two nodes, as a percent of the price range.
  • Max HVN lines / Max LVN lines per session — the most node lines drawn for each profile.

POC touch alert

  • Enable POC touch alert — turn the alert on.
  • Choose POC lines by clicking them — click POC lines on the chart to pick exactly which ones to watch.
  • Which session's POC to watch — Tokyo, London, New York, Daily, Weekly, or all shown sessions.
  • Watch only the latest POC per session — on to watch just the newest POC of each session instead of every POC on the chart.
  • Touch distance (pips) — how close price must get to count as a touch. 0 means the exact price.
  • Minutes between repeat alerts — cooldown before the same level can alert again.
  • Popup alert / Push notification to phone / Play sound / Sound file — choose how you're alerted. Push needs your MetaQuotes ID set up in the terminal.

Colors

  • Bar colors (buy and sell), POC / VAL / VAH / HVN / LVN line colors, session, Daily and Weekly box colors, label color — set every color to match your chart theme.

Dashboard

  • Show control panel, Panel X / Y position, Panel corner — show or hide the on-chart panel and place it where you want.

Manual volume profile

  • Manual profile box color — color of manually drawn profiles.
  • Max manual profiles kept — how many manual profiles can exist at once. Drawing another removes the oldest.
  • Auto-scale bar width to box height, Bar width vs box height, Max bar width — keep manual profiles looking consistent after you change timeframe or zoom.

Right-side profile (multi-day)

  • Show right-side profile — turn the whole profile on or off.
  • Show profile bars / POC / VAL / VAH line — choose what it displays.
  • Trading days covered — how many real trading days it combines. Weekends and holidays are skipped.
  • Include today's forming session — count today as one of those days so it updates live.
  • Price rows — number of rows for this profile. 0 uses the main row setting.
  • Widest bar — width of the longest bar as a percent of the visible chart width.
  • Gap to price scale — space in pixels between the profile and the price scale.
  • Extend lines back to today's open — lets its POC / VAH / VAL lines run back to today's open.
  • Gap between rows, Single color, Bar color — control how the rows look.
  • Show outline box and label, Outline box color — optional frame and title.
  • Hide when scrolled off the live edge, Live-edge tolerance — hides the profile when you scroll back into history.

Feedback and support

Questions, ideas, or a feature you'd like to see? Send a message here on MQL5 or leave a comment on the product page — I read every one. If the indicator helps you, a review is very much appreciated.

Рекомендуем также
uGenesys AI - 90% Accurate Daytrading Indicator Introducing the ultimate forex trading indicator system, uGenesys AI, powered by cutting-edge AI technology and advanced analytical techniques, including Time-Series Analysis and Genetic Algorithms. Our AI-powered trading system leverages the power of time-series analysis to identify trends and patterns in historical price data, allowing traders to make informed predictions about future market movements. By analyzing vast amounts of data, our syst
Manual Volume Profile MS shows where volume was actually traded. It draws today's session profile live and lets you place up to 10 independent volume profile ranges anywhere on the chart with two mouse clicks. Every profile shows the POC, VAH, VAL and the Value Area. KEY FEATURES Daily profile – today's volume profile, drawn to the right of the current bar or over the day's bars, updated live. Manual ranges PV 1 – PV 10 – click a PV button, click the start and the end of the range, and the profi
AURUM MID-QUANT PRO v5.60 Quantitative Excellence for Gold (XAU/USD) & Volatility Trading Gain a professional edge over institutional markets with AURUM MID-QUANT PRO , an advanced Price Action Pattern Detection and Breakout Engine designed exclusively for MetaTrader 5 . Built specifically to capture the unique volatility of Gold (XAU/USD) and other major financial instruments, this powerful indicator combines high-precision algorithmic pattern recognition with real-time dynamic accumulation z
Многорежимный анализ объема: анализируйте объем по-своему, а не по алгоритму индикатора. Большинство индикаторов профиля объема ограничивают трейдеров заранее определенными диапазонами анализа. Но рынок не движется в рамках фиксированных шаблонов, так почему же ваш анализ должен двигаться в их рамках? Индикатор Volume Profile Multi-Mode предоставляет вам полную свободу выбора места, времени и способа анализа объема. Независимо от того, изучаете ли вы структуру рынка, составляете профилю торговые
Wat Machine
Watson Dyton Mulenga
WAT MACHINE — Product Description DOES NOT REPAINT. EVER. WAT MACHINE is a precision signal indicator for MetaTrader 5 that identifies high-probability turning points in the market and plots clean buy and sell arrows directly on your chart — exactly where price is most likely to reverse. No guessing. No repainting. No chasing. The signal is confirmed and locked in. What you see is what was there. HOW TO USE IT When an arrow appears, you have two options: Direct entry — enter at market on the nex
X Sensors Pro — это профессиональный индикатор профиля объема, который визуализирует распределение торгового объема по ценовым уровням за выбранный период. Индикатор автоматически определяет локальные экстремумы (HH и LL), рассчитывает Point of Control (POC) — уровень с максимальным объемом, а также строит уровни поддержки и сопротивления на основе выявленного диапазона.   Основные возможности: ·                       Визуализация профиля объема в виде цветных гистограмм ·                      
Индикатор Rocket Trend трендовый. Индикатор рисует вдоль графика двухцветные точки соединенные между собой линиями. Это трендовый индикатор, представляет из себя алгоритмический индикатор. Прост в работе и понимании при появлении синего кружка необходимо покупать, при появлении красного - продавать. Индикатор используется для скальпинга и пипсовки, не плохо себя зарекомендовал. Rocket Trend доступный для анализа направления тренда за конкретный отрезок времени. Идеально подходит для начинающих
Manyal trading system, CovEchoTrend Robot, focuses on reliability and flexibility. By employing statistical analysis methods to study the relationships between the base indicator and market patterns, the system enables a deeper understanding of market processes. Intelligent pattern analysis: The application of statistical data processing helps identify key trend reversal points more accurately, signaling significant market shifts. Informed decision-making is based on the intersection of indicato
Pattern Recognition EA - From Learn to Earn. The market repeats itself. This EA finds every past repeat of the current candle sequence - and lets history vote the direction. ONE SHAPE. EVERY REPEAT IN HISTORY VOTES. The last N candles on your signal timeframe form a shape. The EA scans the history you choose - a fixed number of bars or everything your broker provides - for the SAME shape, and checks what happened next, every single time. Only when enough repeats exist AND a clear majority of t
Gioteen Volatility Index (GVI) - your ultimate solution to overcoming market unpredictability and maximizing trading opportunities. This revolutionary indicator helps you in lowering your losing trades due to choppy market movements. The GVI is designed to measure market volatility, providing you with valuable insights to identify the most favorable trading prospects. Its intuitive interface consists of a dynamic red line representing the volatility index, accompanied by blue line that indicate
Introduction to the Manual Backtesting Indicator on MQL5 The MetaTrader platform provides an excellent backtesting tool for evaluating Expert Advisors (EAs). However, when it comes to manually backtesting a strategy to assess its effectiveness, this tool has some limitations: You cannot manually draw zones or trend lines while in backtesting mode. You cannot switch timeframes to check time alignment. For example, if my strategy requires additional confirmation from a higher timeframe (HTF), this
ONNYX INDICATOR — версия 1.14 Индикатор зон спроса и предложения для MetaTrader 5 без перерисовки подтвержденных сигналов. Он определяет подтвержденные ценовые экстремумы, строит зоны с шириной на основе ATR, оценивает качество зон в процентах и показывает стрелки BUY/SELL на закрытых свечах. ОСНОВНЫЕ ВОЗМОЖНОСТИ - Зоны спроса и предложения с процентной оценкой внутри зоны. - Увеличенные стрелки BUY/SELL после подтверждения закрытой свечи. - Фильтр тренда EMA и подтверждение отклонения цены. - П
Market Profile Advanced — TPO, VAH/VAL/POC, Value Area & Anchored VWAP Market Profile Advanced brings a full Market (Time Price Opportunity) Profile to any symbol and timeframe in MetaTrader 5 — Point of Control, Value Area High/Low, TPO letters or solid histogram blocks, single-print zones, poor highs/lows, an Initial Balance marker, and an independent Anchored VWAP — all rendered natively as chart objects, with no DLLs and no external dependencies. Core Market Profile Daily, weekly, monthly, q
Уникальный индикатор, реализующий профессиональный и количественный подход к торговле на возврате к среднему. Он использует тот факт, что цена отклоняется и возвращается к среднему предсказуемым и измеримым образом, что позволяет использовать четкие правила входа и выхода, которые значительно превосходят неколичественные торговые стратегии. [ Installation Guide | Update Guide | Troubleshooting | FAQ | All Products ] Четкие торговые сигналы Удивительно легко торговать Настраиваемые цвета и разме
Introducing the   Range Predictor : Your Ultimate Guide to Future Trading Ranges!   Imagine having the power to see into the future of market moves— Range Predictor   brings this dream to life. Designed to deliver real-time,   predictive support and resistance levels , this tool goes beyond standard indicators, offering trend direction insights and precise range   forecasts . Whether you're a day trader or a swing trader, the   Range Predictor   is your all-in-one toolkit for mastering the ma
# Индикатор Squeeze Momentum для MT5 Откройте для себя взрывные рыночные возможности с помощью мощного **индикатора Squeeze Momentum**, профессионально разработанного для MetaTrader 5. Этот продвинутый индикатор волатильности и импульса помогает трейдерам определять периоды низкой волатильности до того, как произойдут основные рыночные движения. Сочетая силу полос Боллинджера и каналов Келтнера, индикатор показывает, когда рынок «сжимается» и готовится к прорыву. Встроенная гистограмма импул
The  OBV MTF  is an Enterprise-grade On-Balance Volume indicator that transforms standard OBV into a complete trading system. It combines gradient-aware momentum analysis, divergence detection, multi-timeframe alignment, and dynamic customisable midpoint-filtering in a single intuitive professional volume analysis tool. Core Features 1. 5-State Momentum Engine Aqua (Strong Bullish) : OBV slope rising with positive acceleration SteelBlue (Weak Bullish) : OBV rising but losing momentum Gray (Neutr
Man Trend использует в своей основе процесс выявления скорости изменения роста цены и позволяет найти точки входа и выхода с рынка.  Индикатор был создан на основе оригинальных индикаторов поиска экстремумов, индикатор хорошо подходит для определения разворота или большого резкого рывка в одну из сторон благодаря ему вы будете знать когда такое произойдет он вас уведомит появлением точки синего цвета на покупку красного на продажу. Это фундаментальный технический индикатор, который позволяет
Brief Description: An assistant for analyzing market dynamics and volatility across timeframes (MT), featuring an automated position simulator based on the "R" (risk multiple) concept. Decision-Support Assistant (based on multi-timeframe ATR analysis) This tool is a professional, multi-timeframe (MTF) entry system designed to identify high-probability trend continuation (CONT) and trend reversal (RV) patterns. Key Strengths and Technical Structure A robust, three-layer "pinned" multi-timeframe
Демо-заметка: Break Out Explosion сейчас в режиме скидки на ограниченное время, следующая цена: 100$ Symbols: USDCHF, USDJPY, XAUUSD, GBPUSD, EURUSD, AUDUSD, GBPJPY ( Я люблю USDCHF_H1 ) Таймфреймы: M15, H1, H4, D1 Важные особенности: Без перерисовки, без задержек, направленные сигналы, множественные подтверждения Безопасность: Сигналы содержат стоп-лосс, тейк-профит и соблюдают правило риск–прибыль Включает: бесплатный мульти-таймфрейм сканер (После покупки продукта просто отправьте мне скринш
LuoMo Volume & Price Structure 8.98 A multi-function chart indicator for   MetaTrader 4 and MetaTrader 5 , designed to display key volume, volatility, sentiment, and price-structure information directly on the main chart. Main Features Volume and price-based Support & Resistance Volume spike and exhaustion signals ATR volatility expansion alerts Volume Profile with HVN and LVN Bullish and bearish sentiment distribution Developing or fixed POC VAH and VAL levels Supply and Demand zones Volume-wei
مؤشر Smart SR Structure Pro MT5 هو مؤشر تداول شامل مصمم لمساعدة المتداولين على تحليل بنية السوق ومناطق الدعم والمقاومة والاختراقات وسلوك السعر مباشرة على الرسم البياني. يقوم المؤشر تلقائيًا باكتشاف قنوات الدعم والمقاومة الرئيسية، ويعرض تسميات هيكل السوق مثل HH وHL وLH وLL، ويسلط الضوء على مستويات BOS وCHoCH لمساعدة المتداولين على تحديد مناطق استمرار الاتجاه أو انعكاسه المحتملة. كما يتضمن مؤقتًا احترافيًا للشموع، ومتوسطات متحركة اختيارية، وألوانًا قابلة للتخصيص، وعرض خطوط قابل للتعديل، وتسميات و
Gold Crazy EA   is an Expert Advisor designed specifically for trading Gold H1/ EU M15. It use some indicators to find the good Entry. And you can set SL or you can DCA if you want. It can be an Scalping or an Grid/ Martingale depend yours setting. This EA can Auto lot by Balance, set risk per trade. You also can set TP/ SL for earch trade or for basket of trade. - RSI_PERIOD - if = -1, then the default strategy works, if >0, then the RSI strategy works - MAX_ORDERS - to trade with only 1 order,
ROC acceleration-deceleration is the manual system for medium-term scalping. Indicator based on custom ROC system which defines bullish/bearish market and especially  acceleration-deceleration of tendention in the market's main direction. Buy arrow is plotted during bearish market when current trend decelerates and sell  arrow is plotted during bullish market when current trend decelerates. Main Indicator's Features Signals are not repaint,non-late or disappear(exept cases when system recalculat
TPO Profile MT5
Kyra Nickaline Watson-gordon
Definition : TPO is a Time Price Opportunity. Instead of using bars or candles with an Open, High, Low, and Close price, each "bar" in a Market Profile is represented by horizontal bars against the price It is called Market Profile terminology. In other words time-price-opportunity (TPO) profiles are histograms of how much time was spent at each price within the span of the profile. By using a TPO chart, you are able to analyze the amount of trading activity, based on time, for each price level
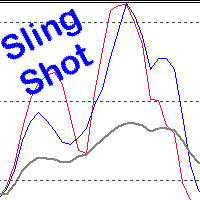
Scalping, Mean reversion or Position trading strategy Get into an established trend on a pullback in the market. Use the Pinch in the indicator for profit taking. Use the Pinch as a mean reversion strategy, scalping back to a moving average line.  Input Parameters Fast Sling Shot configuration. Slow Sling Shot configuration. Dual Sling Shot configuration. Price line configuration. Trigger zones or levels. Example of Sling Shot trade idea: Price line sets the mood, below the baseline level (50)
VFI Quantum
Nikita Berdnikov
5 (1)
Представляем VFI (Volume Flow Indicator) – индикатор для торговли, который анализирует соотношение объема и движения цены для выявления ключевых торговых возможностей. Индикатор отображает силу и направление потока объемов, предоставляя четкие сигналы о потенциальных точках входа и выхода. Сигналы формируются на основе пересечения нулевой линии, пересечения линии VFI и ее экспоненциальной скользящей средней (EMA), а также при выходе индикатора из зон перекупленности и перепроданности. Внимание!
FREE
TPSproTrend PRO   - это трендовый индикатор, который автоматически анализирует рынок и предоставляет информацию о тренде и его изменениях, а также отображает точки входа в сделки  без перерисовки!   Новая версия   Trend Lines PRO   — улучшенный алгоритм определения точек входа, дополнительная фильтрация сигналов и обновлённая визуализация. ИНСТРУКЦИЯ RUS   -   NSTRUCTIONS  ENG     -   VERSION MT4 Основные преимущества Сигналы без перерисовки.  Все сигналы фиксированные. Если стрелка появилась —
Caicai L&S Yield Histogram Important Notice: This indicator is an integral tool of the automated EA Caicai Long and Short Pair Trading . This indicator visually displays the percentage deviation (Yield %) of a pair's current spread relative to its own historical mean. It is an excellent tool for quickly visualizing the gross financial potential of a market distortion in Long & Short operations. Main Features: Percentage Visualization: Understand the size of the distortion in palpable percentage
How it works –   Base-departure detection — algorithmically finds consolidation bases (overlapping range with compressed volatility) followed by displacement departures. Patterns: Drop-Base-Rally, Rally-Base-Drop, Rally-Base-Rally, Drop-Base-Drop — detected structurally, not by candle names. –   Strength score (0–100) — from departure velocity, time-at-base, freshness (each revisit decays the score), higher-timeframe confluence and origin volume. –   Lifecycle — Fresh, Tested (decaying), Broken
FREE
С этим продуктом покупают
Entry Points Pro показывает, где входить, где ставить стоп и каким лотом торговать — до того, как вы поставите ордер. ЦЕНА Сейчас 199 USD: 8 копий по этой цене, затем 249 USD. Финальная цена — 349 USD. Я зарабатываю торговлей на рынке и показываю это, поэтому мне не нужно продавать этот индикатор всем подряд. Это инструмент для трейдеров, которые думают своей головой, а не волшебная кнопка. Нет пробоя — нет сделки. Серая стрелка — отменённый сигнал: цена не пробила сигнальную свечу, значит, н
Gann Made Easy   - это профессиональная, но при этом очень простая в применении Форекс система, основанная на лучших принципах торговли по методам господина У.Д. Ганна. Индикатор дает точные BUY/SELL сигналы, включающие в себя уровни Stop Loss и Take Profit. ПОЖАЛУЙСТА, СВЯЖИТЕСЬ СО МНОЙ ПОСЛЕ ПОКУПКИ, ЧТОБЫ ПОЛУЧИТЬ ТОРГОВЫЕ ИНСТРУКЦИИ И ОТЛИЧНЫЕ ДОПОЛНИТЕЛЬНЫЕ ИНДИКАТОРЫ БЕСПЛАТНО! Вероятно вы уже не раз слышали о торговли по методам Ганна. Как правило теория Ганна отпугивает от себя не только
ULTRA - это технический индикатор, который который работает по принципу “Все включено” - самостоятельно анализирует рынок, дает торговые сигналы, показывает уровни для установки стоп лосс, а также подсказывает когда нужно закрывать сделки, чтобы получить профит или минимизировать убыток. То есть, не важно, что ты не умеешь анализировать рынок, определять уровни - где поставить SL или плохо совладаешь с мани-менеджментом. ULTRA все это сделает вместо тебя! БОНУС ДЛЯ ПОКУПАТЕЛЯ : После покупки ULT
Boba Analysis Suite
Trade Ready Solutions LLC
5 (2)
Boba Analysis Suite Boba Analysis Suite — аналитический индикатор для MetaTrader 5. Он объединяет структуру рынка, значимые ценовые зоны и общий рыночный контекст в одном представлении на графике. Индикатор разработан на основе практического опыта трейдера и наставника по трейдингу. Он помогает выстроить последовательный процесс анализа: оценивать направление рынка, определять важные уровни и рассматривать несколько таймфреймов в совокупности. Анализ с учётом контекста Значение отдельных сигнало
M1 SNIPER   — это простая в использовании торговая система. Это стрелочный индикатор, разработанный для тайм фрейма M1. Индикатор можно использовать как отдельную систему для скальпинга на тайм фрейме M1, а также как часть вашей существующей торговой системы. Хотя эта торговая система была разработана специально для торговли на M1, ее можно использовать и с другими тайм фреймами. Первоначально я разработал этот метод для торговли XAUUSD и BTCUSD. Но я считаю этот метод полезным и для торговли на
Apex Patterns PRO Купите индикатор — получите Expert Advisor на его основе БЕСПЛАТНО. Самооптимизирующаяся система анализа графических паттернов и пробоев Традиционные сканеры паттернов полагаются на фиксированные входные параметры, что часто приводит к снижению их эффективности при изменении рыночной волатильности и структуры. Apex Patterns PRO разработан для адаптации к меняющимся рыночным условиям, объединяя распознавание структурных графических паттернов, фильтрацию по моментуму и статистич
Sqn Max Indicator Sqn Max is an exclusive indicator to trade the market with high effectiveness. The indicator is based on price action, volatility and trend. This indicator is as simple as possible but not too simple. The indicator can generate alerts to ease the trading process. You don't have to stay all day in front of your screen. The indicator can be used with any class of assets and with any time frame. It is possible to achieve better results trading our list of selected assets. We achi
Adaptive Price Action Engine Купи индикатор — получи советник (EA) к нему бесплатно Самооптимизирующийся мульти-таймфреймовый анализ тренда и свечных моделей Рынок постоянно меняется — и не каждая модель Price Action имеет одинаковую ценность в разных рыночных режимах. Adaptive Price Action Engine создан для адаптации к изменяющимся рыночным условиям, объединяя трендовую структуру, мульти-таймфреймовый анализ, свечные модели и статистическую оптимизацию в единой аналитической системе. Два адапти
Каждый покупатель этого индикатора получает дополнительно Бесплатно: Авторскую утилиту "Bomber Utility", которая автоматически сопровождает каждю торговую операцию, устанавливает уровни Стоп Лосс и Тейк профит и закрывает сделки согласно правилам этой стратегии, Сет-файлы для настройки этого индикатора на различных активах, Сет-файлы для настройки Bomber Utility в режимы: "Минимум Риска", "Взвешенный Риск" и "Стратегия Выжидания", Пошаговый видео-мануал, который поможет вам быстро установить, н
Currency Strength Wizard   — очень мощный индикатор, предоставляющий вам комплексное решение для успешной торговли. Индикатор рассчитывает силу той или иной форекс-пары, используя данные всех валют на нескольких тайм фреймах. Эти данные представлены в виде простых в использовании индексов валют и линий силы валют, которые вы можете использовать, чтобы увидеть силу той или иной валюты. Все, что вам нужно, это прикрепить индикатор к графику, на котором вы хотите торговать, и индикатор покажет вам
Auto Optimized SpeedAngle — это система векторизации импульса институционального уровня, которая исключает подгонку под исторические данные (curve-fitting) за счет непрерывной форвард-оптимизации (Walk-Forward Optimization, WFO). Вместо того чтобы полагаться на статические входные параметры, которые теряют эффективность при смене рыночных режимов, индикатор динамически перекалибрует свои настройки, используя валидацию на вневыборочных данных (Out-of-Sample, OOS). Это гарантирует, что отображаемы
Мультивалютный индикатор силы и импульса MT5 Dynamic Forex28 Navigator — развитие наших давно популярных индикаторов, объединяющее силу пяти в одном: Advanced Currency Strength28 Indicator (700 отзывов) Advanced Currency IMPULSE with ALERT (530 отзывов) Currency Strength EXOTICS GOLD Impulse with Alert CS28 Combo Signals (текущий бонус) Не нужно покупать четыре индикатора и ставить их на графики. Всё объединено в одном мощном индикаторе: сила 28 пар Forex, импульс рынка, который их ведёт, и опов
Azimuth Pro
Ottaviano De Cicco
5 (7)
Azimuth Pro V2: Синтетический фрактальный структурный анализ и подтверждённые входы для MT5 Обзор Azimuth Pro — многоуровневый индикатор свинговой структуры от Merkava Labs . Четыре вложенных уровня свингов, привязанный к свингам VWAP, определение ABC-паттернов, трёхтаймфреймная структурная фильтрация и подтверждённые входы на закрытой свече — один график, один рабочий процесс от микро-свингов до макро-циклов. Это не слепой сигнальный продукт. Это рабочий процесс, основанный на структуре, для т
ARICoin is a powerful trading companion designed to generate high-probability entry signals with dynamic TP/SL/DP levels based on volatility. Built-in performance tracking shows win/loss stats, PP1/PP2 hits, and success rates all updated live. Key Features: Buy/Sell signals with adaptive volatility bands Real-time TP/SL/DP levels based on ATR Built-in MA Filter with optional ATR/StdDev volatility Performance stats panel (Success, Profit/Loss, PP1/PP2) Alerts via popup, sound, push, or email Cust
Свинг-трейдинг - это первый индикатор, предназначенный для обнаружения колебаний в направлении тренда и возможных разворотов. Он использует базовый подход свинговой торговли, широко описанный в торговой литературе. Индикатор изучает несколько векторов цен и времени для отслеживания направления совокупного тренда и выявляет ситуации, когда рынок перепродан или перекуплен и готов к исправлению. [ Руководство по установке | Руководство по обновлению | Устранение неполадок | FAQ | Все продукты ] П
Neuro Poseidon - новый индикатор от Дарьи Резуевой. Он сочетает точные торговые сигналы с адаптивными уровнями TP/SL , в результате создавая максимально выгодные сделки! TO SWITCH TO   ENG   PLEASE CHOOSE IT IN THE UPPER-RIGHT CORNER OF THE WEBSITE Напишите мне и получите  Neuro Poseidon Assistant  в подарок для автоматизации вашей торговли! Что отличает его от других индикаторов? 1. Доказанная прибыльность на всех активах и таймфреймах 2. На графике присутствуют только подтвержденные сигналы н
SIO Oscillator: самооптимизирующийся осциллятор дисбаланса семивариаций Купите индикатор и получите советник (EA) на его основе БЕСПЛАТНО. Большинство осцилляторов воспринимают любое движение цены одинаково. SIO разделяет давление покупателей и продавцов и измеряет дисбаланс между ними, показывая, какая сторона действительно контролирует рынок. Когда дисбаланс достигает экстремума, SIO выдаёт чёткий сигнал с уровнями входа, Stop Loss и Take Profit. Главное отличие SIO в том, что он не полагается
Этот индикатор является уникальным, качественным и доступным инструментом для торговли, включающим в себя наши собственные разработки и новую формулу. В обновленной версии появилась возможность отображать зоны двух таймфреймов. Это означает, что вам будут доступны зоны не только на старшем ТФ, а сразу с двух таймфреймов - таймфрейма графика и старшего: отображение вложенных зон. Обновление обязательно понравится всем трейдерам, торгующим по зонам спроса и предложения. Важная информация Для макс
ScalpPoint is a powerful trading companion designed to generate high-probability entry signals with dynamic TP/SL/DP levels based on volatility. Built-in performance tracking shows win/loss stats, PP1/PP2 hits, and success rates — all updated live. Key Features: Buy/Sell signals with adaptive volatility bands Real-time TP/SL/DP levels based on ATR Built-in MA Filter with optional ATR/StdDev volatility Performance stats panel (Success, Profit/Loss, PP1/PP2) Alerts via popup, sound, push, or emai
Superhero
Ihor Otkydach
5 (3)
SUPERHERO индикатор - это мультивалютная торговая система, которая создана по принципу "Все включено". Индикатор самостоятельно анализирует рынок и дает сигналы когда открывать и когда закрывать сделки. Используются ордера Стоп Лосс и Тейк профит. Соотношение R:R = 1:1 Эта система может присылать на смартфон PUSH-уведомления, так что вы сможете делать сделки "на ходу" без привязки к ПК. Отлично подходит для Проп Фирм трейдинга. БОНУС ДЛЯ КАЖДОГО ПОКУПАТЕЛЯ: Каждый покупатель этого индикатора пол
Bill Williams Advanced предназначен для автоматического анализа графика по системе " Profitunity " Билла Уильямса. Индикатор анализирует сразу четыре таймфрейма. Инструкция/Мануал ( Обязательно читайте перед приобретением ) Преимущества 1. Анализирует график по системе "Profitunity" Билла Уильямса. Сигналы помещает в таблицу в углу экрана и на график цены. 2. Находит все известные сигналы АО и АС, а также сигналы зон. Оснащён трендовым фильтром по Аллигатору. 3. Находит "Дивергентный бар", а та
Naked Forex Kangaroo Tail Pro Indicator Kangaroo Tail Pro Indicator is a pattern recognition indicator for Forex, Stocks, Indices, Futures, Commodities and Cryptos. The Kangaroo Tail is a multi-bar pattern. The Kangaroo Tail pattern is very effective and is very simple to trade. The strategy that comes with the Kangaroo Tail is based on price action. The indicator does what it was designed for: displaying Kangaroo Tail patterns.     Don't expect to follow the up and down arrows and make mone
AriFocus - Non-Repainting Buy/Sell Signals AriFocus - one clear signal. AriFocus marks buy and sell signals directly on the chart and suggests a stop-loss level for each one. Every signal is confirmed on bar close and never repaints. - Buy/sell arrows, confirmed on bar close - Suggested stop-loss level for every signal - Trend band and candle coloring to show direction at a glance - 10 ready-made presets, or your own settings (14 calculation methods) - Pop-up, push and email alerts with entr
RSI Thunder MT5
Muhammad Abdulrahman Omar Naima Allah Al-rais
RSI Thunder — это мощный и интеллектуальный торговый индикатор, созданный для трейдеров, которые ценят точность и качество сигналов. Индикатор формирует сигналы только после закрытия свечи, полностью исключая перерисовку и ложные входы. Он объединяет RSI, EMA, ADX и ATR в одной логической системе, дополненной строгим фильтром направления тренда SMA40. RSI Thunder анализирует последние пять свечей и подтверждает сигнал только при наличии четкой рыночной структуры. Индикатор отображает наглядные
Boom Crash GainX PainX Spike Detector Overview Boom Crash GainX PainX Spike Detector is a professional analytical indicator for Deriv synthetic indices. It is designed to identify potential spike opportunities using multiple technical indicators, price movement analysis, and tick-based cycle monitoring. The indicator supports both market directions in one tool: Boom and GainX: BUY signals for potential upward spikes. Crash and PainX: SELL signals for potential downward spikes. The indicator auto
Volatility Master for MetaTrader is a real-time dashboard tool that scans up to  50 symbols  to identify high-volatility , trending markets instantly. With bullish/bearish signals, customizable alerts, and a user-friendly interface, it helps you avoid range-bound conditions and focus on high-probability trades. Clarity leads to confidence. Trade confidently and protect your capital effectively with this powerful dashboard. We don't offer free or bonus indicators in exchange of reviews from you.
Scalper Vault — это мощная, полноценная торговая система, созданная для трейдеров, которые стремятся к стабильным результатам в внутридневной торговле. Этот высокоточный индикатор представляет собой комплексное, самостоятельное торговое решение, обеспечивающее аналитику профессионального (институционального) уровня как для торговли на рынке Forex, так и для работы с бинарными опционами. Пожалуйста, свяжитесь со мной после покупки, чтобы получить мои торговые советы, а также отличный бонус! Исклю
FX Sniper Orange Indicator FX Sniper Orange is an exclusive indicator to spot situations where market has gone too far and market could reverse soon after. The indicator displays arrows in your chart indicating probable future price action (see screenshot attached). FX Sniper Orange never repaints. Once candle is closed signal is confirmed and arrow will never disappear. Users of the indicator can setup alerts when new arrows are displayed in the chart. Inputs of the indicator are: Distanc
ARIPoint
Temirlan Kdyrkhan
1 (4)
ARIBot is a powerful trading companion designed to generate high-probability entry signals with dynamic TP/SL/DP levels based on volatility. Built-in performance tracking shows win/loss stats, PP1/PP2 hits, and success rates — all updated live. Key Features: Buy/Sell signals with adaptive volatility bands Real-time TP/SL/DP levels based on ATR Built-in MA Filter with optional ATR/StdDev volatility Performance stats panel (Success, Profit/Loss, PP1/PP2) Alerts via popup, sound, push, or email Cus
SkyHammer Signal Pro Профессиональный трендовый индикатор без перерисовки с фиксированными уровнями Entry, SL и TP SkyHammer Signal Pro — это структурированный индикатор тренда и momentum, созданный для трейдеров, которым нужны четкие, зафиксированные и проверяемые торговые сигналы. Лучше всего он работает на младших таймфреймах, таких как M1 и M5 . Индикатор не пытается предсказывать вершины или основания рынка. Вместо этого он ожидает подтвержденную рыночную структуру, направление тренда, силу
Фильтр:
Нет отзывов
Ответ на отзыв