Volume Profile Sessions and Range Pro

See where the market really traded — not just where price went.

Most tools only show you price. This indicator shows you where the volume actually was — the exact levels where traders committed the most money, the zone that held most of the activity, and the spots that tend to trigger support, resistance, or fast, violent moves. It's the difference between guessing at a level and trading a level the market has already proven matters.

Drop it on any chart and instantly get clean, accurate volume profiles for sessions (Tokyo, London, New York), full days, full weeks, a rolling multi-day view, or any custom range you draw yourself.

Why traders reach for this one

  • See the real story, not the candle guess. Profiles are built from granular M1 data, not the timeframe you're looking at — so a single 1-hour candle can't smear its volume evenly across the whole bar and hand you a distorted level.
  • Never trade a blind level. POC, Value Area High/Low, and real peak-detected High/Low Volume Nodes are drawn automatically, using the same Value Area method used on professional platforms.
  • Get alerted the moment it matters. Set a POC touch alert and get a popup, a phone push, or a sound the second price comes back to a level worth watching — with a cooldown so you're not spammed.
  • Run it your way, live. Flip sessions, lines, and histograms on or off from an on-chart panel — no digging through settings mid-trade. Your layout is remembered across timeframes.
  • It won't lie to you when data is thin. If your broker doesn't provide real volume, it switches to tick volume automatically and tells you in the log — so you're never staring at a blank or misleading profile.

What you get

  • Session profiles — a separate volume profile for the Tokyo, London and New York sessions, each in its own dashed box.
  • Daily and Weekly profiles — one profile per day or per week, with start times you can set to match your broker's daily rollover.
  • Right-side multi-day profile — one combined profile of the last several trading days (you choose how many), pinned next to the price scale, with rows growing to the left. Stays put as you scroll and zoom, and can hide itself once you scroll back into history so it never gets in the way.
  • Manual profile on any range — tap two points on the chart and get a full profile for exactly that range. On desktop, drag the box to move it or drag a corner to resize it, and the profile rebuilds automatically.
  • POC, VAH and VAL lines — Point of Control, Value Area High and Value Area Low, using the standard Value Area method.
  • HVN and LVN lines — High and Low Volume Nodes found by real peak-and-valley detection, so small bin-to-bin noise never gets marked as a node.
  • Buy / sell colors — split each row into buy volume and sell volume, or keep it a clean single color.
  • POC touch alert — popup, phone push notification, and/or sound when price comes within your chosen distance of a POC.
  • On-chart control panel — switch sessions, lines and the histogram on or off, change how many days back to show, hide everything with one tap, and draw manual profiles — all without opening the settings window.

Built for accuracy

  • Built from lower-timeframe data (M1 by default), not the candles you happen to be viewing.
  • Up to 1000 price rows per profile for a fine, detailed histogram — or fewer for a chunkier look.
  • Automatic tick-volume fallback with a log notice, so you're never left with a blank or misleading profile.
  • Thin rows near the high and low of a profile stay visible even when you zoom out.

Good to know

  • Session hours are in your broker's server time and must be set for your broker — offsets vary between brokers.
  • Many forex and gold (CFD) brokers only provide tick volume, not real traded volume. The profile then runs on tick volume, still widely used to see where activity concentrated.
  • Volume profile is an analysis tool. It shows where trading happened; it does not predict the future and does not guarantee profit.

Full input parameters

Session hours (server time, 0–23)

  • Tokyo / London / New York start hour and end hour — when each session begins and ends. An end hour earlier than the start hour means the session passes midnight.
  • Daily start hour / end hour — the window of the Daily profile. Set both to the same hour for a full 24-hour day starting at that hour (e.g. 17 and 17 for a 17:00 rollover).
  • Weekly start day / start hour — when the Weekly profile begins (0 = Sunday … 6 = Saturday). The week runs for exactly 7 days from that moment.

Sessions to show

  • Show Tokyo / London / New York session, Show Daily profile, Show Weekly profile — choose which profiles are drawn, or switch them live from the control panel.

Accuracy

  • Data timeframe — the timeframe used to build the profile. Lower is more accurate (M1 by default) but needs more history.

Profile settings

  • Price rows per profile — how many price rows each profile has. More rows give a finer profile.
  • Gap between rows — space between rows as a percent of row height. 0 gives a solid "mountain" look.
  • Widest bar — width of the longest bar as a percent of the session width.
  • Minimum bar width — the smallest width, in pixels, any row can have, so low-volume rows stay visible. 0 turns it off.
  • Days to show / Weeks to show — how many days or weeks back to draw (also changeable on the control panel).
  • Value Area % — share of volume inside the Value Area. 70 is the usual setting.
  • Use real volume — on for real volume, off for tick volume. Falls back to tick volume automatically if the symbol has none.
  • Show volume profile bars / POC line / VAL line / VAH line — turn each element on or off.
  • Show today's forming session — include the session still in progress, so it updates live.
  • Line style — draw lines only inside the session box, or extend them to the right.
  • Show session name label / Show price labels on lines — text labels on or off.

High / Low Volume Nodes

  • Show HVN lines / Show LVN lines — turn node lines on or off.
  • HVN minimum strength / LVN minimum depth — how much a peak or valley must stand out, as a percent of max volume, to count as a node. Higher means fewer, stronger nodes.
  • Min gap between nodes — minimum distance between two nodes, as a percent of the price range.
  • Max HVN lines / Max LVN lines per session — the most node lines drawn for each profile.

POC touch alert

  • Enable POC touch alert — turn the alert on.
  • Choose POC lines by clicking them — click POC lines on the chart to pick exactly which ones to watch.
  • Which session's POC to watch — Tokyo, London, New York, Daily, Weekly, or all shown sessions.
  • Watch only the latest POC per session — on to watch just the newest POC of each session instead of every POC on the chart.
  • Touch distance (pips) — how close price must get to count as a touch. 0 means the exact price.
  • Minutes between repeat alerts — cooldown before the same level can alert again.
  • Popup alert / Push notification to phone / Play sound / Sound file — choose how you're alerted. Push needs your MetaQuotes ID set up in the terminal.

Colors

  • Bar colors (buy and sell), POC / VAL / VAH / HVN / LVN line colors, session, Daily and Weekly box colors, label color — set every color to match your chart theme.

Dashboard

  • Show control panel, Panel X / Y position, Panel corner — show or hide the on-chart panel and place it where you want.

Manual volume profile

  • Manual profile box color — color of manually drawn profiles.
  • Max manual profiles kept — how many manual profiles can exist at once. Drawing another removes the oldest.
  • Auto-scale bar width to box height, Bar width vs box height, Max bar width — keep manual profiles looking consistent after you change timeframe or zoom.

Right-side profile (multi-day)

  • Show right-side profile — turn the whole profile on or off.
  • Show profile bars / POC / VAL / VAH line — choose what it displays.
  • Trading days covered — how many real trading days it combines. Weekends and holidays are skipped.
  • Include today's forming session — count today as one of those days so it updates live.
  • Price rows — number of rows for this profile. 0 uses the main row setting.
  • Widest bar — width of the longest bar as a percent of the visible chart width.
  • Gap to price scale — space in pixels between the profile and the price scale.
  • Extend lines back to today's open — lets its POC / VAH / VAL lines run back to today's open.
  • Gap between rows, Single color, Bar color — control how the rows look.
  • Show outline box and label, Outline box color — optional frame and title.
  • Hide when scrolled off the live edge, Live-edge tolerance — hides the profile when you scroll back into history.

Feedback and support

Questions, ideas, or a feature you'd like to see? Send a message here on MQL5 or leave a comment on the product page — I read every one. If the indicator helps you, a review is very much appreciated.

Produtos recomendados
Ugenesys AI MT5
Odaine Ramon Mcmillan
uGenesys AI - 90% Accurate Daytrading Indicator Introducing the ultimate forex trading indicator system, uGenesys AI, powered by cutting-edge AI technology and advanced analytical techniques, including Time-Series Analysis and Genetic Algorithms. Our AI-powered trading system leverages the power of time-series analysis to identify trends and patterns in historical price data, allowing traders to make informed predictions about future market movements. By analyzing vast amounts of data, our syst
AURUM MID-QUANT PRO v5.60 Quantitative Excellence for Gold (XAU/USD) & Volatility Trading Gain a professional edge over institutional markets with AURUM MID-QUANT PRO , an advanced Price Action Pattern Detection and Breakout Engine designed exclusively for MetaTrader 5 . Built specifically to capture the unique volatility of Gold (XAU/USD) and other major financial instruments, this powerful indicator combines high-precision algorithmic pattern recognition with real-time dynamic accumulation z
Perfil de Volume Multimodo: Analise o volume do seu jeito, não do jeito do seu indicador. A maioria dos indicadores de Perfil de Volume limita os traders a intervalos de análise predefinidos. Mas o mercado não se move dentro de padrões fixos, então por que sua análise deveria? O Volume Profile Multi-Mode oferece total liberdade para você decidir onde, quando e como o volume será analisado. Seja para estudar a estrutura do mercado, traçar perfis de sessões de negociação, monitorar atividades em p
Wat Machine
Watson Dyton Mulenga
WAT MACHINE — Product Description DOES NOT REPAINT. EVER. WAT MACHINE is a precision signal indicator for MetaTrader 5 that identifies high-probability turning points in the market and plots clean buy and sell arrows directly on your chart — exactly where price is most likely to reverse. No guessing. No repainting. No chasing. The signal is confirmed and locked in. What you see is what was there. HOW TO USE IT When an arrow appears, you have two options: Direct entry — enter at market on the nex
Gioteen Volatility Index (GVI) - your ultimate solution to overcoming market unpredictability and maximizing trading opportunities. This revolutionary indicator helps you in lowering your losing trades due to choppy market movements. The GVI is designed to measure market volatility, providing you with valuable insights to identify the most favorable trading prospects. Its intuitive interface consists of a dynamic red line representing the volatility index, accompanied by blue line that indicate
X Sensors Pro é um indicador profissional de perfil de volume que visualiza a distribuição do volume de negociação através dos níveis de preço durante um período selecionado. O indicador identifica automaticamente os extremos locais (HH e LL), calcula o Ponto de Controle (POC) — o nível com volume máximo, e constrói níveis de suporte e resistência com base no intervalo identificado. Características Principais: Visualização do perfil de volume como histogramas coloridos Detecção automática do P
The Rocket Trend indicator is trending. The indicator draws two-color points connected by lines along the chart. This is a trend indicator, it is an algorithmic indicator. It is easy to work and understand when a blue circle appears, you need to buy, when a red one appears, sell. The indicator is used for scalping and pipsing, and has proven itself well. Rocket Trend is available for analyzing the direction of the trend for a specific period of time. Ideal for novice traders learning the laws o
Manyal trading system, CovEchoTrend Robot, focuses on reliability and flexibility. By employing statistical analysis methods to study the relationships between the base indicator and market patterns, the system enables a deeper understanding of market processes. Intelligent pattern analysis: The application of statistical data processing helps identify key trend reversal points more accurately, signaling significant market shifts. Informed decision-making is based on the intersection of indicato
RSI Cortex Ai
Michael Prescott Burney
RSI Cortex AI para MetaTrader 5 O RSI Cortex AI é um indicador de análise técnica para MetaTrader 5 que auxilia os traders na avaliação do momentum utilizando um sistema de classificação multifatorial. Ele foi projetado para fornecer informações estruturadas no gráfico que vão além de uma única leitura do RSI ou de limites fixos de sobrecompra/sobrevenda. Este indicador combina medição de momentum, classificação de direção, avaliação de confiabilidade, histórico de tendência adaptativo e ferrame
Pattern Recognition EA
Claudiu-georgian Zavera
Pattern Recognition EA - From Learn to Earn. The market repeats itself. This EA finds every past repeat of the current candle sequence - and lets history vote the direction. ONE SHAPE. EVERY REPEAT IN HISTORY VOTES. The last N candles on your signal timeframe form a shape. The EA scans the history you choose - a fixed number of bars or everything your broker provides - for the SAME shape, and checks what happened next, every single time. Only when enough repeats exist AND a clear majority of t
Introduction to the Manual Backtesting Indicator on MQL5 The MetaTrader platform provides an excellent backtesting tool for evaluating Expert Advisors (EAs). However, when it comes to manually backtesting a strategy to assess its effectiveness, this tool has some limitations: You cannot manually draw zones or trend lines while in backtesting mode. You cannot switch timeframes to check time alignment. For example, if my strategy requires additional confirmation from a higher timeframe (HTF), this
ONNYX INDICATOR versão 1.14 Indicador de oferta e demanda para MetaTrader 5 com sinais confirmados sem repaint. Detecta pivôs confirmados, ajusta a largura das zonas pelo ATR, exibe a qualidade em porcentagem e desenha setas BUY/SELL em candles fechados. PRINCIPAIS RECURSOS - Zonas de oferta e demanda com pontuação percentual dentro da zona. - Setas BUY/SELL ampliadas após o fechamento do candle. - Filtro de tendência por EMA e confirmação opcional de rejeição. - Painel de tendência, níveis e co
Market Profile Advanced — TPO, VAH/VAL/POC, Value Area & Anchored VWAP Market Profile Advanced brings a full Market (Time Price Opportunity) Profile to any symbol and timeframe in MetaTrader 5 — Point of Control, Value Area High/Low, TPO letters or solid histogram blocks, single-print zones, poor highs/lows, an Initial Balance marker, and an independent Anchored VWAP — all rendered natively as chart objects, with no DLLs and no external dependencies. Core Market Profile Daily, weekly, monthly, q
Indicador único que implementa uma abordagem profissional e quantitativa para significar negociação de reversão. Ele capitaliza o fato de que o preço desvia e retorna à média de maneira previsível e mensurável, o que permite regras claras de entrada e saída que superam amplamente as estratégias de negociação não quantitativas. [ Installation Guide | Update Guide | Troubleshooting | FAQ | All Products ] Sinais de negociação claros Incrivelmente fácil de negociar Cores e tamanhos personalizáveis
Introducing the   Range Predictor : Your Ultimate Guide to Future Trading Ranges!   Imagine having the power to see into the future of market moves— Range Predictor   brings this dream to life. Designed to deliver real-time,   predictive support and resistance levels , this tool goes beyond standard indicators, offering trend direction insights and precise range   forecasts . Whether you're a day trader or a swing trader, the   Range Predictor   is your all-in-one toolkit for mastering the ma
Indicador de Momentum Squeeze para MT5 Desbloqueie oportunidades de mercado explosivas com o poderoso **Indicador de Momentum Squeeze**, desenvolvido profissionalmente para o MetaTrader 5. Este indicador avançado de volatilidade e momentum ajuda os traders a identificar períodos de baixa volatilidade antes que ocorram grandes movimentos de mercado. Combinando a força das Bandas de Bollinger e dos Canais de Keltner, o indicador revela quando o mercado está a "comprimir" e a preparar-se para um
The  OBV MTF  is an Enterprise-grade On-Balance Volume indicator that transforms standard OBV into a complete trading system. It combines gradient-aware momentum analysis, divergence detection, multi-timeframe alignment, and dynamic customisable midpoint-filtering in a single intuitive professional volume analysis tool. Core Features 1. 5-State Momentum Engine Aqua (Strong Bullish) : OBV slope rising with positive acceleration SteelBlue (Weak Bullish) : OBV rising but losing momentum Gray (Neutr
Man Trend
Ivan Simonika
Man Trend uses at its core the process of identifying the rate of change in price growth and allows you to find entry and exit points from the market. The indicator was created on the basis of the original indicators for searching for extreme points, the indicator is well suited for determining a reversal or a large sharp jerk to one of the sides, thanks to it you will know when this happens, it will notify you with the appearance of a blue dot to buy red to sell. This is a fundamental techni
Indicador para determinar o plano e a tendência. Se o preço estiver abaixo de qualquer um dos dois histogramas e duas linhas (vermelha e azul), esta é uma zona de venda. Ao adquirir esta versão do indicador, versão MT4 para uma conta real e uma demo - como um presente (para receber, escreva-me uma mensagem privada)! Se o preço estiver acima de qualquer um dos dois histogramas e duas linhas (vermelha e azul), esta é uma zona de compra. Versão MT4: https://www.mql5.com/en/market/product/3793 Se
Nota de desenvolvimento: Break Out Explosion está em modo de desconto por tempo limitado, próximo preço: 69$ Símbolos: USDCHF, USDJPY, XAUUSD, GBPUSD, EURUSD, AUDUSD, GBPJPY ( Eu amo USDCHF_H1 ) Períodos de tempo: M15, H1, H4, D1 Principais características: Sem repintar, sem atraso, sinal direcional, múltiplas confirmações Segurança: Os sinais incluem stop loss, take profit e seguem a regra de risco e recompensa Inclui: Scanner de múltiplos timeframes gratuito (Após adquirir este produto, basta
TradeAQ
Guo Sheng Zhao
LuoMo Volume & Price Structure 8.98 A multi-function chart indicator for   MetaTrader 4 and MetaTrader 5 , designed to display key volume, volatility, sentiment, and price-structure information directly on the main chart. Main Features Volume and price-based Support & Resistance Volume spike and exhaustion signals ATR volatility expansion alerts Volume Profile with HVN and LVN Bullish and bearish sentiment distribution Developing or fixed POC VAH and VAL levels Supply and Demand zones Volume-wei
مؤشر Smart SR Structure Pro MT5 هو مؤشر تداول شامل مصمم لمساعدة المتداولين على تحليل بنية السوق ومناطق الدعم والمقاومة والاختراقات وسلوك السعر مباشرة على الرسم البياني. يقوم المؤشر تلقائيًا باكتشاف قنوات الدعم والمقاومة الرئيسية، ويعرض تسميات هيكل السوق مثل HH وHL وLH وLL، ويسلط الضوء على مستويات BOS وCHoCH لمساعدة المتداولين على تحديد مناطق استمرار الاتجاه أو انعكاسه المحتملة. كما يتضمن مؤقتًا احترافيًا للشموع، ومتوسطات متحركة اختيارية، وألوانًا قابلة للتخصيص، وعرض خطوط قابل للتعديل، وتسميات و
Gold Crazy EA MT5
Nguyen Nghiem Duy
Gold Crazy EA   is an Expert Advisor designed specifically for trading Gold H1/ EU M15. It use some indicators to find the good Entry. And you can set SL or you can DCA if you want. It can be an Scalping or an Grid/ Martingale depend yours setting. This EA can Auto lot by Balance, set risk per trade. You also can set TP/ SL for earch trade or for basket of trade. - RSI_PERIOD - if = -1, then the default strategy works, if >0, then the RSI strategy works - MAX_ORDERS - to trade with only 1 order,
GDS Renko Entry Helper - Free Renko Price Interaction Indicator for MetaTrader 5 GDS Renko Entry Helper is a free Renko price interaction indicator for MetaTrader 5. It helps traders highlight important areas where price reacts, slows down, returns to a zone or changes behavior around support and resistance. The tool is designed for manual Renko analysis. It does not generate buy or sell signals and does not tell the trader when to enter the market. Its purpose is to help focus attention on area
ROC acceleration-deceleration is the manual system for medium-term scalping. Indicator based on custom ROC system which defines bullish/bearish market and especially  acceleration-deceleration of tendention in the market's main direction. Buy arrow is plotted during bearish market when current trend decelerates and sell  arrow is plotted during bullish market when current trend decelerates. Main Indicator's Features Signals are not repaint,non-late or disappear(exept cases when system recalculat
TPO Profile MT5
Kyra Nickaline Watson-gordon
Definition : TPO is a Time Price Opportunity. Instead of using bars or candles with an Open, High, Low, and Close price, each "bar" in a Market Profile is represented by horizontal bars against the price It is called Market Profile terminology. In other words time-price-opportunity (TPO) profiles are histograms of how much time was spent at each price within the span of the profile. By using a TPO chart, you are able to analyze the amount of trading activity, based on time, for each price level
Meravith MT5
Ivan Stefanov
5 (3)
Ferramenta dos market makers. O Meravith irá: Analisar todos os timeframes e exibir a tendência atual em vigor. Destacar zonas de liquidez (equilíbrio de volume) onde o volume comprador e vendedor é igual. Mostrar todos os níveis de liquidez de diferentes timeframes diretamente no seu gráfico. Gerar e apresentar análise de mercado em formato de texto para sua referência. Calcular alvos, níveis de suporte e pontos de stop-loss com base na tendência atual. Calcular a relação risco/retorno das suas
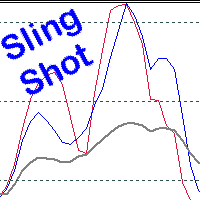
Scalping, Mean reversion or Position trading strategy Get into an established trend on a pullback in the market. Use the Pinch in the indicator for profit taking. Use the Pinch as a mean reversion strategy, scalping back to a moving average line.  Input Parameters Fast Sling Shot configuration. Slow Sling Shot configuration. Dual Sling Shot configuration. Price line configuration. Trigger zones or levels. Example of Sling Shot trade idea: Price line sets the mood, below the baseline level (50)
VFI Quantum
Nikita Berdnikov
5 (1)
Introducing VFI (Volume Flow Indicator) – a trading indicator that analyzes the relationship between volume and price movement to identify key trading opportunities. The indicator displays the strength and direction of volume flow, providing clear signals about potential entry and exit points. Signals are formed based on zero line crossovers, crossovers between the VFI line and its exponential moving average (EMA), and when the indicator exits overbought and oversold zones. Attention! This stra
FREE
Histograma de Rendimento L&S Caicai Aviso Importante: Este indicador é uma ferramenta integrante do robô automatizado EA Caicai Long and Short Pair Trading . Este indicador exibe visualmente o desvio percentual (Yield %) do spread atual de um par em relação à sua própria média histórica. É excelente para visualizar rapidamente o potencial financeiro bruto de uma distorção. Principais Funcionalidades: Visualização em Percentual: Entenda facilmente o tamanho da distorção em termos percentuais. Múl
Os compradores deste produto também adquirem
Trend Sniper X
Sarvarbek Abduvoxobov
4.9 (39)
Trend Sniper X é um indicador de acompanhamento de tendência para múltiplos tempos gráficos no MetaTrader 5 que ajuda os traders a identificar a direção da tendência e potenciais pontos de reversão com clareza e precisão. para MT4: https://www.mql5.com/en/market/product/193245 Informações sobre o preço: O preço atual é promocional e está sujeito a alterações à medida que novas atualizações e funcionalidades forem lançadas. Oferta Bônus: Para obter o Auto-Trade Assistant EA GRATUITO para este in
Neuro Poseidon MT5
Daria Rezueva
4.75 (52)
Neuro Poseidon is a new indicator by Daria Rezueva. It combines precise trading signals with adaptive TP/SL levels - creating best possible trades as a result! Message me and get  Neuro Poseidon Assistant  as a gift to automize your trading process! What makes it stand out? 1. Proven profitability on all assets and timeframes 2. Only confirmed BUY and SELL signals present on the chart 3. Adaptive TP & SL levels generated by the software for each trade 4. Easy to understand - suitable for al
M1 Sniper MT5
Oleg Rodin
5 (7)
O   M1 SNIPER   é um sistema indicador de negociação fácil de usar. É um indicador de seta projetado para o período M1. O indicador pode ser usado como um sistema independente para scalping no período M1 e pode ser usado como parte do seu sistema de negociação existente. Embora este sistema de negociação tenha sido projetado especificamente para negociação no M1, ele também pode ser usado em outros períodos. Originalmente, desenvolvi este método para negociar XAUUSD e BTCUSD. Mas considero-o úti
Gann Made Easy   é um sistema de negociação Forex profissional e fácil de usar, baseado nos melhores princípios de negociação usando a teoria do sr. W. D. Gann. O indicador fornece sinais precisos de COMPRA e VENDA, incluindo níveis de Stop Loss e Take Profit. Você pode negociar mesmo em movimento usando notificações PUSH. Entre em contato comigo após a compra para receber instruções de negociação e ótimos indicadores extras gratuitamente! Provavelmente você já ouviu muitas vezes sobre os método
A lenda está de volta: Entry Points Pro 10. O relançamento do lendário indicador que se manteve por 3 anos no Top-3 do MQL5 Market. Centenas de avaliações entusiasmadas (589 nas duas versões), milhares de traders operam com ele todos os dias, 31.000+ downloads da versão demo   MT4+MT5 . Li cada avaliação de vocês ao longo de cinco anos — e, em vez de promessas, coloquei as respostas dentro da versão 10. Do autor que está no mercado desde 1999 e valoriza a honestidade, a própria reputação e os se
Currency Strength Wizard   é um indicador muito poderoso que fornece uma solução completa para uma negociação bem-sucedida. O indicador calcula o poder deste ou daquele par forex usando os dados de todas as moedas em vários intervalos de tempo. Esses dados são representados em uma forma de índice de moeda fácil de usar e linhas de energia de moeda que você pode usar para ver o poder desta ou daquela moeda. Tudo o que você precisa é anexar o indicador ao gráfico que deseja negociar e o indicador
Adaptive Price Action Engine Compre um indicador, ganhe o EA de graça Análise Auto-Otimizada de Tendências e Padrões de Candlestick em Múltiplos Timeframes Os mercados estão em constante mudança, e nem todos os padrões de Price Action têm o mesmo valor em todas as condições de mercado. O Adaptive Price Action Engine foi desenvolvido para se adaptar às mudanças nas condições do mercado, combinando estrutura de tendência, análise Multi-Timeframe, padrões de candlestick e otimização estatística em
Divergence Bomber
Ihor Otkydach
4.89 (94)
Cada comprador deste indicador recebe adicionalmente, e de forma gratuita: A ferramenta exclusiva "Bomber Utility", que acompanha automaticamente cada operação, define os níveis de Stop Loss e Take Profit e fecha operações de acordo com as regras da estratégia; Arquivos de configuração (set files) para ajustar o indicador em diferentes ativos; Set files para configurar o Bomber Utility nos modos: "Risco Mínimo", "Risco Balanceado" e "Estratégia de Espera"; Um vídeo tutorial passo a passo que a
Auto Optimized SpeedAngle é um sistema de vetorização de momentum de nível institucional que elimina o sobreajuste ( curve-fitting ) por meio da otimização contínua de avanço ( Walk-Forward Optimization , WFO). Em vez de depender de entradas estáticas que se degradam quando os regimes de mercado mudam, o indicador recalibra dinamicamente seus parâmetros utilizando validação fora de amostra ( Out-of-Sample , OOS), garantindo que os sinais exibidos representem vantagens estatísticas genuínas e não
Volatility Master for MetaTrader is a real-time dashboard tool that scans up to  50 symbols  to identify high-volatility , trending markets instantly. With bullish/bearish signals, customizable alerts, and a user-friendly interface, it helps you avoid range-bound conditions and focus on high-probability trades. Clarity leads to confidence. Trade confidently and protect your capital effectively with this powerful dashboard. We don't offer free or bonus indicators in exchange of reviews from you.
PZ Trend Trading MT5
PZ TRADING SLU
3.8 (5)
O Trend Trading é um indicador projetado para lucrar o máximo possível com as tendências que ocorrem no mercado, cronometrando retrocessos e rupturas. Ele encontra oportunidades de negociação analisando o que o preço está fazendo durante as tendências estabelecidas. [ Guia de instalação | Guia de atualização | Solução de problemas | FAQ | Todos os produtos ] Negocie mercados financeiros com confiança e eficiência Lucre com as tendências estabelecidas sem ser chicoteado Reconhecer retrocessos
IQ FX Gann Levels a precision trading indicator based on W.D. Gann’s square root methods . It plots real-time, non-repainting support and resistance levels to help traders confidently spot intraday and scalping opportunities with high accuracy. William Delbert Gann (W.D. Gann) was an exceptional market analyst, whose trading technique was based on a complex blend of mathematics, geometry, astrology, and ancient mathematics which proved to be extremely accurate. We don't offer free or bonus indic
RelicusRoad Pro MT5
Relicus LLC
4.96 (24)
RelicusRoad Pro: Sistema Operacional Quantitativo de Mercado 70% DE DESCONTO ACESSO VITALÍCIO (TEMPO LIMITADO) - JUNTE-SE A 2.000+ TRADERS Por que a maioria dos traders falha mesmo com indicadores "perfeitos"? Porque eles operam Conceitos Únicos no vácuo. Um sinal sem contexto é uma aposta. Você precisa de CONFLUÊNCIA . RelicusRoad Pro não é um simples indicador de seta. É um Ecossistema Quantitativo de Mercado completo. Ele mapeia a "Estrada do Valor Justo", distinguindo ruído de rupturas estru
Difícil de encontrar e com pouca frequência, as divergências são um dos cenários de negociação mais confiáveis. Este indicador localiza e verifica automaticamente divergências ocultas e regulares usando seu oscilador favorito. [ Guia de instalação | Guia de atualização | Solução de problemas | FAQ | Todos os produtos ] Fácil de trocar Encontra divergências regulares e ocultas Suporta muitos osciladores conhecidos Implementa sinais de negociação baseados em fugas Exibe níveis adequados de sto
First time on MetaTrader, introducing IQ Star Lines - an original Vedic Astrology based indicator. "Millionaires don't use astrology, billionaires do" . - J.P. Morgan, Legendary American financier and banker. We don't offer free or bonus indicators in exchange of reviews from you. You won't need any free products with this indicator to make it work. ;) Enjoy! Welcome to  the new and updated  IQ Star Lines , the ultimate fusion of ancient planetary harmonic cycles and modern quantitative trading.
O UZFX {SSS} Scalping Smart Signals v5.0 MT5 é um indicador de negociação de alto desempenho, sem repintura, concebido para scalpers, day traders e swing traders que exigem sinais precisos e em tempo real em mercados em rápida evolução. Desenvolvido pela (UZFX-LABS), este indicador combina a análise da ação do preço, a confirmação de tendências e a filtragem inteligente para gerar sinais de compra e venda de alta probabilidade, sinais de alerta e oportunidades de continuação de tendências em tod
Gartley Hunter Multi
Siarhei Vashchylka
5 (12)
Gartley Hunter Multi - An indicator for searching for harmonic patterns simultaneously on dozens of trading instruments and on all possible timeframes. Manual (Be sure to read before purchasing) | Version for MT4 Advantages 1. Patterns: Gartley, Butterfly, Shark, Crab. Bat, Alternate Bat, Deep Crab, Cypher 2. Simultaneous search for patterns on dozens of trading instruments and on all possible timeframes 3. Search for patterns of all possible sizes. From the smallest to the largest 4. All fou
SkyHammer Signal Pro Indicador profissional de sinais de tendência sem repaint, com níveis Entry, SL e TP bloqueados SkyHammer Signal Pro é um indicador estruturado de tendência e momentum, desenvolvido para traders que procuram sinais claros, fixos e verificáveis. Funciona melhor em timeframes baixos, como M1 e M5 . O indicador não tenta prever topos ou fundos do mercado. Em vez disso, ele aguarda estrutura de mercado confirmada, direção de tendência, força de momentum, volatilidade saudável e
M1 Quantum MT5
Hamed Dehgani
4.2 (10)
Sinais de Trading ao Vivo usando o M1 Quantum: Sinal   (Operação executada automaticamente pelo Quantum Trade Assistant , incluído gratuitamente neste produto.) Últimas Notícias : A versão 1.64 foi lançada. Agora, todas as operações têm um Stop Loss colocado atrás das zonas relevantes de Suporte/Resistência. A função Smart Close também foi aprimorada para aumentar o desempenho do EA nesta versão. Desde 9 de agosto, o sinal ao vivo está sendo executado na versão 1.64. Plano de Preços: Preço Atua
Superhero
Ihor Otkydach
5 (3)
O indicador SUPERHERO é um sistema de negociação multimoeda concebido numa base «tudo incluído». O indicador analisa o mercado de forma independente e fornece sinais sobre quando abrir e encerrar posições. Utiliza ordens Stop Loss e Take Profit. O rácio R:R é de 1:1. Este sistema pode enviar notificações push para o seu smartphone, para que possa realizar transações «em qualquer lugar», sem precisar de estar preso a um computador. É perfeito para empresas de negociação por conta própria. UM BÓNU
Scalper Vault   é um sistema profissional de escalpelamento que fornece tudo o que você precisa para um escalpelamento bem-sucedido. Este indicador é um sistema de negociação completo que pode ser usado por comerciantes de forex e opções binárias. O período de tempo recomendado é M5. O sistema fornece sinais de seta precisos na direção da tendência. Ele também fornece sinais superiores e inferiores e níveis de mercado Gann. Os indicadores fornecem todos os tipos de alertas, incluindo notificaçõe
Shock Pullback
Suleiman Alhawamdah
5 (1)
De forma simples, você pode começar a operar quando o movimento dos números brancos — conhecidos como "pips" — começar a aparecer ao lado do candle atual. Os "pips" brancos indicam que uma operação de compra ou venda está ativa e se movendo na direção correta, conforme indicado pela cor branca. Quando o movimento dos pips brancos para e se transforma em uma cor verde estática, isso sinaliza o fim do momento atual. A cor verde dos números representa o lucro total obtido em "pips", independenteme
Volume Profile Multiple — Perfis de Volume Múltiplos com Buffers para Trading Algorítmico Cansado de desenhar o Volume Profile bloco por bloco, tendo que redesenhar e recalcular tudo sempre que muda de timeframe? O Volume Profile Multiple desenha automaticamente vários perfis de volume consecutivos no gráfico, revelando onde o interesse institucional realmente esteve em cada trecho do mercado — e não apenas no último intervalo visível. O que o indicador faz por você O indicador divide o históric
Presenting one-of-a-kind Gann Indicator for XAUUSD IQ Gold Gann Levels is a non-repainting, precision tool designed exclusively for XAUUSD intraday trading. It uses W.D. Gann’s square root method to plot real-time support and resistance levels, helping traders spot high-probability entries with confidence and clarity. William Delbert Gann (W.D. Gann) was an exceptional market analyst whose trading technique was based on a complex blend of mathematics, geometry, astrology, and ancient calculation
Gem SIGNAL
Shengzu Zhong
5 (1)
GEM Signal Pro GEM Signal Pro é um indicador seguidor de tendência para MetaTrader 5, desenvolvido para traders que desejam sinais mais claros, setups mais estruturados e uma gestão de risco mais prática diretamente no gráfico. Em vez de mostrar apenas uma seta simples, o GEM Signal Pro ajuda a apresentar a ideia completa da operação de forma mais clara e fácil de entender. Quando as condições são confirmadas, o indicador pode mostrar o preço de entrada, o stop loss e os alvos de take profit no
Azimuth Pro
Ottaviano De Cicco
5 (7)
Azimuth Pro V2: Estrutura Fractal Sintética e Entradas Confirmadas para MT5 Visão geral Azimuth Pro é um indicador de estrutura swing multinível da Merkava Labs . Quatro camadas de swing aninhadas, VWAP ancorado em swings, detecção de padrões ABC, filtragem estrutural de três timeframes e entradas confirmadas em barra fechada — um gráfico, um fluxo de trabalho dos micro-swings aos macro-ciclos. Este não é um produto de sinais cegos. É um fluxo de trabalho baseado em estrutura para traders que v
Btmm state engine pro
Garry James Goodchild
5 (4)
BTMM State Engine Pro by G-Labs — Beat The Market Maker indicator for MetaTrader 5. Asian session range, London and New York kill zones, level progression (L1/L2/L3), peak formation detection (PFH/PFL), entry signals, and a multi-pair scanner from one chart. Stop scanning charts one pair at a time. The State Engine tracks the BTMM daily cycle automatically — Asian box, room boundaries, level blocks, peak formations, and filtered entries — while the scanner dashboard shows level, peak status, d
O   SR Liquidity   é um indicador de trading projetado para revelar as zonas ocultas onde a liquidez do mercado se concentra e o preço reage com maior intensidade. Essas áreas específicas de liquidez funcionam como níveis poderosos de suporte e resistência, oferecendo um mapa claro de onde é mais provável que o mercado reverta. Em vez de traçar linhas comuns de Suporte e Resistência, o SR Liquidity analisa o comportamento real dos preços para detectar as zonas onde se acumulam pressões de compra
Advanced Supply Demand MT5
Bernhard Schweigert
4.53 (15)
Atualmente com 33% de desconto! A melhor solução para qualquer Trader Novato ou especialista! Este indicador é uma ferramenta de negociação exclusiva, de alta qualidade e acessível porque incorporamos uma série de recursos proprietários e uma nova fórmula. Com esta atualização, você poderá mostrar fusos horários duplos. Você não só será capaz de mostrar um TF mais alto, mas também mostrar ambos, o TF do gráfico, MAIS o TF mais alto: MOSTRANDO ZONAS ANINHADAS. Todos os traders de Oferta e Demanda
The Louis SMC & Liquidity Master is a complete, institutional-grade market structure and liquidity mapping system built for MetaTrader 5. Designed for serious Smart Money Concepts (SMC) traders, this tool dynamically tracks multi-timeframe trends, supply and demand zones, and critical liquidity sweeps without cluttering your chart. Whether you trade major Forex currency pairs or highly volatile synthetic indices like Boom and Crash, the indicator automatically adapts to price action, filtering
Filtro:
Sem comentários
Responder ao comentário