Volume Profile Sessions and Range Pro

See where the market really traded — not just where price went.

Most tools only show you price. This indicator shows you where the volume actually was — the exact levels where traders committed the most money, the zone that held most of the activity, and the spots that tend to trigger support, resistance, or fast, violent moves. It's the difference between guessing at a level and trading a level the market has already proven matters.

Drop it on any chart and instantly get clean, accurate volume profiles for sessions (Tokyo, London, New York), full days, full weeks, a rolling multi-day view, or any custom range you draw yourself.

Why traders reach for this one

  • See the real story, not the candle guess. Profiles are built from granular M1 data, not the timeframe you're looking at — so a single 1-hour candle can't smear its volume evenly across the whole bar and hand you a distorted level.
  • Never trade a blind level. POC, Value Area High/Low, and real peak-detected High/Low Volume Nodes are drawn automatically, using the same Value Area method used on professional platforms.
  • Get alerted the moment it matters. Set a POC touch alert and get a popup, a phone push, or a sound the second price comes back to a level worth watching — with a cooldown so you're not spammed.
  • Run it your way, live. Flip sessions, lines, and histograms on or off from an on-chart panel — no digging through settings mid-trade. Your layout is remembered across timeframes.
  • It won't lie to you when data is thin. If your broker doesn't provide real volume, it switches to tick volume automatically and tells you in the log — so you're never staring at a blank or misleading profile.

What you get

  • Session profiles — a separate volume profile for the Tokyo, London and New York sessions, each in its own dashed box.
  • Daily and Weekly profiles — one profile per day or per week, with start times you can set to match your broker's daily rollover.
  • Right-side multi-day profile — one combined profile of the last several trading days (you choose how many), pinned next to the price scale, with rows growing to the left. Stays put as you scroll and zoom, and can hide itself once you scroll back into history so it never gets in the way.
  • Manual profile on any range — tap two points on the chart and get a full profile for exactly that range. On desktop, drag the box to move it or drag a corner to resize it, and the profile rebuilds automatically.
  • POC, VAH and VAL lines — Point of Control, Value Area High and Value Area Low, using the standard Value Area method.
  • HVN and LVN lines — High and Low Volume Nodes found by real peak-and-valley detection, so small bin-to-bin noise never gets marked as a node.
  • Buy / sell colors — split each row into buy volume and sell volume, or keep it a clean single color.
  • POC touch alert — popup, phone push notification, and/or sound when price comes within your chosen distance of a POC.
  • On-chart control panel — switch sessions, lines and the histogram on or off, change how many days back to show, hide everything with one tap, and draw manual profiles — all without opening the settings window.

Built for accuracy

  • Built from lower-timeframe data (M1 by default), not the candles you happen to be viewing.
  • Up to 1000 price rows per profile for a fine, detailed histogram — or fewer for a chunkier look.
  • Automatic tick-volume fallback with a log notice, so you're never left with a blank or misleading profile.
  • Thin rows near the high and low of a profile stay visible even when you zoom out.

Good to know

  • Session hours are in your broker's server time and must be set for your broker — offsets vary between brokers.
  • Many forex and gold (CFD) brokers only provide tick volume, not real traded volume. The profile then runs on tick volume, still widely used to see where activity concentrated.
  • Volume profile is an analysis tool. It shows where trading happened; it does not predict the future and does not guarantee profit.

Full input parameters

Session hours (server time, 0–23)

  • Tokyo / London / New York start hour and end hour — when each session begins and ends. An end hour earlier than the start hour means the session passes midnight.
  • Daily start hour / end hour — the window of the Daily profile. Set both to the same hour for a full 24-hour day starting at that hour (e.g. 17 and 17 for a 17:00 rollover).
  • Weekly start day / start hour — when the Weekly profile begins (0 = Sunday … 6 = Saturday). The week runs for exactly 7 days from that moment.

Sessions to show

  • Show Tokyo / London / New York session, Show Daily profile, Show Weekly profile — choose which profiles are drawn, or switch them live from the control panel.

Accuracy

  • Data timeframe — the timeframe used to build the profile. Lower is more accurate (M1 by default) but needs more history.

Profile settings

  • Price rows per profile — how many price rows each profile has. More rows give a finer profile.
  • Gap between rows — space between rows as a percent of row height. 0 gives a solid "mountain" look.
  • Widest bar — width of the longest bar as a percent of the session width.
  • Minimum bar width — the smallest width, in pixels, any row can have, so low-volume rows stay visible. 0 turns it off.
  • Days to show / Weeks to show — how many days or weeks back to draw (also changeable on the control panel).
  • Value Area % — share of volume inside the Value Area. 70 is the usual setting.
  • Use real volume — on for real volume, off for tick volume. Falls back to tick volume automatically if the symbol has none.
  • Show volume profile bars / POC line / VAL line / VAH line — turn each element on or off.
  • Show today's forming session — include the session still in progress, so it updates live.
  • Line style — draw lines only inside the session box, or extend them to the right.
  • Show session name label / Show price labels on lines — text labels on or off.

High / Low Volume Nodes

  • Show HVN lines / Show LVN lines — turn node lines on or off.
  • HVN minimum strength / LVN minimum depth — how much a peak or valley must stand out, as a percent of max volume, to count as a node. Higher means fewer, stronger nodes.
  • Min gap between nodes — minimum distance between two nodes, as a percent of the price range.
  • Max HVN lines / Max LVN lines per session — the most node lines drawn for each profile.

POC touch alert

  • Enable POC touch alert — turn the alert on.
  • Choose POC lines by clicking them — click POC lines on the chart to pick exactly which ones to watch.
  • Which session's POC to watch — Tokyo, London, New York, Daily, Weekly, or all shown sessions.
  • Watch only the latest POC per session — on to watch just the newest POC of each session instead of every POC on the chart.
  • Touch distance (pips) — how close price must get to count as a touch. 0 means the exact price.
  • Minutes between repeat alerts — cooldown before the same level can alert again.
  • Popup alert / Push notification to phone / Play sound / Sound file — choose how you're alerted. Push needs your MetaQuotes ID set up in the terminal.

Colors

  • Bar colors (buy and sell), POC / VAL / VAH / HVN / LVN line colors, session, Daily and Weekly box colors, label color — set every color to match your chart theme.

Dashboard

  • Show control panel, Panel X / Y position, Panel corner — show or hide the on-chart panel and place it where you want.

Manual volume profile

  • Manual profile box color — color of manually drawn profiles.
  • Max manual profiles kept — how many manual profiles can exist at once. Drawing another removes the oldest.
  • Auto-scale bar width to box height, Bar width vs box height, Max bar width — keep manual profiles looking consistent after you change timeframe or zoom.

Right-side profile (multi-day)

  • Show right-side profile — turn the whole profile on or off.
  • Show profile bars / POC / VAL / VAH line — choose what it displays.
  • Trading days covered — how many real trading days it combines. Weekends and holidays are skipped.
  • Include today's forming session — count today as one of those days so it updates live.
  • Price rows — number of rows for this profile. 0 uses the main row setting.
  • Widest bar — width of the longest bar as a percent of the visible chart width.
  • Gap to price scale — space in pixels between the profile and the price scale.
  • Extend lines back to today's open — lets its POC / VAH / VAL lines run back to today's open.
  • Gap between rows, Single color, Bar color — control how the rows look.
  • Show outline box and label, Outline box color — optional frame and title.
  • Hide when scrolled off the live edge, Live-edge tolerance — hides the profile when you scroll back into history.

Feedback and support

Questions, ideas, or a feature you'd like to see? Send a message here on MQL5 or leave a comment on the product page — I read every one. If the indicator helps you, a review is very much appreciated.

Prodotti consigliati
Ugenesys AI MT5
Odaine Ramon Mcmillan
uGenesys AI - 90% Accurate Daytrading Indicator Introducing the ultimate forex trading indicator system, uGenesys AI, powered by cutting-edge AI technology and advanced analytical techniques, including Time-Series Analysis and Genetic Algorithms. Our AI-powered trading system leverages the power of time-series analysis to identify trends and patterns in historical price data, allowing traders to make informed predictions about future market movements. By analyzing vast amounts of data, our syst
Aurum mid quant pro
N'da Lemissa Kouame
AURUM MID-QUANT PRO v5.60 Quantitative Excellence for Gold (XAU/USD) & Volatility Trading Gain a professional edge over institutional markets with AURUM MID-QUANT PRO , an advanced Price Action Pattern Detection and Breakout Engine designed exclusively for MetaTrader 5 . Built specifically to capture the unique volatility of Gold (XAU/USD) and other major financial instruments, this powerful indicator combines high-precision algorithmic pattern recognition with real-time dynamic accumulation z
Profilo di volume multimodale: analizza il volume a modo tuo, non a modo del tuo indicatore. La maggior parte degli indicatori Volume Profile limita i trader a intervalli di analisi predefiniti. Ma il mercato non si muove all'interno di schemi fissi, quindi perché dovrebbe farlo la tua analisi? Volume Profile Multi-Mode ti offre la massima libertà di decidere dove, quando e come analizzare i volumi. Che tu stia studiando la struttura del mercato, profilando le sessioni di trading, monitorando l'
Wat Machine
Watson Dyton Mulenga
WAT MACHINE — Product Description DOES NOT REPAINT. EVER. WAT MACHINE is a precision signal indicator for MetaTrader 5 that identifies high-probability turning points in the market and plots clean buy and sell arrows directly on your chart — exactly where price is most likely to reverse. No guessing. No repainting. No chasing. The signal is confirmed and locked in. What you see is what was there. HOW TO USE IT When an arrow appears, you have two options: Direct entry — enter at market on the nex
Gioteen Volatility Index (GVI) - your ultimate solution to overcoming market unpredictability and maximizing trading opportunities. This revolutionary indicator helps you in lowering your losing trades due to choppy market movements. The GVI is designed to measure market volatility, providing you with valuable insights to identify the most favorable trading prospects. Its intuitive interface consists of a dynamic red line representing the volatility index, accompanied by blue line that indicate
X Sensors Pro è un indicatore professionale di profilo di volume che visualizza la distribuzione del volume di trading attraverso i livelli di prezzo durante un periodo selezionato. L'indicatore identifica automaticamente gli estremi locali (HH e LL), calcola il Punto di Controllo (POC) — il livello con volume massimo, e costruisce livelli di supporto e resistenza basati sull'intervallo identificato. Caratteristiche principali: Visualizzazione del profilo di volume come istogrammi colorati Ril
Rocket Trend
Andriy Sydoruk
The Rocket Trend indicator is trending. The indicator draws two-color points connected by lines along the chart. This is a trend indicator, it is an algorithmic indicator. It is easy to work and understand when a blue circle appears, you need to buy, when a red one appears, sell. The indicator is used for scalping and pipsing, and has proven itself well. Rocket Trend is available for analyzing the direction of the trend for a specific period of time. Ideal for novice traders learning the laws o
Manyal trading system, CovEchoTrend Robot, focuses on reliability and flexibility. By employing statistical analysis methods to study the relationships between the base indicator and market patterns, the system enables a deeper understanding of market processes. Intelligent pattern analysis: The application of statistical data processing helps identify key trend reversal points more accurately, signaling significant market shifts. Informed decision-making is based on the intersection of indicato
RSI Cortex Ai
Michael Prescott Burney
RSI Cortex AI per MetaTrader 5 RSI Cortex AI è un indicatore di analisi tecnica per MetaTrader 5 che utilizza un sistema di classificazione multifattoriale per aiutare i trader a valutare le dinamiche dell'attività di trading. Questo indicatore fornisce informazioni strutturate al grafico, andando oltre un semplice valore RSI o livelli di ipercomprato/ipervenduto predefiniti. Questo indicatore integra in un pannello di controllo grafico la misurazione del momentum, la classificazione della direz
Pattern Recognition EA
Claudiu-georgian Zavera
Pattern Recognition EA - From Learn to Earn. The market repeats itself. This EA finds every past repeat of the current candle sequence - and lets history vote the direction. ONE SHAPE. EVERY REPEAT IN HISTORY VOTES. The last N candles on your signal timeframe form a shape. The EA scans the history you choose - a fixed number of bars or everything your broker provides - for the SAME shape, and checks what happened next, every single time. Only when enough repeats exist AND a clear majority of t
Introduction to the Manual Backtesting Indicator on MQL5 The MetaTrader platform provides an excellent backtesting tool for evaluating Expert Advisors (EAs). However, when it comes to manually backtesting a strategy to assess its effectiveness, this tool has some limitations: You cannot manually draw zones or trend lines while in backtesting mode. You cannot switch timeframes to check time alignment. For example, if my strategy requires additional confirmation from a higher timeframe (HTF), this
ONNYX INDICATOR versione 1.14 Indicatore di domanda e offerta per MetaTrader 5 con segnali confermati senza repaint. Rileva swing confermati, adatta l'ampiezza delle zone tramite ATR, mostra la qualità in percentuale e disegna frecce BUY/SELL su candele chiuse. FUNZIONI PRINCIPALI - Zone di domanda e offerta con punteggio percentuale all'interno della zona. - Frecce BUY/SELL ingrandite dopo la chiusura della candela. - Filtro trend EMA e conferma opzionale del rifiuto. - Pannello con trend, live
Market Profile Advanced — TPO, VAH/VAL/POC, Value Area & Anchored VWAP Market Profile Advanced brings a full Market (Time Price Opportunity) Profile to any symbol and timeframe in MetaTrader 5 — Point of Control, Value Area High/Low, TPO letters or solid histogram blocks, single-print zones, poor highs/lows, an Initial Balance marker, and an independent Anchored VWAP — all rendered natively as chart objects, with no DLLs and no external dependencies. Core Market Profile Daily, weekly, monthly, q
PZ Mean Reversion MT5
PZ TRADING SLU
1 (1)
Indicatore unico che implementa un approccio professionale e quantitativo al trading di reversione. Sfrutta il fatto che il prezzo devia e ritorna alla media in modo prevedibile e misurabile, il che consente regole di entrata e uscita chiare che superano di gran lunga le strategie di trading non quantitative. [ Installation Guide | Update Guide | Troubleshooting | FAQ | All Products ] Segnali di trading chiari Incredibilmente facile da scambiare Colori e dimensioni personalizzabili Implementa l
Introducing the   Range Predictor : Your Ultimate Guide to Future Trading Ranges!   Imagine having the power to see into the future of market moves— Range Predictor   brings this dream to life. Designed to deliver real-time,   predictive support and resistance levels , this tool goes beyond standard indicators, offering trend direction insights and precise range   forecasts . Whether you're a day trader or a swing trader, the   Range Predictor   is your all-in-one toolkit for mastering the ma
# Indicatore Squeeze Momentum per MT5 Sfrutta le straordinarie opportunità di mercato con il potente **Indicatore Squeeze Momentum**, sviluppato professionalmente per MetaTrader 5. Questo indicatore avanzato di volatilità e momentum aiuta i trader a identificare i periodi di bassa volatilità prima che si verifichino importanti movimenti di mercato. Combinando la potenza delle Bande di Bollinger e dei Canali di Keltner, l'indicatore rivela quando il mercato si sta "comprimendo" e si sta prepar
The  OBV MTF  is an Enterprise-grade On-Balance Volume indicator that transforms standard OBV into a complete trading system. It combines gradient-aware momentum analysis, divergence detection, multi-timeframe alignment, and dynamic customisable midpoint-filtering in a single intuitive professional volume analysis tool. Core Features 1. 5-State Momentum Engine Aqua (Strong Bullish) : OBV slope rising with positive acceleration SteelBlue (Weak Bullish) : OBV rising but losing momentum Gray (Neutr
Man Trend
Ivan Simonika
Man Trend uses at its core the process of identifying the rate of change in price growth and allows you to find entry and exit points from the market. The indicator was created on the basis of the original indicators for searching for extreme points, the indicator is well suited for determining a reversal or a large sharp jerk to one of the sides, thanks to it you will know when this happens, it will notify you with the appearance of a blue dot to buy red to sell. This is a fundamental techni
Indicatore per determinare flat e trend. Se il prezzo è inferiore a uno qualsiasi dei due istogrammi e delle due linee (rossa e blu), questa è una zona di vendita. Quando acquisti questa versione dell'indicatore, versione MT4 per un conto reale e uno demo - in regalo (per ricevere, scrivimi un messaggio privato)! Se il prezzo è al di sopra di uno dei due istogrammi e delle due linee (rossa e blu), questa è una zona di acquisto. Versione MT4: https://www.mql5.com/en/market/product/3793 Se il
Nota di sviluppo: Break Out Explosion è in sconto per un periodo limitato, prossimo prezzo: 69$ Simboli: USDCHF, USDJPY, XAUUSD, GBPUSD, EURUSD, AUDUSD, GBPJPY (A mo USDCHF_H1 ) Timeframe: M15, H1, H4, D1 Caratteristiche principali: Nessun repaint, nessun ritardo, segnale direzionale, conferme multiple Sicurezza: I segnali includono stop loss, take profit e rispettano la regola rischio/rendimento Include: Scanner multi-timeframe gratuito (Dopo aver acquistato questo prodotto, inviami sempliceme
TradeAQ
Guo Sheng Zhao
LuoMo Volume & Price Structure 8.98 A multi-function chart indicator for   MetaTrader 4 and MetaTrader 5 , designed to display key volume, volatility, sentiment, and price-structure information directly on the main chart. Main Features Volume and price-based Support & Resistance Volume spike and exhaustion signals ATR volatility expansion alerts Volume Profile with HVN and LVN Bullish and bearish sentiment distribution Developing or fixed POC VAH and VAL levels Supply and Demand zones Volume-wei
مؤشر Smart SR Structure Pro MT5 هو مؤشر تداول شامل مصمم لمساعدة المتداولين على تحليل بنية السوق ومناطق الدعم والمقاومة والاختراقات وسلوك السعر مباشرة على الرسم البياني. يقوم المؤشر تلقائيًا باكتشاف قنوات الدعم والمقاومة الرئيسية، ويعرض تسميات هيكل السوق مثل HH وHL وLH وLL، ويسلط الضوء على مستويات BOS وCHoCH لمساعدة المتداولين على تحديد مناطق استمرار الاتجاه أو انعكاسه المحتملة. كما يتضمن مؤقتًا احترافيًا للشموع، ومتوسطات متحركة اختيارية، وألوانًا قابلة للتخصيص، وعرض خطوط قابل للتعديل، وتسميات و
Gold Crazy EA MT5
Nguyen Nghiem Duy
Gold Crazy EA   is an Expert Advisor designed specifically for trading Gold H1/ EU M15. It use some indicators to find the good Entry. And you can set SL or you can DCA if you want. It can be an Scalping or an Grid/ Martingale depend yours setting. This EA can Auto lot by Balance, set risk per trade. You also can set TP/ SL for earch trade or for basket of trade. - RSI_PERIOD - if = -1, then the default strategy works, if >0, then the RSI strategy works - MAX_ORDERS - to trade with only 1 order,
GDS Renko Entry Helper - Free Renko Price Interaction Indicator for MetaTrader 5 GDS Renko Entry Helper is a free Renko price interaction indicator for MetaTrader 5. It helps traders highlight important areas where price reacts, slows down, returns to a zone or changes behavior around support and resistance. The tool is designed for manual Renko analysis. It does not generate buy or sell signals and does not tell the trader when to enter the market. Its purpose is to help focus attention on area
ROC acceleration-deceleration is the manual system for medium-term scalping. Indicator based on custom ROC system which defines bullish/bearish market and especially  acceleration-deceleration of tendention in the market's main direction. Buy arrow is plotted during bearish market when current trend decelerates and sell  arrow is plotted during bullish market when current trend decelerates. Main Indicator's Features Signals are not repaint,non-late or disappear(exept cases when system recalculat
TPO Profile MT5
Kyra Nickaline Watson-gordon
Definition : TPO is a Time Price Opportunity. Instead of using bars or candles with an Open, High, Low, and Close price, each "bar" in a Market Profile is represented by horizontal bars against the price It is called Market Profile terminology. In other words time-price-opportunity (TPO) profiles are histograms of how much time was spent at each price within the span of the profile. By using a TPO chart, you are able to analyze the amount of trading activity, based on time, for each price level
Meravith MT5
Ivan Stefanov
5 (3)
Strumento per market maker. Meravith: Analizzerà tutti i timeframe e mostrerà il trend attualmente in corso. Evidenzierà le zone di liquidità (equilibrio dei volumi) dove i volumi rialzisti e ribassisti sono uguali. Mostrerà tutti i livelli di liquidità dei diversi timeframe direttamente sul grafico. Genererà e presenterà un’analisi di mercato testuale a scopo di riferimento. Calcolerà obiettivi, livelli di supporto e punti di stop-loss in base al trend attuale. Calcolerà il rapporto rischio/ren
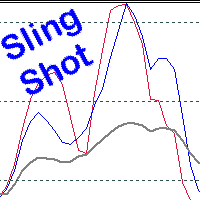
Scalping, Mean reversion or Position trading strategy Get into an established trend on a pullback in the market. Use the Pinch in the indicator for profit taking. Use the Pinch as a mean reversion strategy, scalping back to a moving average line.  Input Parameters Fast Sling Shot configuration. Slow Sling Shot configuration. Dual Sling Shot configuration. Price line configuration. Trigger zones or levels. Example of Sling Shot trade idea: Price line sets the mood, below the baseline level (50)
VFI Quantum
Nikita Berdnikov
5 (1)
Introducing VFI (Volume Flow Indicator) – a trading indicator that analyzes the relationship between volume and price movement to identify key trading opportunities. The indicator displays the strength and direction of volume flow, providing clear signals about potential entry and exit points. Signals are formed based on zero line crossovers, crossovers between the VFI line and its exponential moving average (EMA), and when the indicator exits overbought and oversold zones. Attention! This stra
FREE
Caicai L&S Yield Histogram Important Notice: This indicator is an integral tool of the automated EA Caicai Long and Short Pair Trading . This indicator visually displays the percentage deviation (Yield %) of a pair's current spread relative to its own historical mean. It is an excellent tool for quickly visualizing the gross financial potential of a market distortion in Long & Short operations. Main Features: Percentage Visualization: Understand the size of the distortion in palpable percentage
Gli utenti di questo prodotto hanno anche acquistato
Trend Sniper X
Sarvarbek Abduvoxobov
4.9 (39)
Trend Sniper X è un indicatore trend-following multi-timeframe per MetaTrader 5 che aiuta i trader a identificare la direzione del trend e i potenziali punti di inversione con chiarezza e precisione. per MT4: https://www.mql5.com/en/market/product/193245 Informazioni sul prezzo: Il prezzo attuale è promozionale ed è soggetto a modifiche con il rilascio di futuri aggiornamenti e nuove funzionalità. Offerta Bonus: Per ricevere GRATIS l'Auto-Trade Assistant EA per questo indicatore, invia un messa
Neuro Poseidon MT5
Daria Rezueva
4.75 (52)
Neuro Poseidon is a new indicator by Daria Rezueva. It combines precise trading signals with adaptive TP/SL levels - creating best possible trades as a result! Message me and get  Neuro Poseidon Assistant  as a gift to automize your trading process! What makes it stand out? 1. Proven profitability on all assets and timeframes 2. Only confirmed BUY and SELL signals present on the chart 3. Adaptive TP & SL levels generated by the software for each trade 4. Easy to understand - suitable for al
M1 Sniper MT5
Oleg Rodin
5 (7)
M1 SNIPER   è un sistema di indicatori di trading facile da usare. Si tratta di un indicatore a freccia progettato per l'intervallo temporale M1. L'indicatore può essere utilizzato come sistema autonomo per lo scalping sull'intervallo temporale M1 e come parte del tuo sistema di trading esistente. Sebbene questo sistema di trading sia stato progettato specificamente per il trading sull'intervallo temporale M1, può comunque essere utilizzato anche con altri intervalli temporali. Inizialmente ho p
Gann Made Easy è un sistema di trading Forex professionale e facile da usare che si basa sui migliori principi del trading utilizzando la teoria di mr. WD Gann. L'indicatore fornisce segnali ACQUISTA e VENDI accurati, inclusi i livelli di Stop Loss e Take Profit. Puoi fare trading anche in movimento utilizzando le notifiche PUSH. CONTATTAMI DOPO L'ACQUISTO PER RICEVERE GRATUITAMENTE LE ISTRUZIONI DI TRADING E OTTIMI INDICATORI EXTRA! Probabilmente hai già sentito parlare molte volte dei metodi d
La leggenda ritorna: Entry Points Pro 10. Il rilancio del leggendario indicatore che per 3 anni è rimasto nella Top-3 del MQL5 Market. Centinaia di recensioni entusiaste (589 su due versioni), migliaia di trader lo usano ogni giorno per operare, 31.000+ download della demo   MT4+MT5 . Ho letto ogni vostra recensione degli ultimi cinque anni — e invece di promesse ho inserito nella versione 10 le risposte. Dall'autore che opera sui mercati dal 1999 e tiene all'onestà, alla propria reputazione e a
Currency Strength Wizard   è un indicatore molto potente che ti fornisce una soluzione all-in-one per un trading di successo. L'indicatore calcola la potenza di questa o quella coppia forex utilizzando i dati di tutte le valute su più intervalli di tempo. Questi dati sono rappresentati in una forma di indice di valuta facile da usare e linee elettriche di valuta che puoi utilizzare per vedere il potere di questa o quella valuta. Tutto ciò di cui hai bisogno è collegare l'indicatore al grafico ch
Adaptive Price Action Engine Acquista un indicatore, ricevi l'EA gratis Analisi Auto-Ottimizzata del Trend e dei Pattern Candlestick Multi-Timeframe I mercati cambiano continuamente e non tutti i pattern di Price Action hanno lo stesso valore in ogni condizione di mercato. Adaptive Price Action Engine è progettato per adattarsi alle condizioni di mercato in continua evoluzione, combinando struttura del trend, analisi Multi-Timeframe, pattern Candlestick e ottimizzazione statistica in un unico fr
Divergence Bomber
Ihor Otkydach
4.89 (94)
Ogni acquirente dell’indicatore riceverà inoltre gratuitamente: L’utilità esclusiva “Bomber Utility”, che gestisce automaticamente ogni operazione, imposta i livelli di Stop Loss e Take Profit e chiude le posizioni secondo le regole della strategia I file di configurazione (set file) per adattare l’indicatore a diversi asset I set file per configurare il Bomber Utility in tre modalità: “Rischio Minimo”, “Rischio Bilanciato” e “Strategia di Attesa” Una guida video passo-passo per installare, con
Auto Optimized SpeedAngle è un sistema di vettorizzazione del momento di livello istituzionale che elimina l'overfitting ( curve-fitting ) attraverso l'ottimizzazione continua Walk-Forward (WFO). Invece di affidarsi a input statici che si degradano quando i regimi di mercato cambiano, l'indicatore recalibra dinamicamente i suoi parametri utilizzando la validazione Out-of-Sample (OOS), assicurando che i segnali visualizzati rappresentino reali vantaggi statistici anziché anomalie storiche. Quadro
Volatility Master for MetaTrader is a real-time dashboard tool that scans up to  50 symbols  to identify high-volatility , trending markets instantly. With bullish/bearish signals, customizable alerts, and a user-friendly interface, it helps you avoid range-bound conditions and focus on high-probability trades. Clarity leads to confidence. Trade confidently and protect your capital effectively with this powerful dashboard. We don't offer free or bonus indicators in exchange of reviews from you.
PZ Trend Trading MT5
PZ TRADING SLU
3.8 (5)
Capture every opportunity: your go-to indicator for profitable trend trading Trend Trading is an indicator designed to profit as much as possible from trends taking place in the market, by timing pullbacks and breakouts. It finds trading opportunities by analyzing what the price is doing during established trends. [ Installation Guide | Update Guide | Troubleshooting | FAQ | All Products ] Trade financial markets with confidence and efficiency Profit from established trends without getting whips
IQ FX Gann Levels a precision trading indicator based on W.D. Gann’s square root methods . It plots real-time, non-repainting support and resistance levels to help traders confidently spot intraday and scalping opportunities with high accuracy. William Delbert Gann (W.D. Gann) was an exceptional market analyst, whose trading technique was based on a complex blend of mathematics, geometry, astrology, and ancient mathematics which proved to be extremely accurate. We don't offer free or bonus indic
RelicusRoad Pro MT5
Relicus LLC
4.96 (24)
RelicusRoad Pro: Sistema Operativo Quantitativo di Mercato 70% DI SCONTO ACCESSO A VITA (TEMPO LIMITATO) - UNISCITI A 2.000+ TRADER Perché la maggior parte dei trader fallisce anche con indicatori "perfetti"? Perché operano su Singoli Concetti isolati. Un segnale senza contesto è una scommessa. Per vincere serve CONFLUENZA . RelicusRoad Pro non è un semplice indicatore. È un Ecosistema Quantitativo completo . Mappa la "Fair Value Road", distinguendo tra rumore e rotture strutturali. Smetti di in
PZ Divergence Trading MT5
PZ TRADING SLU
3.71 (7)
Unlock hidden profits: accurate divergence trading for all markets Tricky to find and scarce in frequency, divergences are one of the most reliable trading scenarios. This indicator finds and scans for regular and hidden divergences automatically using your favourite oscillator. [ Installation Guide | Update Guide | Troubleshooting | FAQ | All Products  ] Easy to trade Finds regular and hidden divergences Supports many well known oscillators Implements trading signals based on breakouts Displays
First time on MetaTrader, introducing IQ Star Lines - an original Vedic Astrology based indicator. "Millionaires don't use astrology, billionaires do" . - J.P. Morgan, Legendary American financier and banker. We don't offer free or bonus indicators in exchange of reviews from you. You won't need any free products with this indicator to make it work. ;) Enjoy! Welcome to  the new and updated  IQ Star Lines , the ultimate fusion of ancient planetary harmonic cycles and modern quantitative trading.
L'indicatore UZFX {SSS} Scalping Smart Signals v5.0 MT5 è un indicatore di trading ad alte prestazioni che non subisce ripaint, progettato per scalper, day trader e swing trader che necessitano di segnali accurati e in tempo reale in mercati in rapida evoluzione. Sviluppato da (UZFX-LABS), questo indicatore combina l’analisi dell’azione dei prezzi, la conferma del trend e il filtraggio intelligente per generare segnali di acquisto e vendita ad alta probabilità, segnali di allerta e opportunità d
Gartley Hunter Multi
Siarhei Vashchylka
5 (12)
Gartley Hunter Multi - An indicator for searching for harmonic patterns simultaneously on dozens of trading instruments and on all possible timeframes. Manual (Be sure to read before purchasing) | Version for MT4 Advantages 1. Patterns: Gartley, Butterfly, Shark, Crab. Bat, Alternate Bat, Deep Crab, Cypher 2. Simultaneous search for patterns on dozens of trading instruments and on all possible timeframes 3. Search for patterns of all possible sizes. From the smallest to the largest 4. All fou
SkyHammer Signal Pro Indicatore professionale di segnali trend no-repaint con livelli Entry, SL e TP bloccati SkyHammer Signal Pro è un indicatore strutturato di trend e momentum, progettato per trader che desiderano segnali chiari, fissi e verificabili. Funziona al meglio su timeframe bassi, come M1 e M5 . L’indicatore non cerca di prevedere massimi o minimi del mercato. Attende invece una struttura di mercato confermata, una chiara direzione del trend, forza del momentum, volatilità sana e spa
M1 Quantum MT5
Hamed Dehgani
4.2 (10)
Segnali di Trading Live con M1 Quantum: Segnale   (Operazione eseguita automaticamente dal Quantum Trade Assistant , incluso gratuitamente con questo prodotto.) Ultime notizie: La versione 1.64 è stata rilasciata. Ora tutte le operazioni hanno uno Stop Loss posizionato dietro le relative zone di Supporto/Resistenza. Anche la funzione Smart Close è stata migliorata per aumentare le prestazioni dell'EA in questa versione. Dal 9 agosto, il segnale live è in esecuzione sulla versione 1.64. Piano pr
Superhero
Ihor Otkydach
5 (3)
L'indicatore SUPERHERO è un sistema di trading multivaluta progettato secondo un approccio "all-inclusive". L'indicatore analizza autonomamente il mercato e fornisce segnali su quando aprire e chiudere le posizioni. Utilizza ordini Stop Loss e Take Profit. Il rapporto R:R è 1:1. Questo sistema è in grado di inviare notifiche push sul tuo smartphone, consentendoti di effettuare operazioni "in mobilità" senza dover rimanere incollato al PC. È perfetto per le società di trading proprietario. UN OMA
Scalper Vault   è un sistema di scalping professionale che ti fornisce tutto il necessario per scalping di successo. Questo indicatore è un sistema di trading completo che può essere utilizzato dai trader di forex e opzioni binarie. L'intervallo di tempo consigliato è M5. Il sistema fornisce segnali di freccia accurati nella direzione della tendenza. Ti fornisce anche i segnali più alti e più bassi e i livelli di mercato di Gann. Gli indicatori forniscono tutti i tipi di avvisi, comprese le noti
Shock Pullback
Suleiman Alhawamdah
5 (1)
Semplicemente, puoi iniziare a fare trading quando il movimento dei numeri bianchi — noti come "pips" — inizia ad apparire accanto alla candela corrente. I "pips" bianchi indicano che un'operazione di acquisto o vendita è attualmente attiva e si sta muovendo nella direzione corretta, come indicato dal colore bianco. Quando il movimento dei pips bianchi si interrompe e diventa di colore verde statico, questo segnala la fine della spinta attuale. Il colore verde dei numeri rappresenta il profitto
Volume Profile Multiple — Profili di Volume Multipli con Buffer per il Trading Algoritmico Stanco di ridisegnare il Volume Profile blocco per blocco, ricalcolando tutto ogni volta che cambi timeframe? Volume Profile Multiple traccia automaticamente più profili di volume consecutivi sul grafico, rivelando dove si è realmente concentrato l'interesse istituzionale in ogni tratto del mercato — non solo nell'ultimo intervallo visibile. Cosa fa l'indicatore per te L'indicatore suddivide lo storico dei
Presenting one-of-a-kind Gann Indicator for XAUUSD IQ Gold Gann Levels is a non-repainting, precision tool designed exclusively for XAUUSD intraday trading. It uses W.D. Gann’s square root method to plot real-time support and resistance levels, helping traders spot high-probability entries with confidence and clarity. William Delbert Gann (W.D. Gann) was an exceptional market analyst whose trading technique was based on a complex blend of mathematics, geometry, astrology, and ancient calculation
Gem SIGNAL
Shengzu Zhong
5 (1)
GEM Signal Pro GEM Signal Pro è un indicatore trend-following per MetaTrader 5, progettato per i trader che desiderano segnali più chiari, configurazioni operative più strutturate e una gestione del rischio più pratica direttamente sul grafico. Invece di mostrare solo una semplice freccia, GEM Signal Pro aiuta a presentare l’intera idea di trading in modo più chiaro e leggibile. Quando le condizioni sono confermate, l’indicatore può mostrare sul grafico il prezzo di ingresso, lo stop loss e gli
Azimuth Pro
Ottaviano De Cicco
5 (7)
Azimuth Pro V2: Synthetic Fractal Structure and Confirmed Entries for MT5 Overview Azimuth Pro is a multi-level swing structure indicator by Merkava Labs . Four nested swing layers, swing-anchored VWAP, ABC pattern detection, three-timeframe structural filtering, and closed-bar confirmed entries — one chart, one workflow from micro-swings to macro-cycles. This is not a blind signal product. It is a structure-first workflow for traders who care about location, context, and timing. ️ Summer Sale
Btmm state engine pro
Garry James Goodchild
5 (4)
BTMM State Engine Pro by G-Labs — Beat The Market Maker indicator for MetaTrader 5. Asian session range, London and New York kill zones, level progression (L1/L2/L3), peak formation detection (PFH/PFL), entry signals, and a multi-pair scanner from one chart. Stop scanning charts one pair at a time. The State Engine tracks the BTMM daily cycle automatically — Asian box, room boundaries, level blocks, peak formations, and filtered entries — while the scanner dashboard shows level, peak status, d
SR Liquidity   è un indicatore di trading progettato per individuare le zone nascoste in cui si concentra la liquidità di mercato e dove il prezzo reagisce con maggiore intensità. Queste aree di liquidità agiscono come potenti livelli di supporto e resistenza, offrendo una mappa chiara dei punti in cui è più probabile che il mercato inverta la propria direzione. Invece di tracciare le classiche linee di supporto e resistenza, SR Liquidity analizza l'effettivo comportamento dei prezzi per individ
Advanced Supply Demand MT5
Bernhard Schweigert
4.53 (15)
La migliore soluzione per qualsiasi principiante o trader esperto! Questo indicatore è uno strumento di trading unico, di alta qualità e conveniente perché abbiamo incorporato una serie di funzionalità proprietarie e una nuova formula. Con questo aggiornamento, sarai in grado di mostrare fusi orari doppi. Non solo potrai mostrare una TF più alta, ma anche entrambe, la TF del grafico, PIÙ la TF più alta: SHOWING NESTED ZONES. Tutti i trader di domanda di offerta lo adoreranno. :) Informazioni imp
The Louis SMC & Liquidity Master is a complete, institutional-grade market structure and liquidity mapping system built for MetaTrader 5. Designed for serious Smart Money Concepts (SMC) traders, this tool dynamically tracks multi-timeframe trends, supply and demand zones, and critical liquidity sweeps without cluttering your chart. Whether you trade major Forex currency pairs or highly volatile synthetic indices like Boom and Crash, the indicator automatically adapts to price action, filtering
Filtro:
Nessuna recensione
Rispondi alla recensione