Tick Volume Moving Averages

Bullish Bearish Volume — Measured Participation for MT5

Most volume indicators ship with settings somebody liked the look of. This one ships with settings measured against historical market data.

Bullish Bearish Volume was developed using research covering 146,764 hourly EUR/USD bars from 2003 to 2026. Instead of relying on conventional moving-average periods or visual optimisation, its settings are informed by measurements of volume seasonality, smoothing lag, clock bias and directional behaviour.

The indicator separates each candle's volume into bullish and bearish components, smooths them using your choice of 10 moving-average algorithms, and displays the result as two lines in a dedicated subwindow. An optional gradient candle overlay brings the same information directly onto the price chart.

Its central purpose is to help you distinguish meaningful relative activity from the predictable changes in volume caused by the trading clock.

It is a volume participation and analysis tool, not a promise of future price direction.

WHAT IT MEASURES

Two lines show how much reported volume is associated with bullish and bearish price behaviour.

Four selectable methods determine the allocation:

  • Body Direction (default): Attributes the bar's volume according to whether the candle closed above or below its open.

  • Close Location in Range: Divides volume proportionally according to the close's position between the high and low. A close at the high assigns the full volume to the bullish side; a midpoint close splits it equally.

  • Previous Close (OBV style): Classifies volume according to whether the close is above or below the previous candle's close.

  • Direction + Volume Confirmation: The original classification method, retained for users who want to examine agreement between candle direction and rising or falling volume.

The difference between the two smoothed lines measures directional dominance in the chosen classification.

Important distinction: These methods are price-derived estimates. They do not measure the actual volume executed at the bid or ask, and should not be confused with exchange order flow.

The same relative dominance controls the candle colours on the main chart, allowing you to read the indicator without constantly looking at its subwindow.

WHAT MAKES IT DIFFERENT

1. The time-of-day problem — measured, not guessed

The time-of-day problem, and the fix. Across 2003–2026, 78% of the variance in log volume is explained by the calendar alone: hour of day, weekday, year. Activity runs 0.60x at 04:00 and 1.86x at 16:00 UTC. Most volume indicators show you that pattern and call it a signal.

An average spanning exactly one full cycle cancels it, because every hour enters the window exactly once. Measured residual time-of-day bias in the line:

A Simple Moving Average covering exactly one full daily cycle can mathematically cancel a fixed 24-hour seasonal pattern.

Measured residual hour-of-day bias in one period experiment:

SMA period Residual bias
12 12.63%
18 3.65%
22 0.44%
23 0.11%
24 0.00%
25 0.09%
26 0.32%
36 1.97%
48 0.00%

The exact measurements depend on the sample and methodology, but the principle is important: complete-cycle averaging suppresses periodic volume patterns more effectively than arbitrary window lengths.

The indicator automatically adapts its smoothing period to the selected timeframe:

  • M15 — 96 bars

  • M30 — 48 bars

  • H1 — 24 bars

  • H4 — 6 bars

  • D1 — 20 bars by default, covering four trading weeks

  • W1 and above — four cycles by default

The user can select one, two, three or five cycles, or enter any custom period.

EMA is the default for responsiveness. SMA is the recommended choice when cancellation of the fixed seasonal cycle is the priority. Unlike SMA, EMA attenuates the daily cycle rather than eliminating it completely.

2. Ten moving averages — selected by measurement

The development research compared 33 smoothing approaches and retained 10 implementations, ranked using their measured properties.

Available algorithms:

  • SMA — Simple Moving Average

  • Trimmed Mean — rejects the highest and lowest 20% of observations in each complete window

  • VIDYA — Chande's adaptive moving average

  • KAMA — Kaufman's Adaptive Moving Average

  • ADXVMA — adaptive smoothing using directional movement

  • T3 — Tillson's six-stage smoothing

  • SMMA — Wilder's Smoothed Moving Average

  • FRAMA — Fractal Adaptive Moving Average

  • LWMA — Linear Weighted Moving Average

  • EMA — Exponential Moving Average

The dropdown includes research annotations describing lag and residual clock behaviour, rather than presenting all averages as interchangeable.

For example, SMA provides strong periodic cancellation, VIDYA and KAMA prioritise smoother adaptive readings, while ADXVMA and FRAMA offer alternatives for traders who prefer faster response.

DEMA, TEMA, ZLEMA and HMA were evaluated but excluded from the current selection. Their tendency to overshoot below zero can be undesirable when smoothing a nonnegative volume series.

An optional negative-value clamp is included for algorithms that may overshoot.

3. Seasonal normalisation — relative activity instead of raw volume

Optional seasonal normalisation compares each bar with the historical activity typical of its own calendar slot.

Research found that the EUR/USD hourly activity profile developed on 2003–2014 data retained a correlation of approximately r = 0.82 when compared with 2015–2026.

The indicator does not require the user to download that research dataset. Instead, it builds expectations automatically from the broker history available to the indicator.

  • Intraday charts use hour-of-day profiles.

  • Daily charts use weekday profiles.

  • Weekly and higher timeframes retain their original volume scale.

  • Historical bars are normalised using observations preceding them, rather than future observations.

With seasonal normalisation active, a value near 1.0 represents approximately normal activity for the relevant slot; 2.0 represents roughly twice the expected activity before the bullish/bearish split.

This helps distinguish an unusually active quiet session from an entirely ordinary busy session.

4. Reference levels — Normal, Extreme and Minimal

Three reference levels are enabled by default to help interpret the volume lines without guessing what constitutes unusually high or low activity.

NORMAL: The median of the recent bullish and bearish readings, representing typical participation.

EXTREME: The 95th-percentile reference level, identifying unusually elevated readings.

MINIMAL: The 5th-percentile reference level, identifying unusually subdued readings.

The reference horizon adapts to the timeframe and available history.

Instead of drawing multiple overlapping historical averages, the indicator uses one central reference and two extremes to keep the subwindow readable.

All three levels can be enabled or disabled through the inputs.

5. Four signal methods — with published research

The indicator includes four selectable directional signal modes.

Historical testing of EUR/USD H1 volume dominance found that following the indicated direction performed below 50% in the next-bar directional test. Taking the opposite side produced the following results:

Signal method Opposite-direction hit rate
Dominance threshold 53.39%
Line crossover 52.94%
Dominance slope 52.35%
Dominant line level 51.64%

The threshold result used a dominance threshold of 0.15.

For this reason, the signal-direction inversion option is enabled by default when signals are activated.

The four modes allow you to study different aspects of relative volume dominance, while optional chart arrows provide a visual indication of the selected signal.

These figures are historical directional frequencies, not strategy returns. They do not include transaction costs, stop-loss behaviour or the magnitude of winning and losing moves. Signals are disabled by default.

6. Bollinger Bands — calibrated for volume

Optional Bollinger Bands are calculated around the midpoint of the bullish and bearish volume lines.

Rather than using the conventional period of 20 without investigation, the default is 24 periods with two standard deviations.

In the development measurements:

Measurement Period 20 Period 24
Containment 91.5% 93.4%
Residual hour bias 28.5% 19.0%

The midpoint represents combined participation without directional attribution.

The band calculation offers a selectable moving-average basis, adjustable period, deviation, line width and colour.

The lower band is clamped at zero because negative volume has no meaningful interpretation.

7. Gradient candles — volume dominance directly on price

The indicator can colour the price candles according to the relative dominance between its bullish and bearish lines.

  • Bullish dominance uses the selected bullish colour family.

  • Bearish dominance uses the selected bearish colour family.

  • Greater dominance produces a stronger shade.

  • Balanced activity produces a weaker shade.

Candle bodies and wicks are positioned using chart pixel coordinates rather than approximate time-based rectangles.

Their dimensions are recalculated when the chart changes, allowing the overlay to follow scrolling, zooming and price-scale adjustments.

Customisable body width, wick width, border visibility, foreground/background placement and gradient intensity are included.

Six colour schemes are available: three designed for dark charts and three for light charts.

COMPLETE FEATURE LIST

  • Four bullish/bearish volume classification methods

  • Ten selectable moving-average algorithms with measured characteristics

  • Automatic cycle-based smoothing periods

  • Direct numerical period override

  • Multi-timeframe analysis using a higher timeframe on a lower-timeframe chart

  • Optional stepped or interpolated higher-timeframe display

  • Seasonal normalisation by hour of day or weekday, where applicable

  • Normal, Extreme and Minimal volume reference levels

  • Gradient candle overlay with pixel-based chart alignment

  • Six colour schemes for dark and light backgrounds

  • Adjustable candle bodies, wicks and gradient intensity

  • Bollinger Bands around the combined-volume midpoint

  • Selectable Bollinger moving-average type and deviations

  • Optional bullish/bearish difference histogram

  • Four research-ranked signal modes

  • Optional directional inversion and chart arrows

  • Configurable smoothing and negative-value clamping

  • Timeframe-specific subwindow names, such as HOURLY VOLUME, 4HRS VOLUME and DAILY VOLUME

  • Adjustable calculation and candle-display limits

  • Tick-volume support, plus broker-provided real-volume selection in MT5

The histogram uses a 12-step colour palette in MetaTrader 5. MetaTrader 4 uses separate bullish and bearish histogram colours.

DEFAULT SETTINGS

Setting Default
Smoothing period Auto
Period override 0 — automatic
Moving-average type EMA
Volume split Body Direction
Timeframe Current chart
Colour scheme Blue / Red, dark
Gradient candles Enabled
Candle body width 70%
Candle wick width 8%
Seasonal normalisation Disabled
Normal reference level Enabled
Extreme / Minimal levels Enabled
Bollinger Bands Disabled
Bollinger period 24
Bollinger deviations 2.0
Difference histogram Disabled
Directional signals Disabled
Signal inversion Enabled
Negative-value clamp Enabled
Volume type Tick volume

Additional controls for line colours, band thickness, candle appearance, displayed bars, signal parameters and adaptive-average settings are available in the inputs.

MULTI-TIMEFRAME (MTF) VOLUME ANALYSIS


Analyse higher-timeframe bullish and bearish volume directly on your current trading chart — without switching timeframes.

Bullish Bearish Volume includes built-in Multi-Timeframe (MTF) functionality, allowing traders to monitor broader market participation while analysing short-term price movements.

For example:

  • M1 chart + M15 volume: Examine short-term price action alongside 15-minute volume dominance.

  • M5 chart + H1 volume: Follow hourly bullish and bearish participation while looking for entries on the 5-minute chart.

  • M15 chart + H4 volume: Compare intraday price movements with 4-hour volume conditions.

  • H1 chart + D1 volume: Monitor daily participation without leaving the hourly chart.

MTF Features

  • Selectable analysis timeframe: Choose the current chart timeframe or any supported higher timeframe.

  • Automatic timeframe mapping: Higher-timeframe volume readings are projected onto the corresponding lower-timeframe candles.

  • Two display modes: Select stepped lines, which hold each higher-timeframe value across its corresponding chart candles, or interpolated lines for a smoother visual presentation.

  • Timeframe-labelled subwindow: Names such as HOURLY VOLUME, 4HRS VOLUME and DAILY VOLUME identify the timeframe being analysed.

  • Multiple timeframe comparisons: Attach separate indicator instances with different timeframe settings to compare short-term and longer-term participation.

  • Full indicator analysis: The chosen higher timeframe supplies the bullish/bearish volume readings used by the indicator's smoothing and associated analysis.

MTF analysis is especially useful for traders who want to examine lower-timeframe price movements in the context of broader volume conditions.

Example: When trading EUR/USD on M5, select H1 as the indicator timeframe. The subwindow will display hourly bullish and bearish volume analysis while the main chart remains on M5.

Important: Historical higher-timeframe values may reflect information that was not yet final during the formation of that higher-timeframe candle, particularly in interpolated mode. MTF visualisation should not be treated as a guaranteed non-repainting or look-ahead-free trading signal.


RESEARCH PHILOSOPHY

The indicator was designed around a distinction that matters: a setting that looks best in historical data is not necessarily a setting that generalises to new data.

The accompanying development research compared approximately 450 parameter combinations, using 2003–2014 as a development period and 2015–2026 as an out-of-sample period.

Reported correlations between performance across the two periods were negative, ranging from approximately −0.35 to −0.57.

This was evidence against choosing indicator settings solely because they maximised historical directional results.

The defaults therefore favour measurable structural properties — full-cycle smoothing, controlled lag, nonnegative volume behaviour and understandable interpretation — rather than optimised trading returns.

HOW TO USE IT

Use Bullish Bearish Volume to examine:

  • Whether current volume is unusually high or low relative to its historical context.

  • Whether bullish or bearish price behaviour dominates the selected volume classification.

  • Whether a move is supported by increasing measured activity or accompanied by declining activity.

  • Whether short-timeframe price action agrees with a higher-timeframe volume backdrop.

  • Whether an apparent volume spike is meaningful or simply part of the normal trading-session cycle.

  • How dominance, crossovers and reversals behave under different smoothing methods.

The indicator is intended as a research and chart-analysis companion to price action, market structure and risk management.

Measure participation. Understand the clock. Make your own trading decisions.


Рекомендуем также
TRI Visualizer MT5 – Thermodynamic Market Analysis Overview The TRI (Thermal Range Indicator) Visualizer Enhanced is a rare market analysis indicator that goes beyond conventional technical analysis, applying principles of thermodynamics from physics. It interprets market price fluctuations as “thermodynamic energy,” enabling the highly accurate detection of subtle market changes that are often overlooked. Innovative Mechanisms 1. Dual Calculation Engines Classic TRI Mode Formula: |Close
Профиль Рынка (Market Profile) определяет ряд типов дней, которые помогают трейдеру распознать поведение рынка. Ключевая особенность - это область значений (Value Area), представляющая диапазон ценового действия, в котором произошло 70% торговли. Понимание области значений может помочь трейдерам вникнуть в направление рынка и установить торговлю с более высокими шансами на успех. Это отличное дополнение к любой системе, которую вы возможно используете. Blahtech Limited представляет сообществу Me
ApeX Trade Manager MT5  →     ApeX Journal MT5  →     ApeX Indicator SMC MT5  →     ApeX Indicator ICT Concepts MT5  →     ApeX Indicator Volume Profile MT5  →    ApeX Indicator ICT Macros MT5  → One profile per session tells you about the session. One profile per swing tells you about the trade you are in. ApeX Volume Profile builds a profile for every pivot the market makes. 1. The profile Point of Control — The price where the most volume traded in that leg, optionally extended right or bo
Индикатор Cumulative Volume Delta (CVD) — или «кумулятивная дельта объема» (а также связанные с ним свечи Volume Delta) — относится к категории индикаторов потока ордеров (order flow), основанных на данных об объеме торгов. В отличие от стандартного индикатора объема, который просто отображает общий уровень торговой активности, CVD измеряет чистую разницу между давлением покупателей и давлением продавцов на рынке. Вот как это работает: Volume Delta (свечи): этот показатель измеряет разницу м
Volume Candle Indicator
Pablo Filipe Soares De Almeida
Volume Color Histogram для MetaTrader 5 Этот индикатор отображает объем в виде гистограммы в отдельном окне. Столбцы окрашиваются в зависимости от направления свечи: зеленый для бычьих (close > open) и красный для медвежьих (close < open). Основные функции Источник объема: тиковый объем или реальный (на выбор пользователя). Дополнительная линия скользящей средней поверх гистограммы объема, которую можно включить через настройки. Поддерживаемые типы средних: SMA, EMA, SMMA, LWMA. Период усреднени
This Volume Delta Profile is an advanced MetaTrader 5 indicator that visualizes   volume delta (order flow imbalance)   using a volume profile-style histogram. It shows the difference between buying and selling pressure at specific price levels, helping traders identify supply and demand zones. This indicator provides a unique perspective on market dynamics by visualizing the imbalance between buying and selling pressure, offering insights beyond traditional volume analysis. Core Concept Positiv
Cumulative Volume Delta MA-X MTF (с градиентным импульсом) Этот индикатор выполняет мультитаймфреймовый анализ кумулятивной дельты объема (CVD) для платформы MetaTrader 5. Он рассчитывает чистую разницу между давлением покупателей и продавцов, анализируя тиковые данные или реальный объем, что позволяет визуально оценить настроения потока ордеров. Логика и функции индикатора Индикатор использует математический подход к анализу объема: Источники данных: Поддержка как реального объема ( Real Volum
Launch price: 30 USD - price will increase after the first purchases, so early buyers lock in this rate. Volume Vacuum Profile is a session-by-session Volume Profile indicator for MetaTrader 5. It combines the daily Point of Control (POC), a full volume histogram and automatic Low Volume Node (LVN) detection - the liquidity vacuum zones where price tends to move fast due to a lack of resting orders. Key features: - Volume histogram built from 1-minute data for each trading day, independent of
Introducing PivotWave – your ultimate trading companion that redefines precision and market analysis. Designed with traders in mind, PivotWave is more than just an indicator; it’s a powerful tool that captures the pulse of the market, identifying key turning points and trends with pinpoint accuracy. PivotWave leverages advanced algorithms to provide clear visual signals for optimal entry and exit points, making it easier for traders to navigate volatile market conditions. Whether you are a begin
Wapv Price and volume
Eduardo Da Costa Custodio Santos
Индикатор цены и объема WAPV для MT5 является частью набора инструментов (Wyckoff Academy Wave Market) и (Wyckoff Academy Price and Volume). Индикатор цены и объема WAPV для MT5 был создан, чтобы упростить визуализацию движения объема на графике интуитивно понятным способом. С его помощью можно наблюдать моменты пикового объема и моменты, когда рынок не представляет профессионального интереса. Определите моменты, когда рынок движется по инерции, а не по движению «умных денег». Он состоит из 4 цв
Индикатор инструмента "Умный прямоугольник спроса и предложения" — ваш идеальный спутник для MT5, позволяющий мгновенно визуализировать ключевые данные спроса и предложения прямо на ваших зонах в реальном времени. Этот инструмент автоматически накладывает богатые и действенные данные на ваши зоны, такие как классификация зоны, расстояние в пунктах, сила и размер зоны, аккуратно размещённые внутри каждой зоны. Больше никакого беспорядка, никаких догадок — только чёткие, динамичные данные для по
Russian Этот индикатор служит передовым помощником по анализу графиков для трейдеров, предпочитающих торговлю по графическим паттернам. Он разработан для снижения нагрузки при визуальном анализе и повышения точности извлечения прибыли. Основные преимущества данного индикатора с практической точки зрения: 1. Автоматическое распознавание паттернов (Automated Pattern Detection) Экономия времени и снижение предвзятости: Вам больше не нужно вручную чертить трендовые линии. Индикатор находит ценовые р
WaveTrend Oscillator MT5 — это мощный торговый индикатор, предназначенный для улучшения вашего анализа рынка путем выявления изменений импульса и потенциальных разворотов тренда. Идеален для трейдеров всех уровней, этот инструмент предлагает ценные инсайты о перепроданных и перекупленных условиях на различных рынках, включая forex, криптовалюты и товары. Благодаря своей способности генерировать точные сигналы на покупку и продажу, WaveTrend Oscillator MT5 дает трейдерам возможность принимать обо
Volume Profile Canvas - Professional Volume Profile Indicator for MetaTrader 5 DESCRIPTION Volume Profile Canvas is a professional volume profile indicator for MetaTrader 5 that renders directly on the chart using a high-performance Canvas engine. It calculates and displays the volume distribution across price levels, identifying the Point of Control (POC), Value Area High (VAH) and Value Area Low (VAL) in real time. This is a pure analysis tool. It does not trade. It gives you an instant vi
Индикатор позволяет анализировать изменения тиковых объемов в виде кумулятивных дельта-баров (свечей). Он вычисляет на каждом баре тиковые объемы для покупок и продаж (раздельно), а также их разницу. Кроме того, он может выводить объемы в разбивке по кластерам (ячейкам) цен внутри указанного бара (обычно это последний бар). Данный индикатор производит вычисления аналогично VolumeDeltaMT5 , но предоставляет иное отображение результатов. Имеется версия для МетаТрейдер 4 - CumulativeDeltaBars . Это
Weis Wave Scouter
Jean Carlos Martins Roso
Откройте для себя силу продвинутого анализа объема с Weis Wave Scouter — революционным индикатором для MetaTrader 5, который сочетает проверенные временем принципы метода Вайкоффа и анализа объема VSA (Volume Spread Analysis). Разработанный для трейдеров, стремящихся к точности и глубине в своих операциях, этот индикатор предлагает тактическое чтение рынка через анализ кумулятивных волн объема, помогая выявлять ключевые точки разворота и продолжения тренда. Weis Wave Scouter имеет четкий визуаль
Confluence Meter: сводный рейтинг 26 индикаторов на одной панели Confluence Meter считает сигналы 26 популярных индикаторов и сводит их в простую оценку «продавать / нейтрально / покупать». Не нужно открывать десятки окон и сверять показания вручную: одного взгляда на панель достаточно, чтобы понять, куда склоняется рынок на выбранном таймфрейме. MT4-version:  https://www.mql5.com/en/market/product/199466 Our products: https://www.mql5.com/en/users/trendhunter/seller Что вы видите на графике Ци
Symbol: EURUSD Timeframe: 30 minutes (M30) For other symbols or timeframes, adjust the settings to match the market. Volume Profile POC Breakout builds a volume profile from recent candles, finds the Point of Control (POC) and marks clean breakouts of that level. Each breakout is shown as a complete trade plan with entry, stop loss and three take profit levels, filtered by the higher timeframe trend and rated by a quality score. The indicator does not open trades. It is a visual and analysis to
Advanced Volume Profile Analysis Tool for MetaTrader 5 The Kecia Volume Profile Order Finder provides traders with volume profile analysis capabilities. This MT5 indicator combines volume profile visualization with statistical calculations to help identify potential trading opportunities and suggests entry, stop loss, and take profit levels based on market structure. Market Profile Visualization Transform your chart with customizable volume profile visualizations: Multiple visualization options
- All of my indicators are just 30$ !! Limited offer. Contact me for extra bonus   indicator, instruction or any questions! - Lifetime update free - Non-repaint - Plus Free Filtering Indicator  - Related product: Gann Gold EA - I just sell my products in Elif Kaya Profile, any other websites are stolen old versions, So no any new updates or support. Advantages of  M1 Scalper Pro  Profitability: M1 Scalper Pro is highly profitable with a strict exit strategy. Frequent Opportunities: M1 Scalper
Haven Fibonacci Volume Profiles — Ваш Автоматический Аналитик Рыночных Диапазонов Представляем Haven Fibonacci Volume Profiles — мощный инструмент, который выводит анализ рынка на новый уровень. Этот индикатор автоматически определяет ключевые ценовые диапазоны, построенные по значимым точкам разворота (пивотам), и накладывает на каждый из них детализированный Профиль Объема вместе с уровнями Фибоначчи. Это позволяет трейдерам мгновенно видеть, где сосредоточена ликвидность и где находятся истин
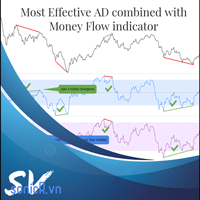
The Accumulation / Distribution is an indicator which was essentially designed to measure underlying supply and demand. It accomplishes this by trying to determine whether traders are actually accumulating (buying) or distributing (selling). This indicator should be more accurate than other default MT5 AD indicator for measuring buy/sell pressure by volume, identifying trend change through divergence and calculating Accumulation/Distribution (A/D) level. Application: - Buy/sell pressure: above
Supply demand arrows
Smaylle Rafael Coelho Mariano
The   "Supply Demand Arrows"   indicator for MetaTrader 5 (MT5) is a powerful trading tool designed to help traders identify critical supply and demand zones in the market. By visually marking these zones with arrows, the indicator enhances trading precision and decision-making. Key Features Identification of Supply and Demand Zones : The indicator effectively highlights key supply and demand zones on the price chart, allowing traders to see where significant buying or selling pressure exists. T
FREE
Индикатор позволяет анализировать дельты тиковых объемов. Он отслеживает тики вверх и вниз и подсчитывает на их основе тиковые объемы для покупок и продаж (раздельно), а также их разницу. Кроме того, он выводит объемы в разбивке по кластерам (ячейкам) цен внутри указанного периода баров. Этот индикатор аналогичен VolumeDeltaMT5 (тот использует почти такие же алгоритмы, но не обрабатывает тики и потому не может применяться на M1). Именно поэтому был создан VolumeDeltaM1. С другой стороны, VolumeD
Flow Architect Lite - Professional Market Structure Toolkit Free Version Features: Core Structure Analysis: Daily VWAP Engine   - Volume-weighted average price for institutional level tracking Standard Deviation Bands (SD1)   - Dynamic support and resistance zones Break of Structure Detection   - Visual markers for market structure shifts Fair Value Gap Identification   - Highlighted imbalance zones on your charts ATR Volatility Context   - Real-time Average True Range measurement Clean Informat
Time and Sales Tick
Pablo Filipe Soares De Almeida
Time & Sales Tick Indicator — это индикатор для MetaTrader 5, который отображает информацию о тиках в режиме реального времени. Он показывает цену, объем тиков и время на графике, помогая анализировать активность рынка. Функциональные возможности Отображает данные тиков, включая цену, объем и время, в панели на графике. Группирует тики по заданным пользователем интервалам, используя цветовое кодирование (зеленый — рост, красный — падение). Панель можно разместить в любом углу графика, регулируя
RSI Currency Strength Meter is a powerful and elegant multi-currency indicator that measures the real-time relative strength of the 8 major currencies using RSI logic. By calculating the smoothed performance of each currency across its major pairs and applying the RSI formula, it delivers clean and responsive strength lines that make it easy to spot which currencies are truly strong or weak at any moment. This indicator is particularly useful for visualizing currency correlations and divergence
QuantMatrix Volume Depth is a MetaTrader 5 indicator for visual analysis of market activity across different price levels. The indicator builds a horizontal profile across the analyzed price range and shows where trading activity has been concentrated. It displays the Point of Control, Value Area High, Value Area Low and the distribution of activity across multiple price levels. The indicator can use real volume when it is available from the symbol. When real volume is not available, tick vol
Trading Utility for Forex Currency Pairs Only not for Gold  Functions Auto Lot Calculation based on Risk Auto stoploss  Auto TakeProfit Breakeven Auto Close Half % Close in percentage with respect to the PIPs Pending Orders BuyLimit Sell Limit with distances BuyStop Sell Stop    with distances Trading Informations Risk in percentage For Multiple trades Combine Takeprofit and Combine Stoplosses
Volume Profile VPVR For MT5 Volume Profile VPVR is a powerful, high-performance MetaTrader 5 indicator designed to replicate the advanced  Volume Profile (Visible Range) directly on your chart. It provides deep insight into market structure by visualizing where trading activity is concentrated, helping traders identify key price levels with precision. This indicator dynamically analyzes volume distribution across price levels and renders a detailed histogram directly on the chart, allowing you
С этим продуктом покупают
Trend Sniper X
Sarvarbek Abduvoxobov
4.86 (44)
Trend Sniper X — это трендовый индикатор для MetaTrader 5, работающий на нескольких таймфреймах, который помогает трейдерам точно и ясно определять направление тренда и потенциальные точки разворота. для MT4: https://www.mql5.com/en/market/product/193245 Информация о цене: Текущая цена является промо-ценой и может измениться по мере выхода предстоящих обновлений и новых функций. Бонусное предложение: Чтобы получить БЕСПЛАТНЫЙ авто-трейд советник Assistant EA для этого индикатора, пожалуйста, на
Новый король в городе — Индикатор + управление ордерами (TP1 + TP2 + TP3) + опциональный Telegram-сигнал-сендер ВКЛЮЧЁН (БЕСПЛАТНО) (ПОЛНОЦЕННАЯ ТОРГОВАЯ И СИГНАЛЬНАЯ СИСТЕМА) Gold Slayer EA Этот индикатор включает в себя продвинутую стратегию, торговую систему с настраиваемым управлением ордерами и систему mean reversion, которая сочетает расширения Envelope и поддерживается несколькими интеллектуальными фильтрами подтверждения, такими как RSI, для поиска высоковероятных точек разворота с сигн
Smart Trend Trading System — MetaTrader 5 После покупки напишите мне на MQL5, чтобы БЕСПЛАТНО получить Smart Universal Expert Advisor, а также доступ к онлайн-курсу, руководство в формате PDF и доступ к закрытой группе. STTS объединяет направление тренда, сигналы входа и выхода, зоны разворота и важные ценовые уровни прямо на графике. Торгуйте по системе вручную или подключите отдельный совместимый советник для автоматического исполнения с выбранными вами настройками. ОДНА СИСТЕМА. ЧЕТЫРЕ ТОРГОВ
Entry Points Pro показывает, где входить, где ставить стоп и каким лотом торговать — до того, как вы поставите ордер. ЦЕНА Сейчас 199 USD: 10 копий по этой цене, затем 249 USD. Финальная цена — 349 USD. Я зарабатываю торговлей на рынке и показываю это, поэтому мне не нужно продавать этот индикатор всем подряд. Это инструмент для трейдеров, которые думают своей головой, а не волшебная кнопка. Нет пробоя — нет сделки. Серая стрелка — отменённый сигнал: цена не пробила сигнальную свечу, значит,
ULTRA - это технический индикатор, который который работает по принципу “Все включено” - самостоятельно анализирует рынок, дает торговые сигналы, показывает уровни для установки стоп лосс, а также подсказывает когда нужно закрывать сделки, чтобы получить профит или минимизировать убыток. То есть, не важно, что ты не умеешь анализировать рынок, определять уровни - где поставить SL или плохо совладаешь с мани-менеджментом. ULTRA все это сделает вместо тебя! БОНУС ДЛЯ ПОКУПАТЕЛЯ : После покупки ULT
Gann Made Easy   - это профессиональная, но при этом очень простая в применении Форекс система, основанная на лучших принципах торговли по методам господина У.Д. Ганна. Индикатор дает точные BUY/SELL сигналы, включающие в себя уровни Stop Loss и Take Profit. ПОЖАЛУЙСТА, СВЯЖИТЕСЬ СО МНОЙ ПОСЛЕ ПОКУПКИ, ЧТОБЫ ПОЛУЧИТЬ ТОРГОВЫЕ ИНСТРУКЦИИ И ОТЛИЧНЫЕ ДОПОЛНИТЕЛЬНЫЕ ИНДИКАТОРЫ БЕСПЛАТНО! Вероятно вы уже не раз слышали о торговли по методам Ганна. Как правило теория Ганна отпугивает от себя не только
SuperScalp Pro
Van Minh Nguyen
4.54 (37)
SuperScalp Pro - Professional Multi-Layer Confluence Scalping System SuperScalp Pro — это продвинутый индикатор для скальпинга, который расширяет возможности классического Supertrend с помощью нескольких интеллектуальных фильтров подтверждения. Он помогает выявлять торговые возможности Buy/Sell с более высокой вероятностью успеха и значительно сокращать количество ложных сигналов. Чёткие стрелки Buy и Sell отображаются непосредственно на графике вместе с автоматически рассчитываемыми в реальном
Boba Analysis Suite
Trade Ready Solutions LLC
5 (2)
Boba Analysis Suite Boba Analysis Suite — аналитический индикатор для MetaTrader 5. Он объединяет структуру рынка, значимые ценовые зоны и общий рыночный контекст в одном представлении на графике. Индикатор разработан на основе практического опыта трейдера и наставника по трейдингу. Он помогает выстроить последовательный процесс анализа: оценивать направление рынка, определять важные уровни и рассматривать несколько таймфреймов в совокупности. Анализ с учётом контекста Значение отдельных сигнало
Следующее обновление — версия 2.52 уже скоро! [НОВОЕ] Приготовьтесь к 4 новым важным функциям, призванным улучшить ваш анализ рынка и торговый процесс. Мы выводим анализ рынка на новый уровень с помощью 4 новых функций, разработанных с учётом ваших потребностей в трейдинге. Представляем: 1. TRADE OVERVIEW DASHBOARD 2. CONFLUENCE AT ZONE 3. STRONG & WEAK HIGH/LOW 4. OTE 1. TRADE OVERVIEW DASHBOARD Панель, которая помогает легче понимать общую картину рынка, предоставляя рекомендации для поддержк
FX Power: Анализируйте силу валют для более эффективной торговли Обзор FX Power — это ваш незаменимый инструмент для понимания реальной силы валют и золота в любых рыночных условиях. Определяя сильные валюты для покупки и слабые для продажи, FX Power упрощает принятие торговых решений и выявляет высоковероятные возможности. Независимо от того, хотите ли вы следовать за трендами или предсказывать развороты с использованием экстремальных значений дельты, этот инструмент идеально адаптируется под
M1 SNIPER   — это простая в использовании торговая система. Это стрелочный индикатор, разработанный для тайм фрейма M1. Индикатор можно использовать как отдельную систему для скальпинга на тайм фрейме M1, а также как часть вашей существующей торговой системы. Хотя эта торговая система была разработана специально для торговли на M1, ее можно использовать и с другими тайм фреймами. Первоначально я разработал этот метод для торговли XAUUSD и BTCUSD. Но я считаю этот метод полезным и для торговли на
FiboSniper Pro – Multi-Filter Fibonacci System with Auto SL/TP and Control Panel FiboSniper Pro — это технический индикатор, который объединяет динамические Fibonacci Envelopes с несколькими фильтрами подтверждения для формирования отборных сигналов Buy и Sell. Уровни Fibonacci рассчитываются на основе Moving Average и ATR, а затем фильтруются с помощью ADX, EMA, RSI, ATR, Volume, Time и структуры свечи. Индикатор отображает на графике автоматические уровни Stop Loss и Take Profit на основе ATR,
Auto Optimized SpeedAngle — это система векторизации импульса институционального уровня, которая исключает подгонку под исторические данные (curve-fitting) за счет непрерывной форвард-оптимизации (Walk-Forward Optimization, WFO). Вместо того чтобы полагаться на статические входные параметры, которые теряют эффективность при смене рыночных режимов, индикатор динамически перекалибрует свои настройки, используя валидацию на вневыборочных данных (Out-of-Sample, OOS). Это гарантирует, что отображаемы
Sqn Max Indicator Sqn Max is an exclusive indicator to trade the market with high effectiveness. The indicator is based on price action, volatility and trend. This indicator is as simple as possible but not too simple. The indicator can generate alerts to ease the trading process. You don't have to stay all day in front of your screen. The indicator can be used with any class of assets and with any time frame. It is possible to achieve better results trading our list of selected assets. We achi
SIO Oscillator: самооптимизирующийся осциллятор дисбаланса семивариаций Купите индикатор и получите советник (EA) на его основе БЕСПЛАТНО. Большинство осцилляторов воспринимают любое движение цены одинаково. SIO разделяет давление покупателей и продавцов и измеряет дисбаланс между ними, показывая, какая сторона действительно контролирует рынок. Когда дисбаланс достигает экстремума, SIO выдаёт чёткий сигнал с уровнями входа, Stop Loss и Take Profit. Главное отличие SIO в том, что он не полагается
Power Candles V3 — самооптимизирующийся индикатор силы Power Candles V3 преобразует силу валюты и инструмента в готовый к использованию торговый план на каждом графике, к которому он прикреплен. Вместо того, чтобы просто раскрашивать свечи, он выполняет автоматическую оптимизацию в режиме реального времени в фоновом режиме и предоставляет вам оптимальные значения Stop Loss, Take Profit и порог сигнала для выбранного вами символа. Один клик — и все готово для реальной торговли: на графике появляю
Astral Structure Оцените сетап. Посмотрите его первоначальный план. Специальная цена запуска - $99. $149 после запуска. Структурный сетап ставит сразу несколько вопросов: согласуется ли общая картина, где находится ориентир стопа и как определены цели? Astral Structure объединяет эти вопросы в одном рабочем пространстве для трейдеров, самостоятельно принимающих решения на основе структуры рынка. Сосредоточьтесь на актуальном сетапе. Рассматривайте последний подходящий сетап, его направление и кв
Crystal Heikin Ashi Signals—Professional Trend & Signal Detection Indicator Advanced Heikin Ashi Visualization with Intelligent Signal System for Manual & Automated Trading Final Price: $149 ---------> Price goes up $10 after every 10 sales . Limited slots available — act fast . Overview User Guide PDF Crystal Heikin Ashi Signals is a professional-grade MetaTrader 5 indicator that combines pure Heikin Ashi candle visualization with an advanced momentum-shift detection system. Designed for both m
Trend Catcher   анализирует движения рыночных цен, используя комбинацию собственных и индивидуально разработанных адаптивных индикаторов анализа тренда. Он определяет истинное направление рынка, отфильтровывая краткосрочные шумы и фокусируясь на силе импульса, расширении волатильности и поведении ценовой структуры. Он также использует комбинацию сглаживающих и фильтрующих тренд индикаторов, таких как скользящие средние, RSI и фильтры волатильности. Мониторинг реальных операций, а также другие
Мультивалютный индикатор силы и импульса MT5 Dynamic Forex28 Navigator — развитие наших давно популярных индикаторов, объединяющее силу пяти в одном: Advanced Currency Strength28 Indicator (700 отзывов) Advanced Currency IMPULSE with ALERT (530 отзывов) Currency Strength EXOTICS GOLD Impulse with Alert CS28 Combo Signals (текущий бонус) Не нужно покупать четыре индикатора и ставить их на графики. Всё объединено в одном мощном индикаторе: сила 28 пар Forex, импульс рынка, который их ведёт, и опов
Scalper Vault — это мощная, полноценная торговая система, созданная для трейдеров, которые стремятся к стабильным результатам в внутридневной торговле. Этот высокоточный индикатор представляет собой комплексное, самостоятельное торговое решение, обеспечивающее аналитику профессионального (институционального) уровня как для торговли на рынке Forex, так и для работы с бинарными опционами. Пожалуйста, свяжитесь со мной после покупки, чтобы получить мои торговые советы, а также отличный бонус! Исклю
Один и тот же график, один и тот же порядок чтения — каждый день. Структура, ближайшая зона, положение в диапазоне и сторона тренда — на экране сразу и всегда в одном виде. БОНУС ПОКУПАТЕЛЮ — SMC Nexus Scanner Pro. Многосимвольный сканер на данных этого индикатора: одна панель показывает сторону тренда, активные ордер-блоки и BOS / CHoCH сразу по многим символам. Без доплаты — после покупки напишите мне в личные сообщения на MQL5, и я его пришлю. Пятнадцать слоёв под одной панелью: структура ры
Azimuth Pro
Ottaviano De Cicco
5 (7)
Azimuth Pro V2: Синтетический фрактальный структурный анализ и подтверждённые входы для MT5 Обзор Azimuth Pro — многоуровневый индикатор свинговой структуры от Merkava Labs . Четыре вложенных уровня свингов, привязанный к свингам VWAP, определение ABC-паттернов, трёхтаймфреймная структурная фильтрация и подтверждённые входы на закрытой свече — один график, один рабочий процесс от микро-свингов до макро-циклов. Это не слепой сигнальный продукт. Это рабочий процесс, основанный на структуре, для т
Neuro Poseidon - новый индикатор от Дарьи Резуевой. Он сочетает точные торговые сигналы с адаптивными уровнями TP/SL , в результате создавая максимально выгодные сделки! TO SWITCH TO   ENG   PLEASE CHOOSE IT IN THE UPPER-RIGHT CORNER OF THE WEBSITE Напишите мне и получите  Neuro Poseidon Assistant  в подарок для автоматизации вашей торговли! Что отличает его от других индикаторов? 1. Доказанная прибыльность на всех активах и таймфреймах 2. На графике присутствуют только подтвержденные сигналы н
Adaptive Price Action Engine Купи индикатор — получи советник (EA) к нему бесплатно Самооптимизирующийся мульти-таймфреймовый анализ тренда и свечных моделей Рынок постоянно меняется — и не каждая модель Price Action имеет одинаковую ценность в разных рыночных режимах. Adaptive Price Action Engine создан для адаптации к изменяющимся рыночным условиям, объединяя трендовую структуру, мульти-таймфреймовый анализ, свечные модели и статистическую оптимизацию в единой аналитической системе. Два адапти
FX Trend NG: Следующее поколение интеллектуального анализа трендов на разных рынках Обзор FX Trend NG — это профессиональный инструмент анализа трендов и мониторинга рынка с поддержкой нескольких таймфреймов. Он позволяет за секунды получить полное структурное понимание текущего состояния рынка. Вместо переключения между десятками графиков вы мгновенно видите, какие инструменты находятся в тренде, где импульс ослабевает и где наблюдается сильная синхронизация между таймфреймами. Специальное пр
Свинг-трейдинг - это первый индикатор, предназначенный для обнаружения колебаний в направлении тренда и возможных разворотов. Он использует базовый подход свинговой торговли, широко описанный в торговой литературе. Индикатор изучает несколько векторов цен и времени для отслеживания направления совокупного тренда и выявляет ситуации, когда рынок перепродан или перекуплен и готов к исправлению. [ Руководство по установке | Руководство по обновлению | Устранение неполадок | FAQ | Все продукты ] П
FX Volume MT5
Daniel Stein
4.79 (24)
FX Volume: Оцените подлинную динамику рынка глазами брокера Краткий обзор Хотите вывести свою торговлю на новый уровень? FX Volume дает вам информацию в реальном времени о том, как розничные трейдеры и брокеры распределяют свои позиции — задолго до появления запаздывающих отчетов типа COT. Независимо от того, стремитесь ли вы к стабильной прибыли или ищете дополнительное преимущество на рынке, FX Volume поможет выявлять крупные дисбалансы, подтверждать пробои и совершенствовать управление риск
Advance AI Scanner is a multi-symbol analysis indicator for MetaTrader 5. It scans Forex pairs, metals, energy, stock indices and cryptocurrencies at the same time and rates each instrument with its own self-training model. It explains in plain English what moved each market and why, and it estimates how far upcoming economic news usually moves each symbol, measured on your broker's own price history. $199 instead of $499. 10 copies left at this price. One time purchase  Installation and User
Станьте Breaker Trader и получайте прибыль от изменений структуры рынка по мере изменения цены. Индикатор выключателя блока ордеров определяет, когда тренд или движение цены приближаются к истощению и готовы развернуться. Он предупреждает вас об изменениях в структуре рынка, которые обычно происходят, когда произойдет разворот или серьезный откат. Индикатор использует собственный расчет, который определяет прорывы и ценовой импульс. Каждый раз, когда новый максимум формируется около возможной
Другие продукты этого автора
Yearly Levels
Kristmundur Roman Zakharii
FREE INDICATOR — PLEASE LEAVE A REVIEW!  Thank you!  Yearly Highs & Lows Pro — Range Extensions automatically displays the previous year’s high, low and midpoint, together with calculated extensions and intermediate levels. These reference levels help traders assess potential support, resistance, congestion, breakouts and retests.  Advanced AI tools had been used for the most accurate programming of this indicator. Main Features Yearly High, Low and Midpoint: The midpoint is calculated as
MACD Platinum
Kristmundur Roman Zakharii
MACD Platinum Pro On-Chart is a multi-timeframe MACD indicator that brings momentum analysis directly onto your price chart.  Advanced AI tools had been used for the most accurate programming of this indicator. Its most distinctive feature is the coloured candle overlay . Instead of looking back and forth between the chart and the MACD window, you can see the relationship between the MACD and signal lines in the colour of the candles themselves. By default, candles are blue when the MACD is abov
Candle Patterns Pro — 42 Candlestick Formations with Historical Research Statistics Candle Patterns Pro is advanced candlestick pattern recognition for MetaTrader, combining 42 detectable formations, historical reversal statistics, individually configurable pattern selection, and customizable chart visualization. Advanced AI tools had been used for the most in-depth and accurate research and programming of this indicator and it would not be exaggeration to say that the latesr version of Candle P
Hurst Channel
Kristmundur Roman Zakharii
HURST CHANNEL PRO  — MTF Trend & Dynamic Support/Resistance Professional Multi-Timeframe Price Channels | Trend Analysis | Pullback Trading | Fully Customizable Hurst Channel Pro is a technical analysis indicator designed to help traders identify market trends, dynamic support and resistance levels, and potential trading opportunities based on price structure. Inspired by the traditional Hurst Channel concept, this enhanced version combines two independently configurable price channels with mul
MTF Kijun
Kristmundur Roman Zakharii
4 (1)
FREE INDICATOR — PLEASE LEAVE A REVIEW!  Thank you!  MTF Kijun Pro is a multi-timeframe Ichimoku indicator that displays Kijun-sen lines from different timeframes directly on a single chart.  Advanced AI tools had been used for the most accurate programming of this indicator. Plot up to 6 independent Kijun-sen lines simultaneously , each with its own timeframe, colour, width, style and shift settings. Main Features: Multiple Timeframes: Choose M5, M15, M30, H1, H4, D1, W1 or MN1 using
Master Candle
Kristmundur Roman Zakharii
Master Candle Pro is a customizable price-action indicator that automatically identifies Master Candles (Mother Candles), consolidation formations, and selected breakout and reversal patterns. The indicator combines traditional Master Candle analysis with Body-Only detection, Fakey (Hikkake) patterns, Inside Pin Bars, Fakey Pin formations, and narrow-range compression analysis. Developed with the assistance of Claude Opus AI, this updated version introduces expanded pattern recognition, additio
Этот инструмент упрощает отслеживание объема, сопровождающего ценовые движения. Он разделяет тиковый объем на «бычий» и «медвежий» и отображает их с помощью двух отдельных скользящих средних. Теперь любой трейдер может легко отслеживать соотношение объема и цены. Это позволит вам действовать синхронно с маркетмейкерами и участниками рынка, формирующими ценовое движение. Объем — не единственный фактор, влияющий на цену, но он играет важную роль, а значит, обладает прогностической ценностью. Преоб
Volume Tracker
Kristmundur Roman Zakharii
Volume you can trust - backtested, on every candle ICFX Volume Tracker turns tick volume into something you can trade: every candle is coloured by how unusual its volume is, and every signal comes with the percentage of times it actually worked in 23 years of history. Most volume indicators show bars and leave the guessing to you. Volume Tracker only shows volume signals that passed a strict backtest (2003-2026, 6 major USD pairs, 6 USD exotics and Brent crude), tells you in plain language what
EURUSD SEASONALITY SUITE 27 Years of EUR/USD History. Seasonal Projections. London Fix Research. Historical Probability Analysis. The complete EUR/USD seasonality toolkit, with 27 years of real EUR/USD history built in, forward-looking seasonal projections, London fix and calendar research, and percentages measured directly from historical EUR/USD prices. EURUSD Seasonality Suite shows you directly on your chart how EUR/USD has historically behaved at this time of year, during this week of the
Candle Patterns Suite  — 42 Candlestick Formations with Historical Research Statistics Candle Patterns Suite  is advanced candlestick pattern recognition for MetaTrader, combining 42 detectable formations, historical reversal statistics, individually configurable pattern selection, and customizable chart visualization. Advanced AI tools had been used for the most in-depth and accurate research and programming of this indicator and it would not be exaggeration to say that the latesr version of Ca
Master Candle Mt5
Kristmundur Roman Zakharii
Master Candle Pro is a customizable price-action indicator that automatically identifies Master Candles (Mother Candles), consolidation formations, and selected breakout and reversal patterns. The indicator combines traditional Master Candle analysis with Body-Only detection, Fakey (Hikkake) patterns, Inside Pin Bars, Fakey Pin formations, and narrow-range compression analysis. Developed with the assistance of Claude Opus AI, this updated version introduces expanded pattern recognition, additio
MTF Kijun Mt5
Kristmundur Roman Zakharii
FREE INDICATOR — PLEASE LEAVE A REVIEW!  Thank you!  MTF Kijun Pro is a multi-timeframe Ichimoku indicator that displays Kijun-sen lines from different timeframes directly on a single chart.  Advanced AI tools had been used for the most accurate programming of this indicator. Plot up to 6 independent Kijun-sen lines simultaneously , each with its own timeframe, colour, width, style and shift settings. Main Features: Multiple Timeframes: Choose M5, M15, M30, H1, H4, D1, W1 or MN1 using co
Volume Tracker Pro
Kristmundur Roman Zakharii
Volume you can trust - backtested, on every candle ICFX Volume Tracker turns tick volume into something you can trade: every candle is coloured by how unusual its volume is, and every signal comes with the percentage of times it actually worked in 23 years of history. Most volume indicators show bars and leave the guessing to you. Volume Tracker only shows volume signals that passed a strict backtest (2003-2026, 6 major USD pairs, 6 USD exotics and Brent crude), tells you in plain language what
Фильтр:
Нет отзывов
Ответ на отзыв