MP Screener for MT4

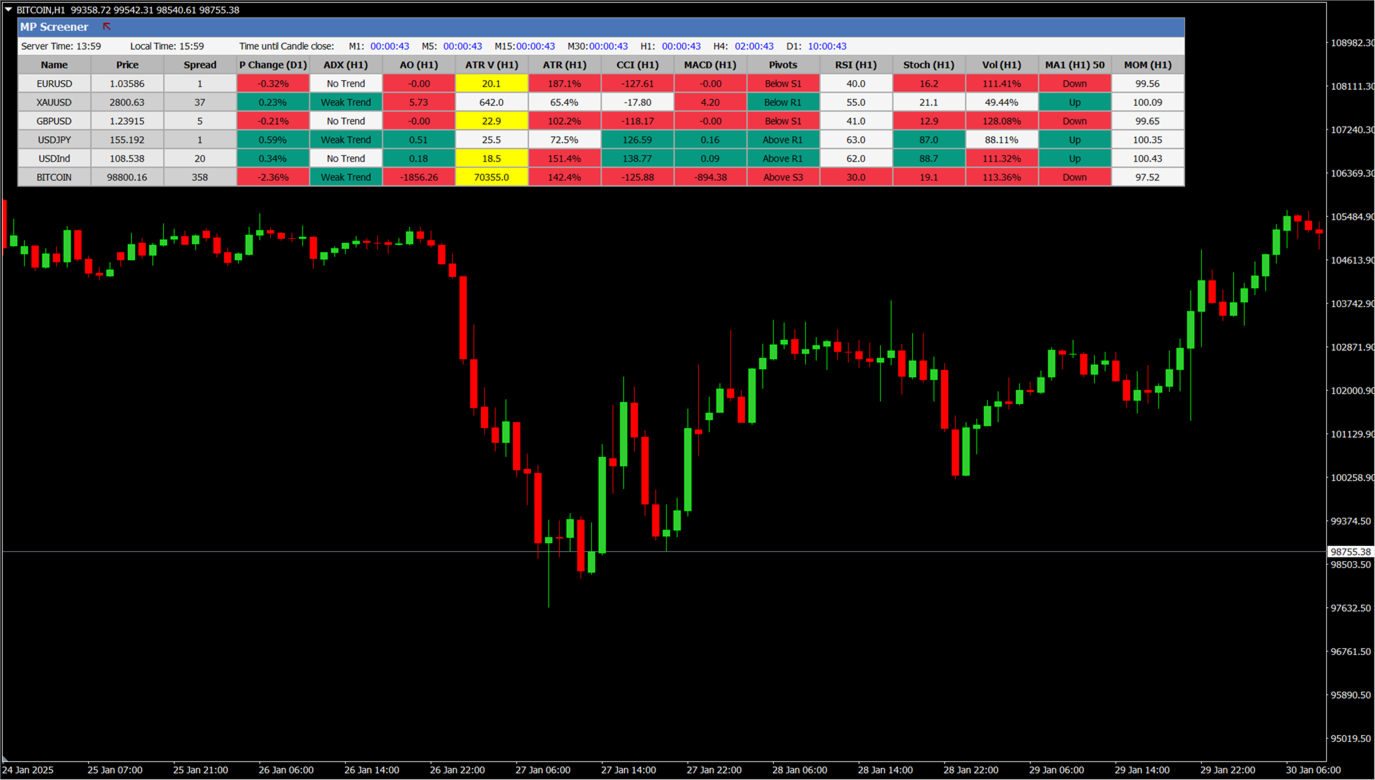
The MP Screener is a powerful and user-friendly tool designed for traders who need to filter and analyze multiple symbols based on various technical criteria. Whether you are a scalper, day trader, or swing trader, this screener helps you quickly identify the best trading opportunities in the market by scanning multiple timeframes and indicators in real time.

With the MP Screener, traders can streamline their market analysis, making it easier to focus on profitable setups while saving time. Unlike traditional methods of scanning charts manually, this tool automates the process, allowing you to monitor multiple symbols simultaneously without missing any potential trades. The screener's flexibility and customization options cater to traders of all experience levels, ensuring that each user can adapt it to their unique trading style and strategy.

Key Features:

  • Multi-Timeframe Analysis: Scan multiple timeframes to get a broader view of market trends.
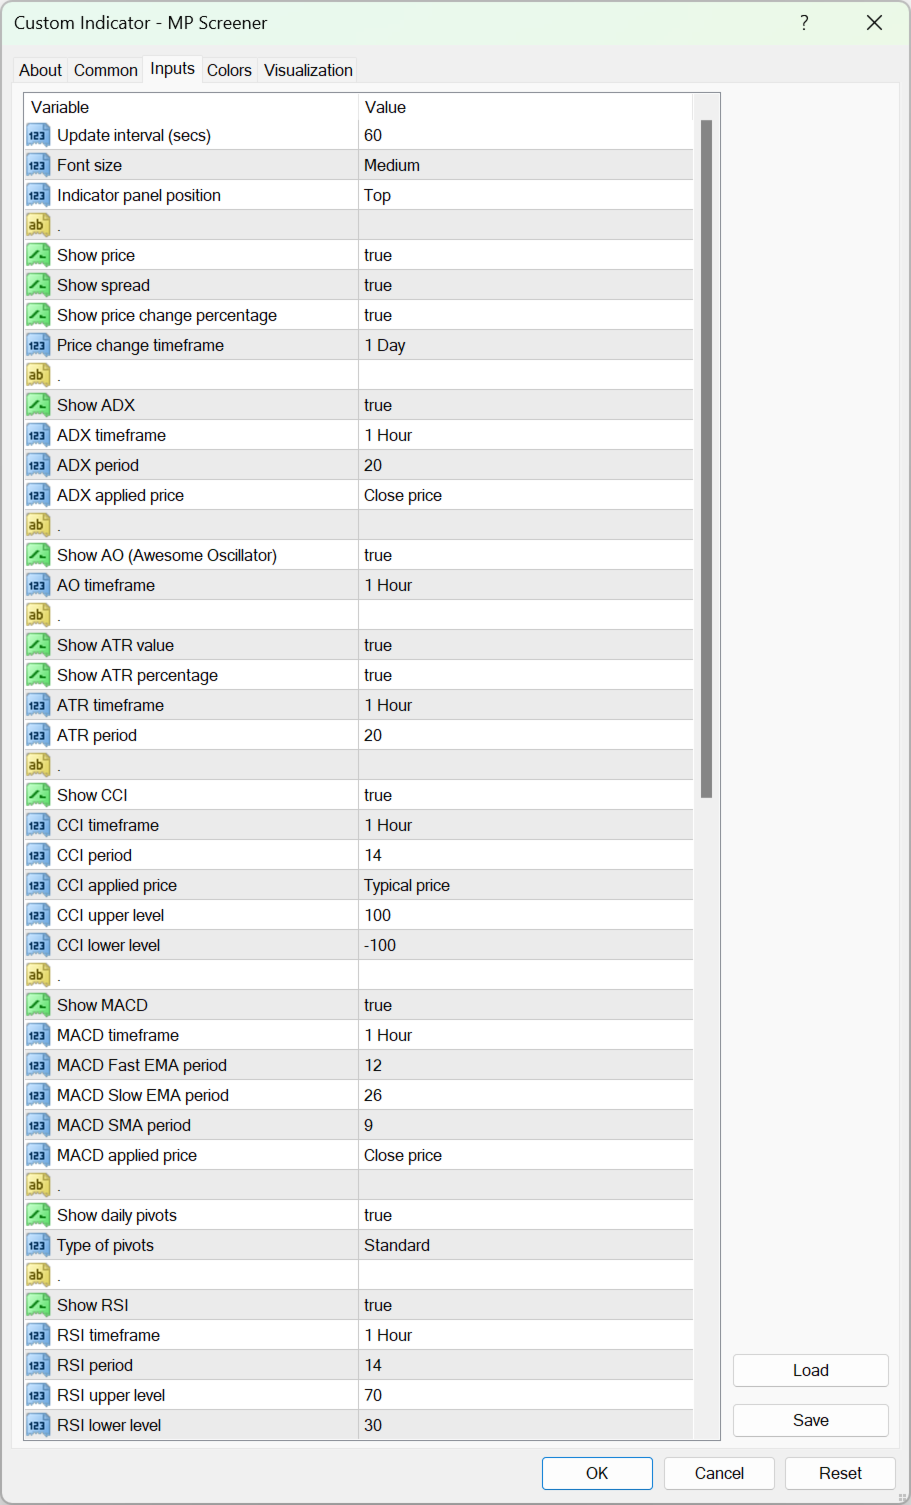
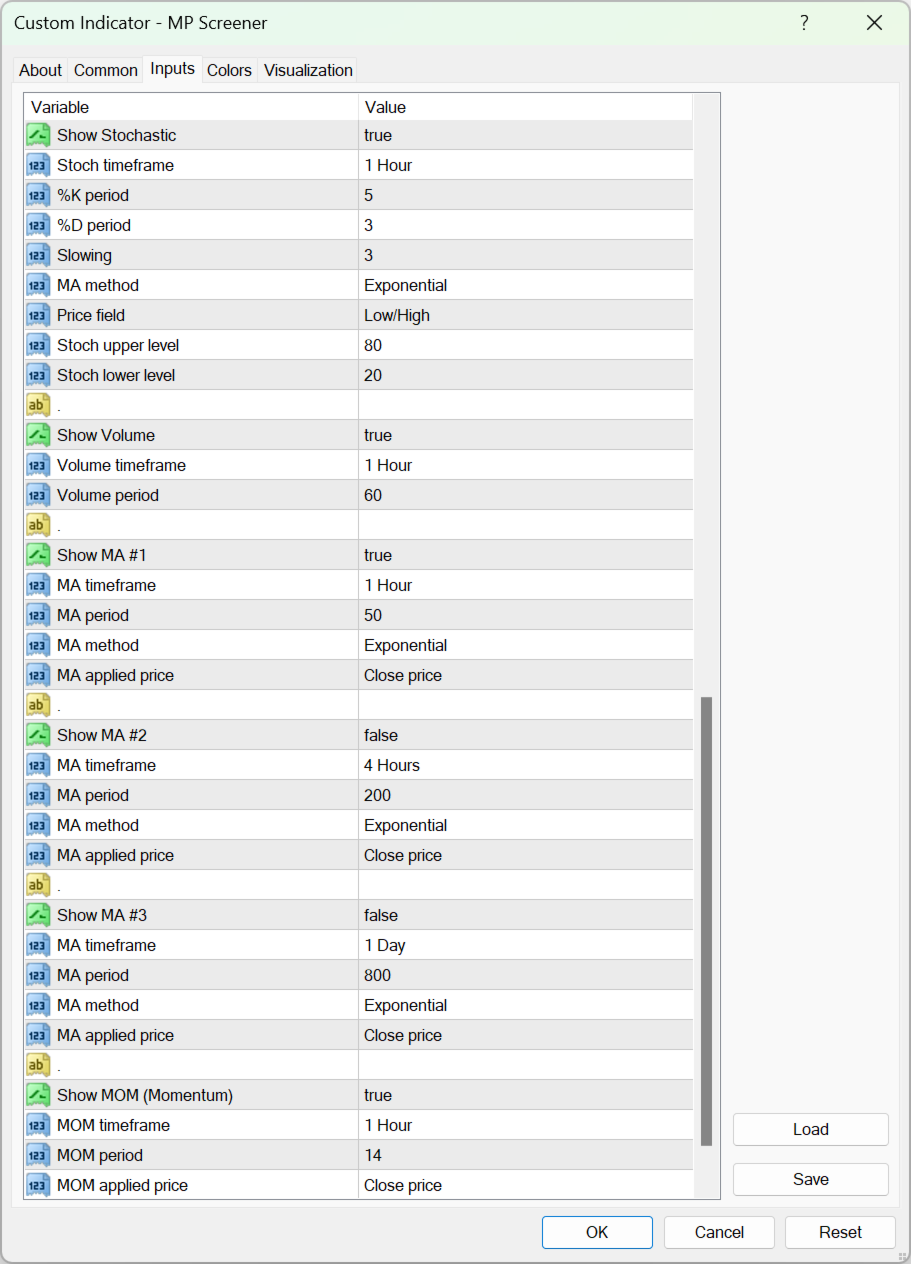
  • Customizable Filters: Apply various technical indicators such as Moving Averages, RSI, MACD, ATR, and more.
  • User-Friendly Interface: Simple and intuitive design that allows traders to configure and filter results efficiently.
  • Custom Update Intervals: Ensures that the latest market data is always available.

Usage:

  1. Add symbols you want to monitor in the Market Watch.
  2. Choose your preferred technical indicators and set their parameters.
  3. Select the timeframes you want to scan for each one.
  4. The screener will display the results in an organized table.

___________________________________________________________________________________

Disclaimer:
Do NOT trade or invest based upon the analysis presented on this channel. Always do your own research and due diligence before investing or trading. I’ll never tell you what to do with your capital, trades or investments. I’ll also never recommend for you to buy, sell, long or short any asset, commodity, security, derivative or cryptocurrency related instrument as it's extremely HIGH RISK! You should always consult with a professional/licensed financial adviser before trading or investing in any type of assets.

Рекомендуем также
Limitless MT4    - это универсальный индикатор который подойдет каждому как начинающему так и опытному трейдеру работает на всех валютных парах криптовалютах сыре акциях Limitless MT4 - уже настроен и не требует дополнительной настройки   А теперь главное Почему    Limitless MT4 ? 1 полное отсутствие перерисовки  2 два года тестирования лучшими специалистами в трейдинге 3 точность правильных сигналов превышает 80% 4 хорошо показал себя в торговле во время выхода новостей Правила торговли  1 сигн
Alpha Trend sign - это мой давний и очень популярный торговый инструмент, который проверяет нашу торговую систему и четко сигнализирует о транзакциях, которые не дрейфуют.   Основные функции:   • В зависимости от того, показывает ли рынок активную область, показатели могут быть очень интуитивными, чтобы определить, является ли текущая конъюнктура трендовой или шоковой.   И в соответствии с индикатором стрелка врезается на рынок, зеленая стрела подсказывает купить, красная стрела подсказывает
Supply and Demand Monster MT4
Tsog Erdene Borjigon Enkhkhudulmur
Supply and demand zones are at the heart of   supply and demand trading . These zones are areas that show  liquidity at a specific price.  The supply zone is also called the distribution zone, while the demand zone is called the accumulation zone.   Our indicator automatically draw supply and demand zones in Metatrader 5. It give opportunity to understand trading zone and avoiding risk.
SimSim Arrow Momentum стандартный "Momentum" индикатор, но стрелочной версии. Версия для MetaTrader 5 Параметры индикатора аналогичны стандартным, плюс один дополнительный параметр   Delta . Delta    = 0 - 100  Deviations as of the 100 value. Изменение уровня 100 индикатора, Возможны плюс и минус. Индикатор формирует сигнал когда цена пересекает линию уровня = 100 +- Delta. Включите для работы "CONTROL DEAL" и сделки по сигналу индикатора, будут открыты автоматически. Вы можете использовать
Индикатор BarsOldTimeFrame предназначен для анализа процесса формирования баров на старшем таймфрейме, проецируя с него бары на текущий таймфрейм. Индикатор отрисовывает бары старшего таймфрейма на текущем графике в виде прямоугольников в которых тело свечи старшего таймфрейма закрашено, тени прозрачные. В настойках выбирается старший таймфрейм и цвета заливки для тел бычьих и медвежьих баров. 
NostradamusMT4
Andrey Spiridonov
1 (1)
NostradamusMT4 - мощный индикатор из набора профессионального трейдера. В основе индикатора лежит авторский метод Андрея Спиридонова расчета цены (ESTIMATED PRICE) для текущей цены свечи. Преимущества Индикатор не перерисовывается; Работает на любых временных интервалах; Работает с любыми торговыми инструментами; Отлично подходит для скальпинга и торговли бинарными опционами. Параметры Color - цвет линии ESTIMATED PRICE FUTURE . Порядок работы с индикатором Индикатор формирует расчетную цену
Индикатор Binary SF для бинарных опционов разработан для торговой платформы MetaTrader 4 и предоставляет сигналы без перерисовки, что делает его надежным инструментом для трейдеров. Он подходит для любого таймфрейма (от M1 до дневных) и используется преимущественно для торговли по тренду, помогая трейдерам определить подходящие точки входа для краткосрочных и среднесрочных сделок. Принцип работы и сигналы Индикатор анализирует рынок и подает сигнал в виде стрелок (вверх для покупок и вниз для п
EZZ Elite Zig Zag is an indicator for the MetaTrader 4 terminal. This indicator traces the peak of the trend based on the market reversal, thus showing various opportunities in the financial market. EZZ Elite Zig Zag is a visual tool, intuitive, and easy to understand and use.  Test it Yourself by Downloading it for Free. Author Paulo Rocha all rights reserved
El indicador "MR BEAST ALERTAS DE LIQUIDEZ" es una herramienta avanzada diseñada para proporcionar señales y alertas sobre la liquidez del mercado basándose en una serie de indicadores técnicos y análisis de tendencias. Ideal para traders que buscan oportunidades de trading en función de la dinámica de precios y los niveles de volatilidad, este indicador ofrece una visualización clara y detallada en la ventana del gráfico de MetaTrader. Características Principales: Canal ATR Adaptativo: Calcula
It will be the best tool for you to make a profit! Through unique algorithms You're going to see an amazing amount of right trading signals Make huge profits every day and realize more possibilities!   Like the car no money to buy it, the love of the girls dare not to pursue?Or the credit card bill is not paid, the rent does not have the extra money to settle?Or are you fed up with being bossed around by your boss and Hope to get more people's respect?Can't afford to buy the things you want ? wa
Индикатор с инновационным алгоритмом определения направления тренда. Показывает лучшие результаты определения тренда на любых валютных парах, акциях, криптовалюте без перерисовки результата. Поможет сразу определить прибыльность текущей пары и таймфрейма. Использует паттерны Price action в связке с авторским уникальным алгоритмом. Подходит как новичкам так и профессионалам для всех видов торговли. Как выбрать прибыльный таймфрейм и оптимизировать индикатор под валютную пару. Особенности Новейший
The Super Arrow Indicator provides non-repainting buy and sell signals with exceptional accuracy. Key Features No repainting – confirmed signals remain fixed Clear visual arrows: green for buy, red for sell Real-time alerts via pop-up, sound, and optional email Clean chart view with no unnecessary clutter Works on all markets: Forex, gold, oil, indices, crypto Adjustable Parameters TimeFrame Default: "current time frame" Function: Sets the time frame for indicator calculation Options: Can be set
Представляем       Графики   Quantum Heiken Ashi PRO Свечи Heiken Ashi, разработанные для обеспечения четкого понимания рыночных тенденций, известны своей способностью отфильтровывать шум и устранять ложные сигналы. Попрощайтесь со сбивающими с толку колебаниями цен и познакомьтесь с более плавным и надежным представлением графиков. Что делает Quantum Heiken Ashi PRO действительно уникальным, так это его инновационная формула, которая преобразует данные традиционных свечей в легко читаемые цветн
The Sensitive Volume indicator is an indicator designed to generate trading signals. The purpose of this indicator is to generate signals from the highest probability of trading. Using a number of price movements and a set of indicator properties to generate these signals.  Easy to use, simple and understandable to the user. With alert features, user signals can be reached quickly.  Visually the user can easily recognize the signals. This indicator will not repaint. Parameters Trend_Period - pe
Mars 5     is a powerful indicator of   TREND   for any par and any timeframe. It doesn't requires any additional indicators for the trading setup.The indicator gives clear signals about opening and closing trades.This Indicator is a unique, high quality and affordable trading tool. Perfect For New Traders And Expert Traders Low risk entries. Never repaints signal. Never backpaints signal. Never recalculates signal. For MT4 Only Great For Scalping Great For Swing Trading Arrow Entry Alerts Pop
Устали от построения линий поддержки и сопротивления? Сопротивление поддержки - это мульти-таймфреймовый индикатор, который автоматически обнаруживает и отображает линии поддержки и сопротивления на графике с очень интересным поворотом: поскольку ценовые уровни тестируются с течением времени и его важность возрастает, линии становятся более толстыми и темными. [ Руководство по установке | Руководство по обновлению | Устранение неполадок | FAQ | Все продукты ] Повысьте технический анализ в одноч
The Sextet Scalper Pro  is an MT4 indicator that gives signals when new waves are starting in a trend. The trends are calculated using the original " The Sextet " indicator method. You get a free EA to trade with The Sextet Scalper Pro: Free EA . Default settings were optimized on GBPUSD H1 from 2017. EA could be tested on free demo version of The Sextet Scalper Pro, before purchase. Key Features: Uses The Sextet Trend Detection Method which is already a good strategy in itself for detecting lo
Heiken Ashi candle chart is an improved version of The Japanese candle chart, which can effectively filter the market "noise" of the Japanese candle chart. It is favored by many traders for its simplicity and intuition. For trend traders, the HA candle chart is a magic tool. Unlike the traditional Japanese candle chart, Heikenashi does not reflect the opening price, high price, low price and closing price of the market. Instead, Heikenashi calculates the value of a single K line in the dominant
Market Overview MT4
Mehran Sepah Mansoor
5 (1)
Оптимизируйте свои торговые решения с помощью нашего индикатора силы и настроения рынка и больше не торгуйте против тренда! Тщательно разработанный для серьезных трейдеров, которые ценят точную и своевременную информацию, наш индикатор предоставляет обзор 28 основных пар с высоты птичьего полета в очень простой форме. Этот инструмент способен ранжировать валютные пары по популярности, силе бычьего или медвежьего тренда и проценту покупателей и продавцов / версия MT5 .  Особенности Сила трен
A scalping indicator based on mathematical patterns, which on average gives signals with relatively small SL, and also occasionally helps to catch big moves in the markets (more information in the video) This indicator has three main types of notifications: The first type warns of a possible/upcoming signal on the next bar The second type indicates the presence of a ready signal to enter the market/open a position The third type is for SL and TP levels - you will be notified every time price re
Технический индикатор рассчитывающий свои показания на объемах торгов. В виде гистограммы показывает накопление силы движения торгового инструмента. Имеет независимые системы расчета для бычьего и медвежьего направления. Работает на любых торговых инструментах и тайм-фреймах. Может дополнить любую торговую систему. Индикатор не перерисовывает своих значений, сигналы появляются на текущей свече. Прост в использовании и не загружает график, не  требует производить дополнительные расчеты параметров
Trade Pinbar
Miracle Obinna Okafor
This indicator identifies pinbar candlesticks on the chart and displays an arrow as a trade signal based on the candlestick pattern. It offers user-friendly features, including push notifications and other types of alerts. It is most effective for identifying entry points or potential reversals at premium or discount prices. Additionally, it works on any time frame.
FREE
Этот индикатор предназначен для скальпинга на низких таймфреймах (M1–M15) на волатильных рынках, таких как основные валютные пары (например, EURUSD, GBPUSD). Он генерирует неперерисовывающиеся сигналы на покупку (зеленая стрелка вверх) и продажу (красная стрелка вниз) на основе пересечения экспоненциальных скользящих средних (EMA), подтвержденного импульсом RSI и пересечением MACD, минимизируя ложные сигналы на флетовом рынке. Как использовать: Прикрепите индикатор к графику MT4. Ищите стрелки
Daily Candle Predictor - это индикатор, который предсказывает цену закрытия свечи. Прежде всего индикатор предназначен для использования на графиках D1. Данный индикатор подходит как для традиционной форекс торговли, так и для торговли бинарными опционами. Индикатор может использоваться как самостоятельная торговая система, так может выступать в качестве дополнения к вашей уже имеющейся торговой системе. Данный индикатор производит анализ текущей свечи, рассчитывая определенные факторы силы внут
This   Happy Trend Arrow   indicator is designed for signal trading. This indicator generates trend signals. It uses many algorithms and indicators to generate this signal. It tries to generate signals from the points with the highest trend potential. This indicator is a complete trading product. This indicator does not need any additional indicators. The indicator is never repainted. The point at which the signal is given does not change.       Features and Recommendations Time Frame: H1
Индикатор Supply and Demand Zones - один из лучших инструментов, которые мы когда-либо создавали. Этот замечательный инструмент автоматически рисует зоны спроса и предложения - лучшие места для открытия и закрытия позиций. Он имеет множество дополнительных функций, таких как поддержка зон на нескольких таймфреймах, отображение ширины зон, уведомления об измененных зонах и многое другое. Благодаря фрактальности рынка, этот индикатор можно использовать для любого вида торговли. Не имеет значения,
Индикатор поддержки и сопротивления для бинарных опционов Этот индикатор разработан специально для торговли бинарными опционами и отлично показывает откаты от уровней поддержки и сопротивления. Сигналы появляются на текущей свече. Красная стрелка, направленная вниз, указывает на потенциальную возможность продажи, а синяя стрелка, направленная вверх, предлагает возможности для покупки. Все, что вам нужно настроить, это цвет сигнальных стрелок. Рекомендуется использовать его на таймфреймах M1-M5,
Trend Oscillator — это продвинутый пользовательский индикатор Crypto_Forex, эффективный торговый инструмент! - Используется новый продвинутый метод расчета — 20 вариантов параметра «Цена для расчета». - Самый плавный осциллятор из когда-либо созданных. - Зеленый цвет для восходящих трендов, красный цвет для нисходящих трендов. - Значения перепроданности: ниже 5, значения перекупленности: выше 95. - С этим индикатором есть множество возможностей для модернизации даже стандартных стратегий. - С
sinus wave strong buy sell indicator is nonrepaint top bottom point indicator.it work all pairs and all timeframe.suitable for beginners and experienced traders. it depend to sinus wave and vertex base .gives signal sinus wave over zero or below zero on approppirate vertex positions. cnt number has been set to 500 bars for demo mode. it can be increase to 2000 depend to charts has bar numbers. minimum value is 500.  white points on red vertex spikes means sell. white points on blue vertex spikes
Версия для MetaTrader 5 доступна здесь: https://www.mql5.com/ru/market/product/25794 FFx Pivot SR Suite PRO - это полный набор инструментов для построения уровней поддержки и сопротивления. Поддержка и сопротивление - самые используемые уровни во всех видах торговли. Их можно использовать для поиска разворотов тренда, установки уровней тейк-профита и стоп-лосса и т.д. Индикатор можно полностью настроить непосредственно с графика Выбор из 4 периодов для расчетов: 4-часовой, дневной, недельный и
С этим продуктом покупают
Gann Made Easy - это профессиональная, но при этом очень простая в применении Форекс система, основанная на лучших принципах торговли по методам господина У.Д. Ганна. Индикатор дает точные BUY/SELL сигналы, включающие в себя уровни Stop Loss и Take Profit. Пожалуйста, напишите мне после покупки! Я поделюсь своими рекомендациями по использованию индикатора. Также вас ждет отличный бонусный индикатор и торговый ассистент в подарок! Вероятно вы уже не раз слышали о торговли по методам Ганна. Как пр
M1 Sniper
Oleg Rodin
4.89 (18)
M1 SNIPER — это простая в использовании торговая система. Это стрелочный индикатор, разработанный для тайм фрейма M1. Индикатор можно использовать как отдельную систему для скальпинга на тайм фрейме M1, а также как часть вашей существующей торговой системы. Хотя эта торговая система была разработана специально для торговли на M1, ее можно использовать и с другими тайм фреймами. Первоначально я разработал этот метод для торговли XAUUSD и BTCUSD. Но я считаю этот метод полезным и для торговли на д
Game Changer — это революционный трендовый индикатор, разработанный для использования с любым финансовым инструментом, который превратит ваш MetaTrader в мощный анализатор трендов. Индикатор не перерисовывается и не запаздывает. Он работает на любом таймфрейме и помогает определять тренд, сигнализирует о потенциальных разворотах, служит механизмом трейлинг-стопа и выдает оповещения в режиме реального времени для оперативной реакции рынка. Независимо от того, являетесь ли вы опытным трейдером, пр
Meravith
Ivan Stefanov
5 (1)
Индикатор анализирует объем с каждой точки и рассчитывает уровни истощения рынка для этого объема. Он состоит из трех линий: Линия истощения бычьего объема Линия истощения медвежьего объема Линия, указывающая на тренд рынка. Эта линия меняет цвет в зависимости от того, является ли рынок медвежьим или бычьим. Вы можете анализировать рынок с любой выбранной вами точки. Как только достигнута линия истощения объема, определите новую точку для начала следующего анализа. Можно анализировать что угодно
Инновационный индикатор, использующий эксклюзивный алгоритм для быстрого и точного определения тренда. Индикатор автоматически рассчитывает время открытия и закрытия позиций, а также подробную статистику работы индикатора на заданном отрезке истории, что позволяет выбрать наилучший торговый инструмент для торговли. Вы также можете подключить свои пользовательские стрелочные индикаторы к Scalper Inside Pro для проверки и расчета их статистики и прибыльности. Инструкция и настройки: Читать... Осно
В настоящее время скидка 20%! Лучшее решение для новичка или трейдера-эксперта! Эта приборная панель работает на 28 валютных парах. Он основан на 2 наших основных индикаторах (Advanced Currency Strength 28 и Advanced Currency Impulse). Он дает отличный обзор всего рынка Forex. Он показывает значения Advanced Currency Strength, скорость движения валюты и сигналы для 28 пар Forex на всех (9) таймфреймах. Представьте, как улучшится ваша торговля, когда вы сможете наблюдать за всем рынком с помощ
В НАСТОЯЩЕЕ ВРЕМЯ СКИДКА 20%! Лучшее решение для новичка или трейдера-эксперта! Этот индикатор специализирован для отображения силы валюты для любых символов, таких как экзотические пары, товары, индексы или фьючерсы. Впервые в своем роде, любой символ может быть добавлен в 9-ю строку, чтобы показать истинную силу валюты золота, серебра, нефти, DAX, US30, MXN, TRY, CNH и т.д. Это уникальный, высококачественный и доступный торговый инструмент, потому что мы включили в него ряд собственных функци
Advanced Supply Demand
Bernhard Schweigert
4.91 (296)
Этот индикатор является уникальным, качественным и доступным инструментом для торговли, включающим в себя наши собственные разработки и новую формулу. В обновленной версии появилась возможность отображать зоны двух таймфреймов. Это означает, что вам будут доступны зоны не только на старшем ТФ, а сразу с двух таймфреймов - таймфрейма графика и старшего: отображение вложенных зон. Обновление обязательно понравится всем трейдерам, торгующим по зонам спроса и предложения. Важная информация Для макс
Trend indicator AI
Ramil Minniakhmetov
5 (74)
Индикатор Trend Ai - отличный инструмент, который улучшит анализ рынка трейдером, сочетая идентификацию тренда с точками входа и предупреждениями о развороте. Этот индикатор позволяет пользователям уверенно и точно ориентироваться в сложностях рынка Форекс Помимо первичных сигналов, индикатор Trend Ai определяет вторичные точки входа, возникающие во время откатов или коррекций, позволяя трейдерам извлекать выгоду из коррекции цены в рамках установленного тренда. Важные преимущества: · Работае
Внутридневная стратегия, основанная на двух фундаментальных принципах рынка. В основе алгоритма лежит анализ объемов и ценовых волн с применением дополнительных фильтров. Интеллектуальный алгоритм индикатора дает сигнал только тогда, когда два рыночных фактора объединяются в одно целое. Индикатор рассчитывает волны определенного диапазона, а уже для подтверждения волны индикатор использует анализ по объемам. Данный индикатор - это готовая торговая система. Все что нужно от трейдера - следовать с
Если вы покупаете этот индикатор, вы получите мой профессиональный Trade Manager + EA БЕСПЛАТНО. Прежде всего стоит подчеркнуть, что эта торговая система является индикатором без перерисовки, без повторной отрисовки и без задержки, что делает ее идеальной как для ручной, так и для роботизированной торговли. Онлайн курс, руководство и загрузка пресетов. «Smart Trend Trading System MT5» - это комплексное торговое решение, созданное для новичков и опытных трейдеров. Он объединяет более 10 премиаль
Этот индикатор представляет собой индикатор автоматического волнового анализа, который идеально подходит для практической торговли! Случай... Примечание.   Я не привык использовать западные названия для классификации волн. Из-за влияния соглашения об именах Тан Лунь (Тан Чжун Шуо Дзен) я назвал основную волну   ручкой   , а вторичную полосу волн —   сегментом   Ат. в то же время сегмент имеет направление тренда. Именование   в основном является трендовым сегментом   (этот метод именования буде
PRO Renko System - это высокоточная система торговли на графиках RENKO. Система универсальна. Данная торговая система может применяться к различным торговым инструментам. Система эффективно нейтрализует так называемый рыночный шум, открывая доступ к точным разворотным сигналам. Индикатор прост в использовании и имеет лишь один параметр, отвечающий за генерацию сигналов. Вы легко можете адаптировать алгоритм к интересующему вас торговому инструменту и размеру ренко бара. Всем покупателям с удовол
FX Power: Анализируйте силу валют для более эффективной торговли Обзор FX Power — это ваш незаменимый инструмент для понимания реальной силы валют и золота в любых рыночных условиях. Определяя сильные валюты для покупки и слабые для продажи, FX Power упрощает принятие торговых решений и выявляет высоковероятные возможности. Независимо от того, хотите ли вы следовать за трендами или предсказывать развороты с использованием экстремальных значений дельты, этот инструмент идеально адаптируется под
SMC Easy Signal
Mohamed Hassan
4.73 (15)
3 copies left at $65, next price is $120 SMC Easy Signal was built to remove the confusion around the smart money concept by turning structural shifts like BOS (Break of Structure) and CHoCH (Change of Character) into simple buy and sell trading signals. It simplifies market structure trading by automatically identifying breakouts and reversals as they happen, allowing traders to focus on execution rather than analysis. Whether the market is continuing its trend or preparing to reverse, the i
Looking for a powerful yet lightweight swing detector that accurately identifies market structure turning points? Want clear, reliable buy and sell signals that work across any timeframe and any instrument? Buy Sell Arrow MT Swing is built exactly for that — precision swing detection made simple and effective. This indicator identifies Higher Highs (HH) , Higher Lows (HL) , Lower Highs (LH) , and Lower Lows (LL) with remarkable clarity. It is designed to help traders easily visualize market str
Dynamic Forex28 Navigator — инструмент для торговли на рынке Форекс нового поколения. В НАСТОЯЩЕЕ ВРЕМЯ СКИДКА 49%. Dynamic Forex28 Navigator — это эволюция наших популярных индикаторов, объединяющая мощь трех в одном: Advanced Currency Strength28 Indicator (695 отзывов) + Advanced Currency IMPULSE with ALERT (520 отзывов) + CS28 Combo Signals (бонус). Подробности об индикаторе https://www.mql5.com/en/blogs/post/758844 Что предлагает индикатор Strength нового поколения?  Все, что вам нравило
ACB Breakout Arrows
KEENBASE SOFTWARE SOLUTIONS
4.15 (34)
Индикатор ACB Breakout Arrows предоставляет ключевой сигнал на вход в рынок, обнаруживая особую модель пробоя. Индикатор непрерывно сканирует график на наличие стабилизирующегося импульса в одном направлении и выдает точный сигнал перед значительным рыночным движением.  Получите сканер с поддержкой мульти-символов и мульти-таймфреймов здесь - Сканер для ACB Breakout Arrows MT4 Ключевые особенности Уровни Стоп-лосса и Тейк-профита задаются индикатором. Поставляется с панелью сканера MTF, которая
Currency Strength Wizard — очень мощный индикатор, предоставляющий вам комплексное решение для успешной торговли. Индикатор рассчитывает силу той или иной форекс-пары, используя данные всех валют на нескольких тайм фреймах. Эти данные представлены в виде простых в использовании индексов валют и линий силы валют, которые вы можете использовать, чтобы увидеть силу той или иной валюты. Все, что вам нужно, это прикрепить индикатор к графику, на котором вы хотите торговать, и индикатор покажет вам ре
В НАСТОЯЩЕЕ ВРЕМЯ СКИДКА 26% Лучшее решение для новичка или трейдера-эксперта! Этот индикатор является уникальным, высококачественным и доступным торговым инструментом, поскольку мы включили в него ряд собственных функций и новую формулу. С помощью всего лишь ОДНОГО графика вы можете определить силу валюты для 28 пар Форекс! Представьте, как улучшится ваша торговля, потому что вы сможете точно определить точку запуска нового тренда или возможность скальпирования? Руководство пользователя:  
Trend Screener
STE S.S.COMPANY
4.79 (95)
Индикатор тренда, революционное уникальное решение для торговли и фильтрации тренда со всеми важными функциями тренда, встроенными в один инструмент! Это 100% неперерисовывающийся мультитаймфреймный и мультивалютный индикатор, который можно использовать на всех инструментах/инструментах: форекс, товары, криптовалюты, индексы, акции. ПРЕДЛОЖЕНИЕ ОГРАНИЧЕННОГО ВРЕМЕНИ: Индикатор скринера поддержки и сопротивления доступен всего за 50$ и бессрочно. (Изначальная цена 250$) (предложение продлено) Tre
SMC Blast Signal with FVG, BOS and trend Breakout The SMC Blast Signal  is a  Precise trading system for Meta Trader 4 that uses Smart Money Concepts (SMC) , including Fair Value Gaps (FVG) and Break of Structure (BOS) , to identify high-probability trades. It incorporates a Trend Filter using a higher timeframe moving average, ensuring trades align with the prevailing market trend. TREND SIGNAL-FVG DETECTION-BOS DETECTION-TRADE CONFIRMED-Precise Signal entries on m15  Best TF-M15 AND ABOVE Be
Day Trader Master - это полноценная торговая система для трейдеров, кто ведет внутридневную торговлю. Система состоит из двух индикаторов. Один индикатор представляет собой стрелки-сигналы на покупку и продажу. Именно стрелочный индикатор вы приобретаете. Второй индикатор я предоставлю вам совершенно бесплатно. Второй индикатор является индикатором тренда, специально разработанного для использования совместно с этими стрелками. ИНДИКАТОРЫ НЕ ПЕРЕРИСОВЫВАЮТСЯ И НЕ ЗАПАЗДЫВАЮТ! Использовать данную
Market Structure Break Out (MSB) — это продвинутый инструмент, разработанный для платформ MT4 и MT5 , который помогает трейдерам анализировать движение рынка через призму рыночной структуры. Он определяет и отображает ключевые торговые сигналы с помощью стрелок и оповещений как по направлению тренда , так и против него (сигналы на разворот). Одной из его главных функций является построение непрерывных зон спроса и предложения , что даёт трейдерам чёткое представление о ключевых уровнях цены. Кр
Специальное предложение : ALL TOOLS , всего по $35 за штуку! Новые инструменты   будут стоить   $30   в течение   первой недели   или   первых 3 покупок !  Trading Tools Channel on MQL5 : Присоединяйтесь к моему каналу на MQL5, чтобы получать последние новости от меня Volumatic Support/Resistance Levels Scanner — это индикатор уровней поддержки и сопротивления, который добавляет к ценовой структуре контекст объёма. Показывая, как торговая активность концентрируется вокруг последних разворотных
Топовый индикатор МТ4, дающий сигналы для входа в сделки без перерисовки! Идеальные точки входа в сделки   для  валют, крипты, металлов, акций, индексов !  Смотрите  видео  (6:22) с примером отработки всего одного сигнала, окупившего индикатор. Версия индикатора для MT5 Преимущества индикатора Сигналы на вход без перерисовки Если сигнал появился, он никуда НЕ исчезает! В отличие от индикаторов с перерисовкой, которые ведут к потере депозита, потому что могут показать сигнал, а потом убрать его.
Hidden Cycles
Lev Vladimirovic Marushkin
5 (1)
Black Friday Sale – Limited Time! Grab Hidden Cycles for only $129 (regular price $179 ). This is your chance to boost your strategy with a powerful, easy-to-use cycle-based trading tool. Offer ends soon — don’t miss it! Based on Universal Laws — NOT Some Guy’s Algorithm: Let the market adjust to the Hidden Cycles Geometry — not the other way around. Most indicators are based on a man-made formula. They often lag, fail over time, or need constant re-optimization.  Hidden Cycles is different.
Adaptive Volatility Range [AVR] - это мощнейший инструмент для определения ключевых  разворотов тренда. AVR  - с точностью отображает Средний Истинный Диапазон  волатильности с учетом Средневзвешенной по объему цены .Индикатор позволяет адаптироваться абсолютно под  любую волатильность рынка,путем расчета средней волатильности за определенный период времени -это обеспечивает устойчивый показатель положительных сделок. Вы получаете не просто индикатор,а  профессиональную автоматизированную торго
СЕЙЧАС СКИДКА 31% !!! Лучшее решение для новичка или трейдера-эксперта! Этот индикатор является уникальным, высококачественным и доступным торговым инструментом, поскольку мы включили в него ряд собственных функций и секретную формулу. Всего на ОДНОМ графике он выдает алерты по всем 28 валютным парам. Представьте, как улучшится ваша торговля, ведь вы сможете точно определить точку запуска нового тренда или возможность скальпирования! Построенный на новых базовых алгоритмах, он позволяет еще
Binary Trader Master — это стрелочный индикатор, который предсказывает закрытие свечи. Он делает свой анализ только в пределах одной свечи. Когда свеча открывается, требуется несколько минут, чтобы провести анализ и предсказать закрытие свечи. Затем генерируется сигнал. Индикатор также позволяет вам применять временные ограничения, которые он может использовать для анализа, что означает, что вы можете фактически указать индикатору, сколько времени ему разрешено иметь для анализа в пределах свечи
Другие продукты этого автора
A pin bar pattern consists of one price bar, typically a candlestick price bar, which represents a sharp reversal and rejection of price. The pin bar reversal as it is sometimes called, is defined by a long tail, the tail is also referred to as a “shadow” or “wick”. The area between the open and close of the pin bar is called its “real body”, and pin bars generally have small real bodies in comparison to their long tails. The tail of the pin bar shows the area of price that was rejected, and t
FREE
A heatmap is a graphical representation of data in two dimensions, using colors to display different factors. Heatmaps are a helpful visual aid for viewers, enabling the quick dissemination of statistical or data-driven information. The MP Heatmap indicator provides a graphical representation of the relative strengths of major currencies compared to others, organizing data from pairs into color-coded results and producing a clear overview of the entire Forex market. The MP Heatmap indicator dis
FREE
MP Squeeze Momentum is a volatility and momentum indicator derivated of "TTM Squeeze" volatility indicator introduced by John Carter. It capitalizes on the tendency for price to break out strongly after consolidating in a tight range. Introduction: The volatility component of MP Squeeze Momentum measures price compression using Bollinger Bands and Keltner Channels. If the Bollinger Bands are completely enclosed within the Keltner Channels, that indicates a period of very low volatility. This st
FREE
An “inside bar” pattern is a two-bar price action trading strategy in which the inside bar is smaller and within the high to low range of the prior bar, i.e. the high is lower than the previous bar’s high, and the low is higher than the previous bar’s low. Its relative position can be at the top, the middle or the bottom of the prior bar. The prior bar, the bar before the inside bar, is often referred to as the “mother bar”. You will sometimes see an inside bar referred to as an “ib” and its m
FREE
The MP Andean Oscillator is used to estimate the direction and also the degree of variations of trends. It contains 3 components: Bull component, Bear component and Signal component. A rising Bull component indicates that the market is up-trending while a rising Bear component indicates the presence of down-trending market. Settings: Oscillator period: Specifies the importance of the trends degree of variations measured by the indicator. Signal line per: Moving average period of the Signal line
FREE
The purpose of using Smart money index (SMI) or smart money flow index is to find out investors sentiment. The index was constructed by Don Hays and measures the market action. The indicator is based on intra-day price patterns. The beginning of the trading day is supposed to represent the trading by retail traders. The majority of retail traders overreact at the beginning of the trading day because of the overnight news and economic data. There is also a lot of buying on market orders and shor
FREE
MP Candle Countdown indicator with a progress bar is a tool used in technical analysis that displays the time remaining until the current candlestick on a chart closes, along with a progress bar that shows visually the amount of time that has elapsed since the candlestick opened. This indicator can be helpful for traders who use candlestick charting to make trading decisions, as it provides both a visual representation of the time left until a candlestick closes and an indication of how much ti
FREE
This indicator is stand alone version from  MP Pivot Levels  (All in one) containing Demark's Pivots. Calculations:     PP = X / 4     R1 = X / 2 - LOWprev     S1 = X / 2 - HIGHprev Uses: When the pair currency price may change the direction of movement. Possible constraints of support and resistance that creates plateaus for the currency pair prices. Tendency identification by comparing the present prices according to current day's pivot point and also the prior day's pivot points. ____________
FREE
The MP Andean Oscillator is used to estimate the direction and also the degree of variations of trends. It contains 3 components: Bull component, Bear component and Signal component. A rising Bull component indicates that the market is up-trending while a rising Bear component indicates the presence of down-trending market. Settings: Oscillator period: Specifies the importance of the trends degree of variations measured by the indicator. Signal line per: Moving average period of the Signal line
FREE
This indicator is stand alone version from  MP Pivot Levels  (All in one) containing Woodie Pivots. Woodie’s pivot points are made up of multiple key levels, calculated from past price points, in order to frame trades in a simplistic manner. The key levels include the ‘pivot’ itself, and multiple support and resistance levels (usually up to three each). Traders use these levels as a guide for future price movements when setting up trades. The pivot : (Previous high + previous low + 2 x previous
FREE
This indicator is stand alone version from  MP Pivot Levels  (All in one) containing Demark's Pivots. Calculations:     PP = X / 4     R1 = X / 2 - LOWprev     S1 = X / 2 - HIGHprev Uses: When the pair currency price may change the direction of movement. Possible constraints of support and resistance that creates plateaus for the currency pair prices. Tendency identification by comparing the present prices according to current day's pivot point and also the prior day's pivot points. ____________
FREE
This trend scanner indicator is using two main indicators to identify trends. Frist the EMAs to provide a view on Bullish / Bearish momentum. When the shorter EMA (calculated off more recent price action) crosses, or is above, the slower moving EMA (calculated off a longer period of price action), it suggests that the market is in an uptrend. Second the Stochastic RSI, When RSI is < 20 it is considered oversold, and when > 80 it is overbought. These conditions suggests that momentum is very str
FREE
MACD (short for   M oving   A verage   C onvergence/ D ivergence) is a popular trading indicator used in technical analysis of securities prices. It is designed to identify changes in the strength, direction, momentum, and duration of a trend in a security's price. History Gerald Appel created the MACD line in the late 1970s. Thomas Aspray added the histogram feature to Appel's  MACD in 1986. The three major components and their formula 1. The MACD line: First, "PM Colored MACD" employs two M
This utility identifies certain candle open times on chart, this can help you to see your favorite candle open and use it as it fits in your strategy. This tool is very useful for intraday charting and indicating your sessions. ___________________________________________________________________________________ Disclaimer: Do NOT trade or invest based upon the analysis presented on this channel. Always do your own research and due diligence before investing or trading. I’ll never tell you what
FREE
A pin bar pattern consists of one price bar, typically a candlestick price bar, which represents a sharp reversal and rejection of price. The pin bar reversal as it is sometimes called, is defined by a long tail, the tail is also referred to as a “shadow” or “wick”. The area between the open and close of the pin bar is called its “real body”, and pin bars generally have small real bodies in comparison to their long tails. The tail of the pin bar shows the area of price that was rejected, and t
FREE
MP Price Change Indicator is a tool to calculate the price movement by percentage. The Value of this indicator can be adjusted to look back of the percent of price change within certain timeframes. This is a powerful tool when used by other indicators as well, such as ATR and ADR, for understanding price fluctuations and tolerance in different strategies. ___________________________________________________________________________________ Disclaimer: Do NOT trade or invest based upon the analysi
FREE
Candle size oscillator is an easy to use tool to figure out candle size from highest to lowest price of each candle. It's a powerful tool for price action analysts specifically for those who works intraday charts and also a perfect tool for short term swing traders. Kindly note that you can also edit the Bullish and Bearish candles with different colors. #Tags: Candle size, oscillator, price action, price range, high to low, candle ticks __________________________________________________________
FREE
MP Inside Bar
Pierre Ksachikian
5 (2)
An “inside bar” pattern is a two-bar price action trading strategy in which the inside bar is smaller and within the high to low range of the prior bar, i.e. the high is lower than the previous bar’s high, and the low is higher than the previous bar’s low. Its relative position can be at the top, the middle or the bottom of the prior bar. The prior bar, the bar before the inside bar, is often referred to as the “mother bar”. You will sometimes see an inside bar referred to as an “ib” and its m
FREE
This creative simple indicator will provide a precise framework for market sentiment within technical analysis of different timeframes. For instance, for traders like me that uses   "Mark Fisher"   strategy regularly, this is a perfect indicator for having an insight to markets from short term to long term point of view, using Break points of candles' lows and highs and perfect to combine with   "Price Action" . For more options and modifications you can also edit the low timeframe candles withi
FREE
This indicator is stand alone version from  MP Pivot Levels  (All in one) containing Woodie Pivots. Woodie’s pivot points are made up of multiple key levels, calculated from past price points, in order to frame trades in a simplistic manner. The key levels include the ‘pivot’ itself, and multiple support and resistance levels (usually up to three each). Traders use these levels as a guide for future price movements when setting up trades. The pivot : (Previous high + previous low + 2 x previous
FREE
MP Relative Bandwidth Filter (RBF) is created to be used to identify your trading zones based on volatility. This easy to use technical indicator attempts to compare between Bandwidth of higher length and ATR of lower length to identify the areas of low and high volatility: Relative Bandwidth = Bandwidth / ATR The Bandwidth is based on Bollinger Band which its length ideally needs to be higher and ATR length needs to be ideally lower. After calculating Relative Bandwidth, the Bollinger Band is
FREE
MP Gradient Adaptive RSI oscillator uses AMA with the basic RSI to cover the retracements with minimum lag. Trigger line crossing the oscillator will provide an entry point for trader. Settings: RSI period: period of the oscillator Sensitivity of the oscillator: controls the sensitivity of the oscillator to retracements, with higher values minimizing the sensitivity to retracements. RSI applied price: source input of the indicator Number of bars to draw: is used when the Fill Type option is no
FREE
This creative simple indicator will provide a precise framework for market sentiment within technical analysis of different timeframes. For instance, for traders like me that uses   "Mark Fisher"   strategy regularly, this is a perfect indicator for having an insight to markets from short term to long term point of view, using Break points of candles' lows and highs and perfect to combine with   "Price Action" . For more options and modifications you can also edit the low timeframe candles withi
FREE
Candle size oscillator is an easy to use tool to figure out candle size from highest to lowest price of each candle. It's a powerful tool for price action analysts specifically for those who works intraday charts and also a perfect tool for short term swing traders. Kindly note that you can also edit the Bullish and Bearish candles with different colors. #Tags: Candle size, oscillator, price action, price range, high to low, candle ticks __________________________________________________________
FREE
MP Price Change Indicator is a tool to calculate the price movement by percentage. The Value of this indicator can be adjusted to look back of the percent of price change within certain timeframes. This is a powerful tool when used by other indicators as well, such as ATR and ADR, for understanding price fluctuations and tolerance in different strategies. ___________________________________________________________________________________ Disclaimer: Do NOT trade or invest based upon the analysi
FREE
This utility identifies certain candle open times on chart, this can help you to see your favorite candle open and use it as it fits in your strategy. This tool is very useful for intraday charting and indicating your sessions. ___________________________________________________________________________________ Disclaimer: Do NOT trade or invest based upon the analysis presented on this channel. Always do your own research and due diligence before investing or trading. I’ll never tell you what
FREE
MP Close By Loss Or Profit for MT5 The Reason I made this Expert is because I want traders who already found out how to be profitable in the market use an easier tool throughout their trading days. This Expert will consider your exposure of trades and close them based on profit targets and losses you set for your own Risk Management. I want to thank my friend who helped me on this Expert, and his brilliant work is now shared here with you. A bit of advice after running the expert on your platfo
FREE
This indicator helps to identify market sessions, It's High/Low, Open Range (OR), range of the sessions in pips and percentage of previous day (change%) under OHLC. It is also editable for any brokerage market watch time. For traders who use session trading strategies such as Mark B. Fisher ACD it can be super effective, where they can edit OR from the settings to either line or box.  We tried to make the settings easier to edit, for traders' use on different markets, charts and brokerage time.
This indicator contains Pivot Levels of: Traditional Fibonacci Woodie Classic Demark Camarilla Calculation periods can be set to auto / Daily / Weekly / Monthly / Yearly. Number of Levels are editable. Options to hide level labels and price labels. Pivots Points are price levels chartists can use to determine intraday support and resistance levels. Pivot Points use the previous days Open, High, and Low to calculate a Pivot Point for the current day. Using this Pivot Point as the base, three resi
MACD (short for M oving A verage C onvergence/ D ivergence) is a popular trading indicator used in technical analysis of securities prices. It is designed to identify changes in the strength, direction, momentum, and duration of a trend in a security's price. History Gerald Appel created the MACD line in the late 1970s. Thomas Aspray added the histogram feature to Appel's  MACD in 1986. The three major components and their formula 1. The MACD line: First, "PM Colored MACD" employs two Moving
Фильтр:
Нет отзывов
Ответ на отзыв