Assembler
- Индикаторы
- Версия: 1.24
- Обновлено: 7 мая 2026
- Активации: 5

Introducing Assembler:
The best value for money, Designed for advanced traders and professionals, yet accessible for ambitious beginners ready to elevate their trading game.
Great for ICT, SMC, TREND and breakout traders
. Combining advanced analytics, a sleek graphical interface, and highly customizable features, Assembler empowers you to trade with precision, clarity, and confidence.
Key Features of Assembler
1. Dynamic Graphical User Interface (GUI):
- A fully draggable, customizable interface that fits seamlessly into your workflow.
- Toggle key elements such as Order Blocks, Targets, Support & Resistance, Range Bars, and Break of Structure (BOS) with intuitive controls.
2. Advanced Alerts System:
- Real-time Multi-Timeframe Breakout Alerts for immediate notification of price action across different timeframes.
- Trend Change Alerts ensure you stay ahead of market reversals, giving you the edge in timing entries and exits.
3. Enhanced Risk Management:
- Built-in Position Size Calculator to help you manage risk effortlessly.
- Track daily and total profit/loss directly on the GUI, keeping you aligned with your trading objectives.
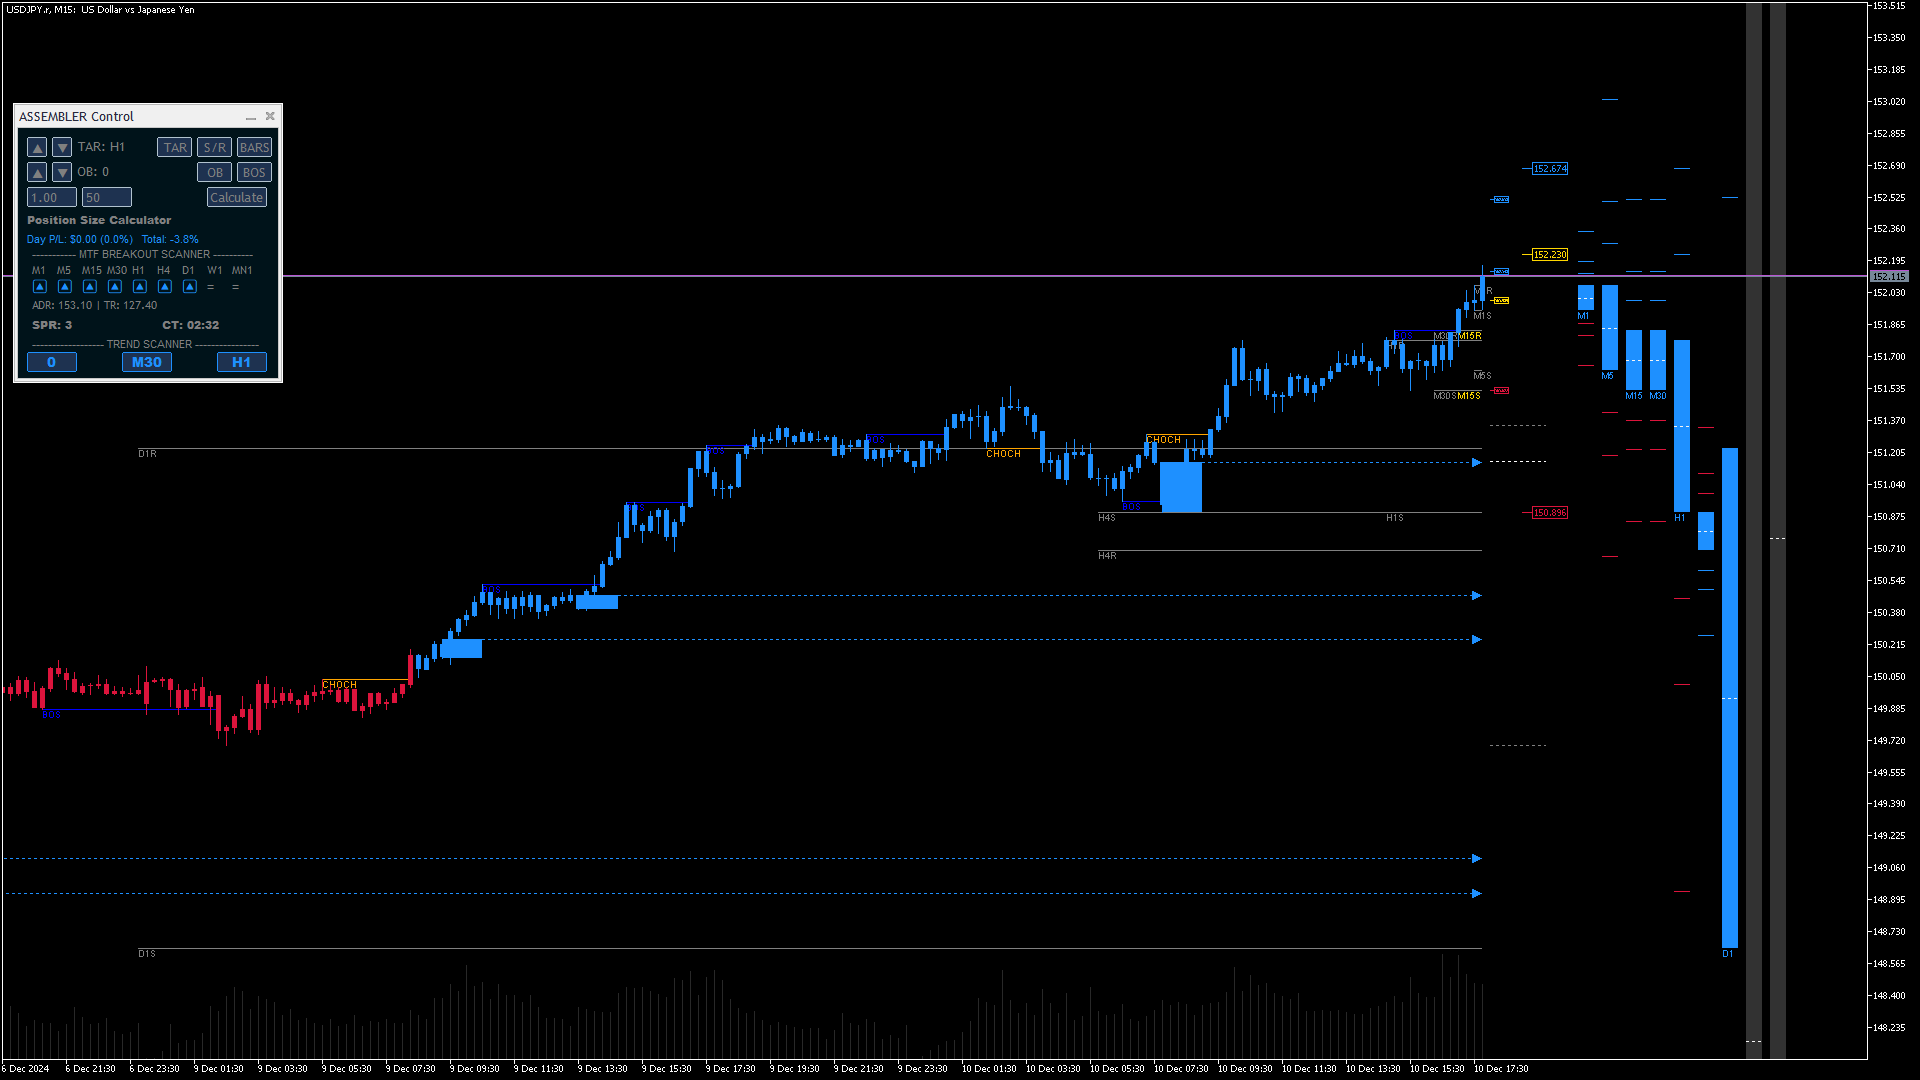
4. Multi-Timeframe Breakout Scanner:
- A scanner with clear, color-coded arrows indicating breakout direction across multiple timeframes.
- Quickly identify opportunities and detect whether the price is consolidating or breaking out.
5. Average Daily Range (ADR) Insights:
- Monitor the current range against the ADR to assess market volatility.
- Stay informed of spread conditions with dynamic coloring that highlights unusual spread widening.
6. Powerful Trend Scanner:
- Displays trends for three selected timeframes with easy-to-read buttons.
- Color-coded buttons and backgrounds distinguish between the current trend (text and border in current trend color) and newly confirmed trend changes (button color in new trend)
- Visualize trends in three modes: Candlestick Coloring, Trend Line, or Bar Coloring for ultimate flexibility.
- Clicking on a trend scanner buttons cycles through timeframes
7. Smart Chart Elements:
- Automatically plots Support & Resistance levels, Order Blocks, FVG and Market Structure (BOS and CHOCH) for streamlined analysis.
- Dynamically adjustable targets plotted near the current candle to guide your trading decisions.
8. Range Bars with Alerts:
- Innovative Multi-timeframe Range Bars adapt dynamically, turning gray during consolidation and changing colors with breakout direction.
- Integrated breakout alerts and clearly marked targets help you spot MTF alignment high-probability setups with ease.
9. Additional Market Tools:
- Key level markers for Yesterday’s High/Low and Today’s Open provide immediate insight into market context.
- A real-time Candle Timer ensures perfect timing for entries and exits.
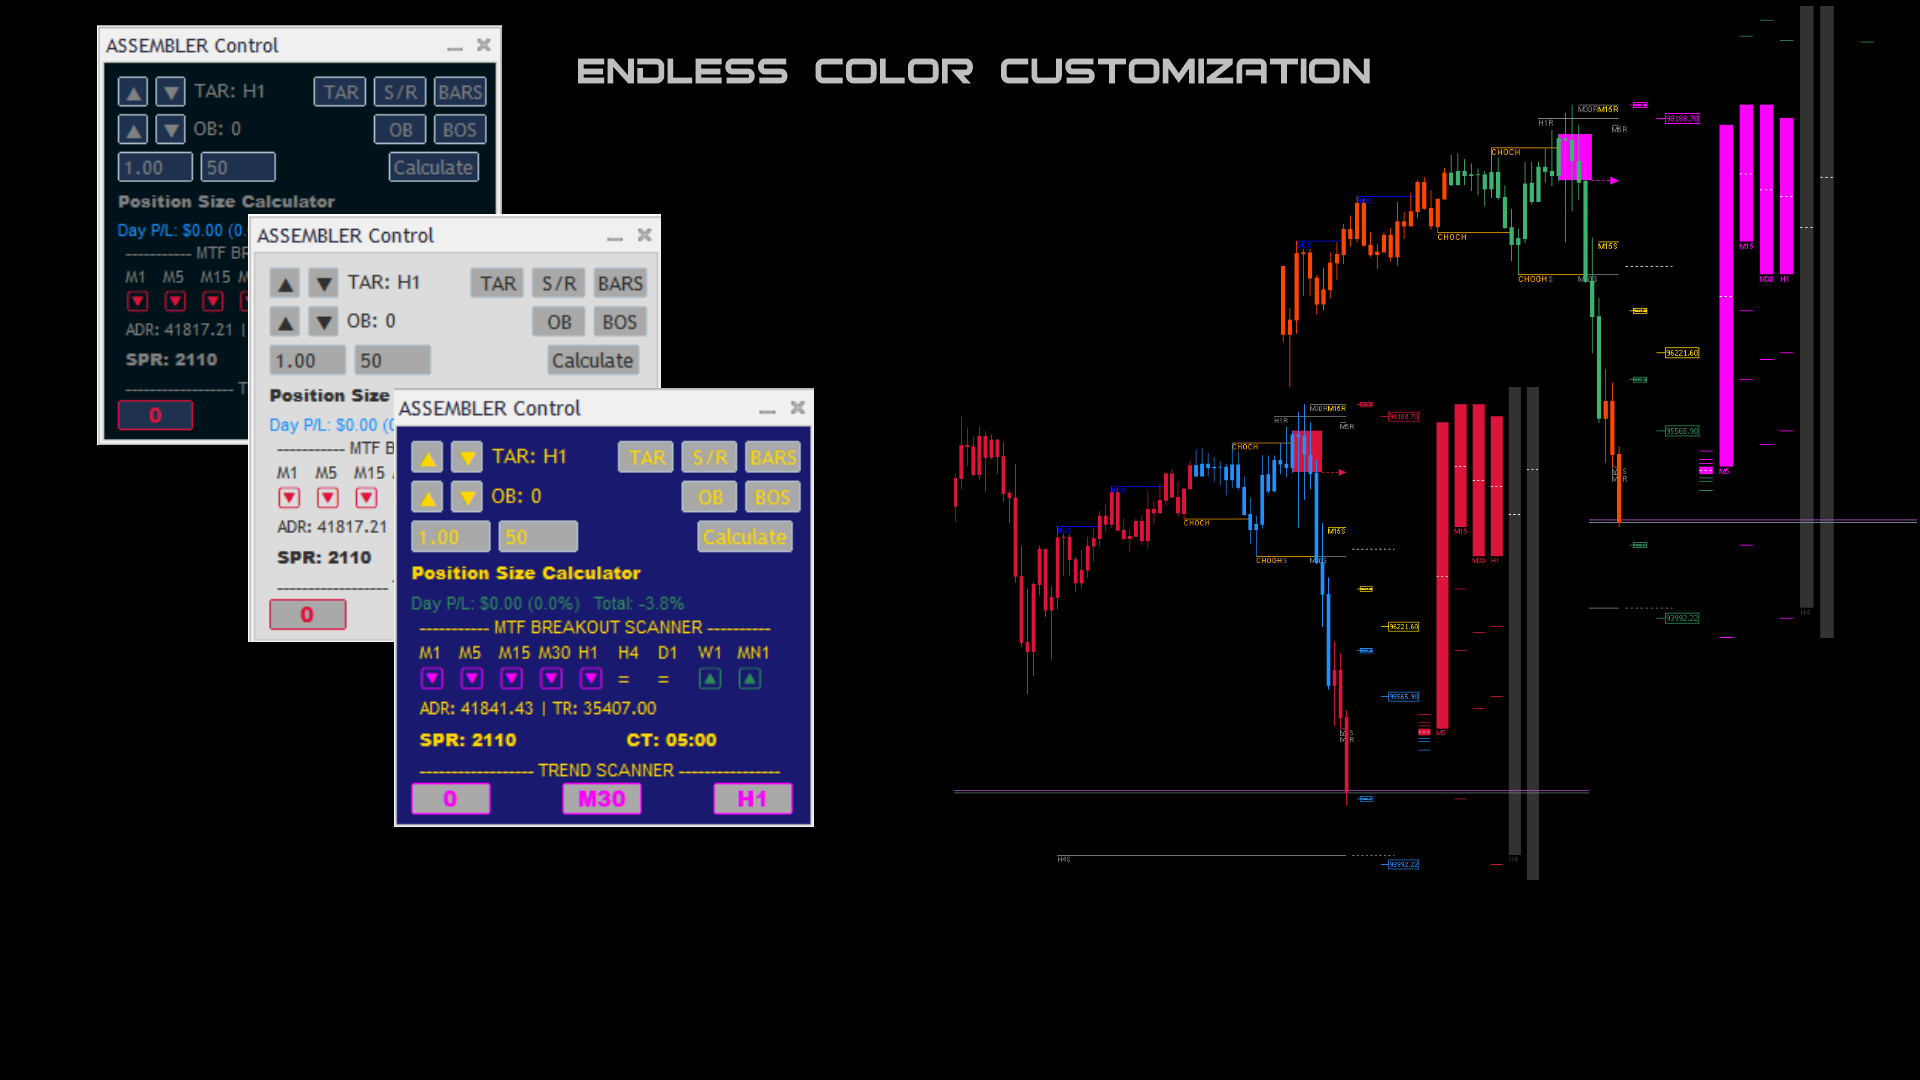
10. Fully Customizable:
- Tailor the appearance to suit your preferences with adjustable colors, styles, and settings for all chart elements.
Why Choose Assembler?
Assembler isn’t just an indicator—it’s your complete trading assistant. It is designed to:
- Simplify Complexity: Consolidate all critical tools into one intuitive package
- Spot Multi-Timeframe Alignments: Effortlessly identify alignments and confluences across timeframes for high-confidence trades.
- Enhance Decision-Making: Alerts for breakouts and trend changes keep you in tune with market dynamics.
- Boost Customization: Fully adjustable settings ensure Assembler adapts to your trading style, not the other way around.
Take Your Trading to the Next Level
Assembler’s cutting-edge design and powerful features make it the ultimate tool for spotting high-probability setups and improving your trading accuracy.
With real-time insights, customizable alerts, and intuitive controls, you’ll trade smarter, faster, and more confidently.
----------------------------------------------------------------------------------------------------------------------------------------------------------------------------------------------------
Assembler Indicator User Guide
Welcome to the Assembler Indicator user guide. This manual will help you understand and configure the settings effectively, ensuring you make the most out of this advanced tool.
1. Color Settings
Assembler allows you to customize the colors of various elements such as trend lines, support/resistance, and targets. While not critical to functionality, setting colors to match your personal preferences or charting style can enhance readability and usability.
2. Multi Breakout Alerts
- Alerts are triggered when breakouts occur across multiple timeframes.
- Settings:
- Enable/Disable Alerts: Toggle alerts on or off.
- Minimum Timeframes for Alert: Set how many timeframes must align for an alert.
- Tip: In case of higher timeframe breakouts (e.g., weekly/monthly), increase the number of timeframes monitored to avoid frequent alerts when trading lower timeframes (e.g., 15 or 30 minutes).
---
3. Risk Management Settings
- Default Stop Loss: The initial stop loss in pips, adjustable to suit your strategy.
- Risk Percent: The percentage of your account balance to risk per trade.
- Initial Balance: Used to calculate your daily and total profit/loss. Set this to match your trading account.
4. Trend Settings
- Trend Period: Defines the calculation period for trend plotting.
- Default (50): Captures intermediate trends.
- Higher Values (e.g., 100): Smooth out market noise and focus on major trends.
- ATR Period: Determines the Average True Range used in trend calculations. This value affects sensitivity.
- Display Style: Choose between:
- Automatic: Adapts plotting style to your chart type (bars, candlestick, line).
- Manual: Set your preferred plotting style.
The first button in trend scanner will plot arrow on chart and trigger alert on confirmed trend change.
---
5. Order Blocks
- Block Extension: Number of candles the order block rectangle extends.
- Extend to Current Bar: Enable to extend blocks to the current candle, creating wider like support/resistance zones.
- Draw Lines to Current Time: Toggle to draw lines from order blocks to the current time.
- Candles to Use for Calculation: Defines the historical scope for calculating impact on order blocks and market structure . Lower values reduce resource usage.
---
6. Market Structure (BOS/CHOCH)
- Break of Structure (BOS) and Change of Character (CHOCH) lines can be customized:
- Colors: Set the color for each line type.
- Line Style: Choose between solid, dashed, or dotted lines.
7. Reference Lines
Yesterday High/Low and Today Open Lines:
- Customize their colors position and styles for better visibility.
8. Fractal Calculations
- Fractal Sensitivity: Adjust the number of candles used on each side of the fractal.
- Auto Fractal Candles: Automatically sets fractal sensitivity based on the current timeframe.
- Candle Close Outside Range: Choose whether market structure is determined by candle close or high/low extremes.
9. Lower Timeframe Display
- Show Lower Timeframes: Toggle the visibility of ranges from timeframes lower than the current one.
- Impact: Affects range bar display on the right side of chart;
10. Spread Sensitivity
- Spread Sensitivity: Adjusts the threshold for identifying unusual spread widening.
- Visual Feedback: When spreads exceed the sensitivity level, they are highlighted in red, alerting you to potential volatility or illiquidity.
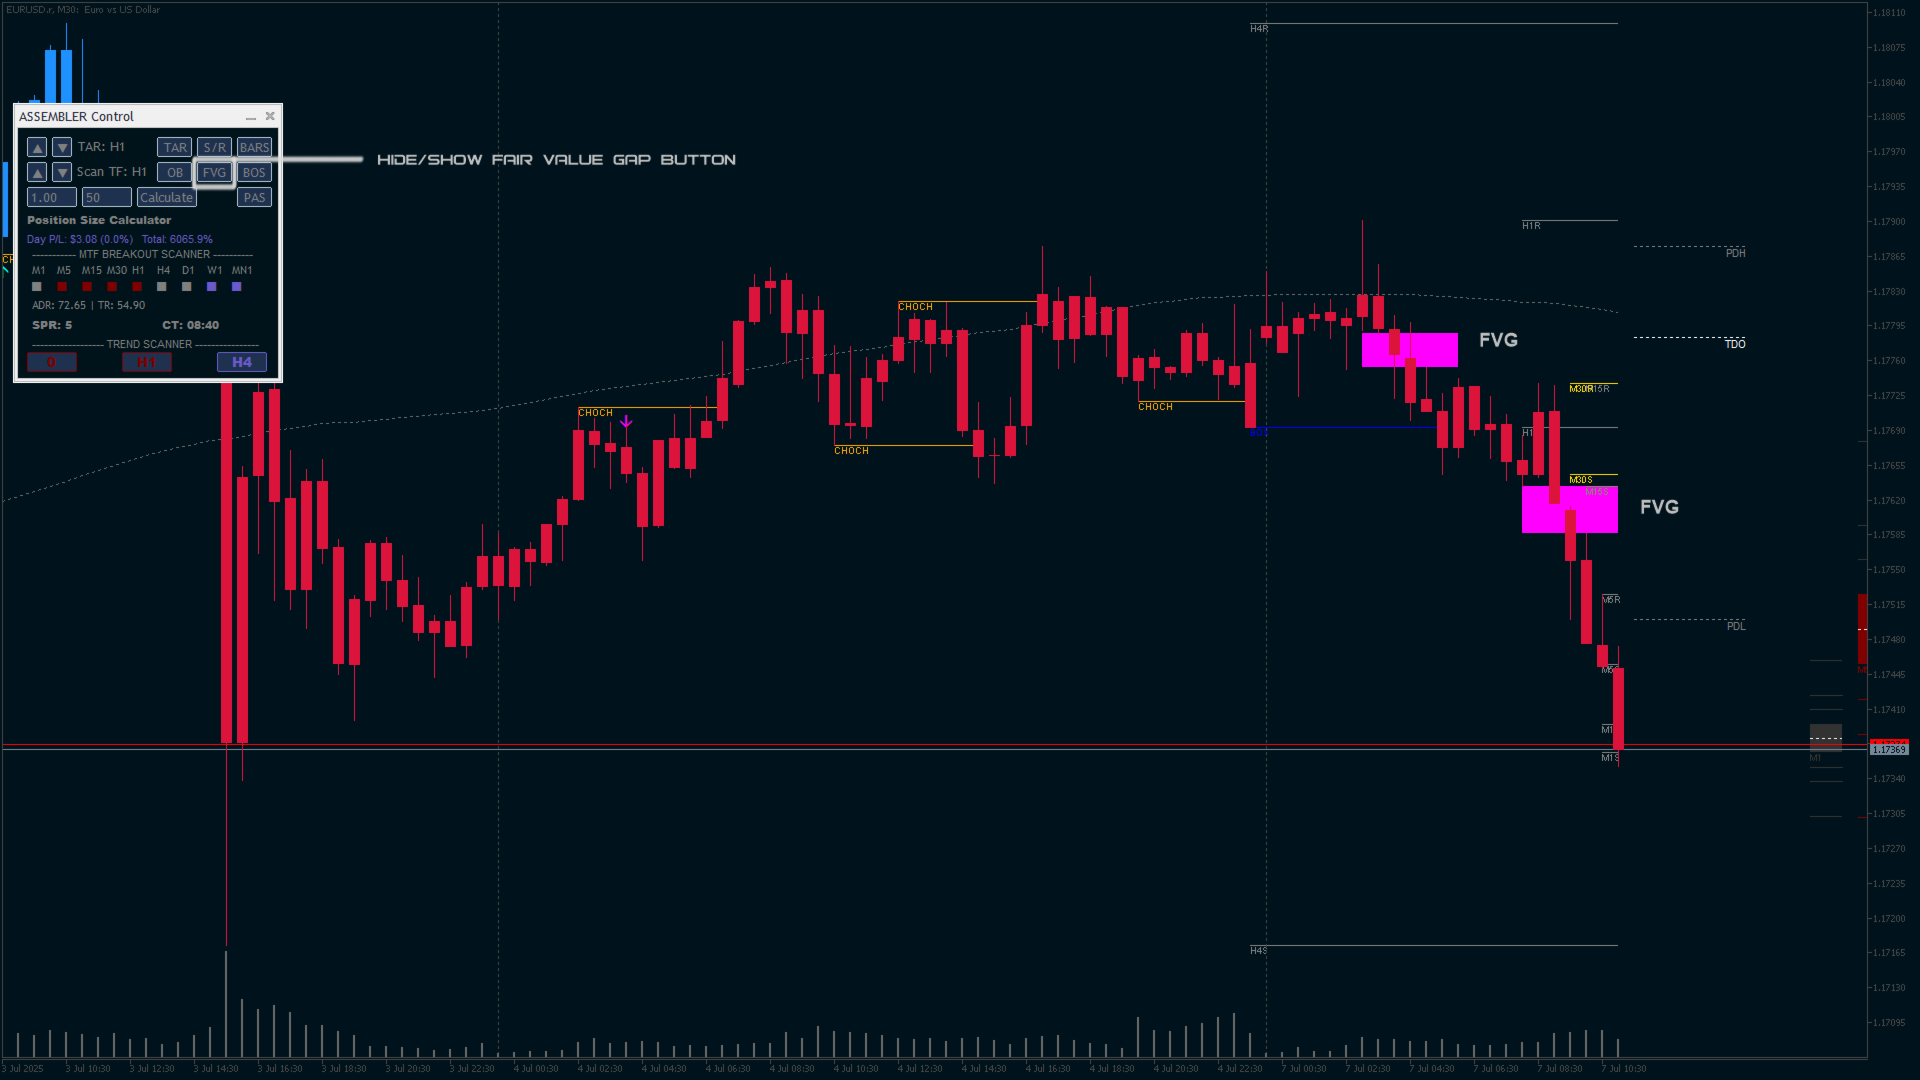
11. FVG
Seamlessly detect Fair Value Gaps (FVGs) directly on the current chart. With the integrated control panel's timeframe scroll buttonsTips for Optimal Use
1. Customization: Take advantage of the highly customizable settings to align the indicator with your trading style.
2. Alerts: Configure breakout and trend alerts to avoid unnecessary distractions while staying informed about critical market events.
3. Performance: Balance functionality and resource efficiency by adjusting settings such as candles for order block calculation and fractal sensitivity.
Assembler is a versatile, professional-grade tool that can empower traders at all levels. Use this guide to fine-tune its settings and elevate your market analysis to new heights!
How to Interpret On-Chart Elements
-
Trend Representation:
The trend is displayed in three ways depending on initial settings:- Candle Colors: Candlesticks are colored based on the trend direction.
- Bar Colors: Bars are shaded to reflect the trend.
- ATR Line: A plotted ATR-based trend line in the trend color.
-
Support and Resistance:
Horizontal gray lines represent fractal-based support and resistance levels for each timeframe, labeled accordingly. -
Targets:
- Price Labels: Targets are shown as price labels . Smaller price labels represent the current timeframe, while larger price labels are for higher timeframes. The red labels next to support/resistance lines indicate targets that can also be used to set stop-loss levels.
- Dynamic Adjustments: Targets adjust direction if the price crosses the midpoint of the range, preparing for a potential breakout.
- Target Probabilities:
- Target 1 (T1): 50% of the range, with the highest probability of being hit.
- Target 2 (T2): 100% of the range Also likely but may involve a retracement to the original range before being reached.
- Target 3 (T3): Useful for news events or sudden breakouts after a narrow range.
- Timeframe Adjustment: Use the arrow buttons next to the TAR label on the UI to change the timeframe for displayed larger targets.
-
Maximizing Probability:
Look for confluence between targets from different timeframes or alignment with other key elements, such as order blocks, today’s open, moving averages, or pivots. This is easily identified using the range bar targets on the right side of the chart.
This concise guide will help users interpret and utilize the on-chart elements effectively.
Tips:
-
If the button does not register a mouse click, try moving the GUI to a location where there are no objects (e.g., trendlines, rectangles, etc.) behind it. This helps ensure that the button receives the click event properly.
-
Market Entry Timing: Market entries on new trends have a greater potential for higher profit compared to entries near the end of trends. Identifying and entering the market at the beginning of a new trend can maximize profit opportunities.
-
For Intraday trading use H1 and h4 targets in confluence with lower timeframes.
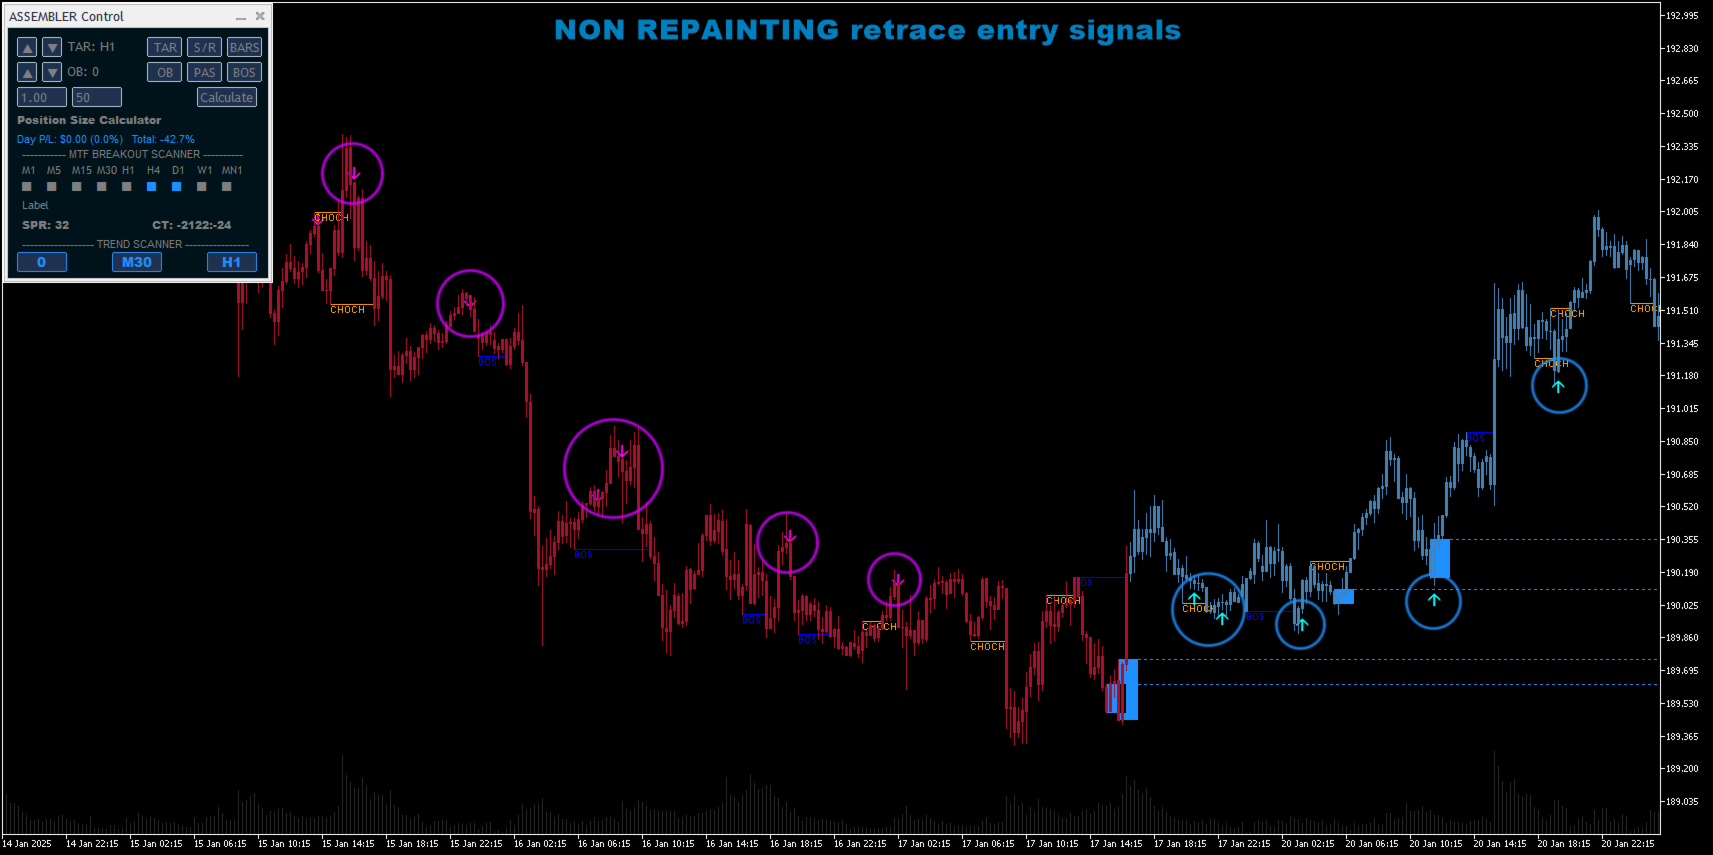
Latest updates:
-we added new futures:
NON REPAINTING retrace / pullbacks entry signals
-enhanced trend algorithm
-bar targets change color only if there is a breakout in individual timeframes
New Feature – Dynamic FVG Detection Across Timeframes Seamlessly detect Fair Value Gaps (FVGs) directly on the current chart. With the integrated control panel's timeframe scroll buttons, traders can now view FVGs from multiple timeframes without switching charts—saving time and enhancing workflow efficiency for ICT and SMC strategies.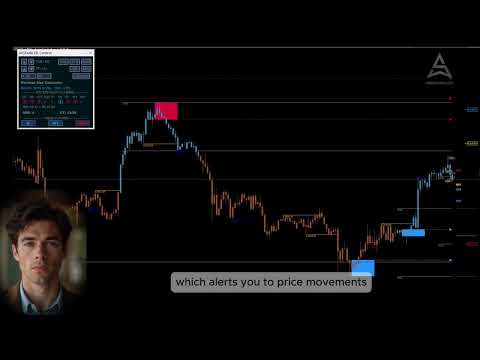

good Indi for breakout trading