PA Analyzer

5


With PA analyzer you will see a different perspective of price action , once you have unlocked the full potential of it, this tool will be essential  part of your trading system.

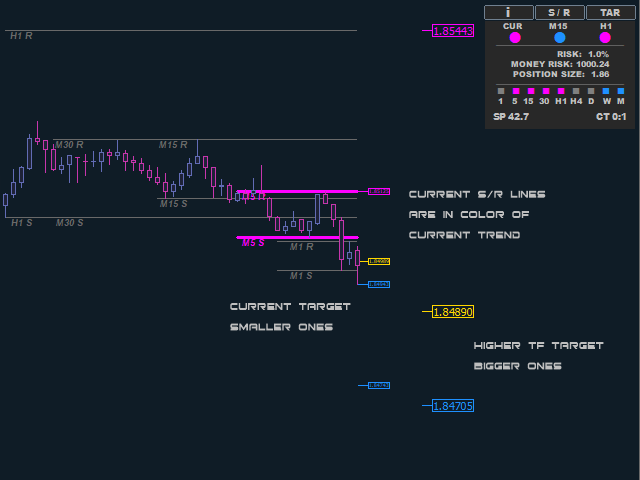
PA Analyzer enables market price analysis and automatically marks support and resistance in all time frames.

This indicator makes it easy to see whether the price is in range or trend, and generates dynamic profit take targets for the current time frame and the next higher time frame.

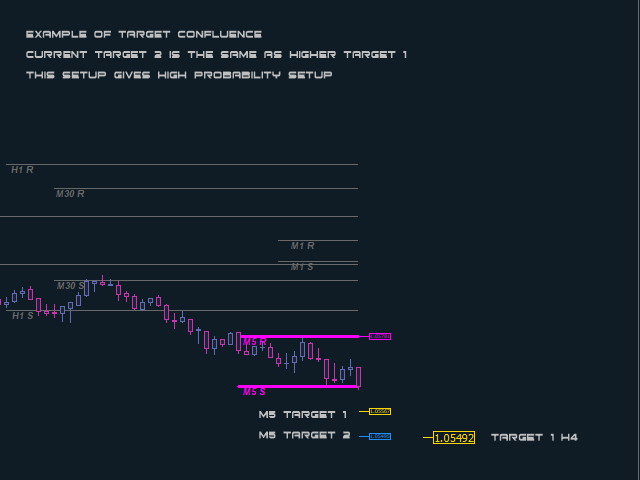
This allows you to find target confluence, giving you a clear picture of where the market is headed.

PA Analyzer boasts a special trend algorithm that displays trends on the current chart and higher time frames.

This ensures that you are always in line with the larger time frames, providing you with a comprehensive overview of market movements.

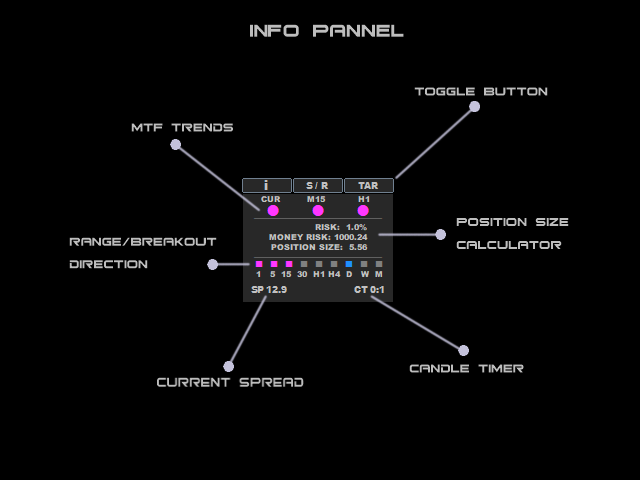
Indicator also calculates the size of your position based on the defined risk, taking into account the difference between resistance and support. And with just three buttons, you can turn on or off the info panel, support/resistance lines, or targets.

3 most important benefits:

  1. Automatic Support and Resistance Marking
  2. Effortless Price Range and Trend Analysis
  3. Dynamically Targeted Position Exiting

5 Additional Benefits:

  1. Stay in Line with Larger Time Frames Our indicator allows you to follow the trend on the current chart and higher time frames. This ensures that you always stay in line with the larger time frames, giving you a clear advantage in the market.

  2. Efficient Position Sizing Our indicator calculates the size of your position based on the defined risk, taking into account the difference between resistance and support. This allows for more efficient and effective position sizing, minimizing your risk and maximizing your profits.

  3. User-Friendly Interface Our indicator has a user-friendly interface that is easy to navigate, making it accessible to traders of all skill levels.

  4. additional information like current spread and candle timer

  5. Customizable Settings Our indicator has customizable settings, allowing you to personalize it to your trading style and preferences.


In summary, this market price analysis indicator is a advanced tool for any trader looking to enhance their trading experience.

HOW TO USE IT:

  1. Trend confirmation: To enter a market position, traders should look for at least 2 consecutive trends in the same direction, with 3 being even better. This helps confirm the direction of the market.

  2. Time frame selection: Traders should select a timeframes difference  3-5 times larger than the one currently being used. Good time frame choices include 1-5-15; 5-15-H1; 15-H1-H4; H1-H4-D1; H4-D1-W1.

  3. Target and entry selection: Traders should define a target on the higher time frame and enter the market on the lower time frame when trends are aligned. If possible, traders should try to have confluence on targets so that the target on the lower time frame is the same as the higher time frame target.

  4. Partial profit taking: Traders should consider closing partial profit when target1 (usually in gold color) is reached, as it has a high probability of being hit. This can help lock in profits and reduce risk.

  5. Retracement and target2: After target1 is reached, the price usually retraces back to the breakout point before continuing to target2. When target2 is reached, price usually stalls and makes a new range with new targets.

  6. Target3: Traders should consider target3 only in news events or when the price is in a very narrow range for a prolonged time of 15 bars or more and there is a momentum bar formation with high volatility. This can help traders understand when it may be appropriate to consider target3.

  7. Dynamic  Target can be also in line to trendlines, pivots, S/R lines or MA-s. The more confluence the higher probability

INFO PANNEL:

at the top there are 3 buttons to control what is displayed on chart. 

Bellow buttons are dots representing trends for 3 TF  (current + 2 higher TF)  trend period is by default 63 more conservative it can be lowered up to 20 ,bellow this it not advisable.

Bellow trends there is a position calculator, by default is set to 1% and it use balance to calculate position size. Position size is calculate by differences between resistance and support lines considered that stop loss should be placed at least near those lines

Next you can see the squares that represent the position of the price in relation to the S/R lines. If the price is between the S/R lines then the square is gray and that means the price is in the range.

If it is above the resistance line then it is blue and that means the  breakout is up, and if it is below the bottom line, then it is red, it means that the price is in the breakout down.

This allows us to easily observe price action in all time frames

By following these steps, traders can use this custom trading indicator more effectively to make informed trading decisions.


IMPORTANT:

S/R lines are calculated based on fractals and will not move until a new S/R is determined, the same applies to targets, when a new range is created, new targets are calculated. You can often see that the price on the current chart makes several corrections (new ranges),  in order to come in line with the targets from a longer time frame.

If you download free demo and test it on visual tester you will not be able to see full potential of the indicator since it use multi time frame analysis. We have noted that on back-testing MTF values are not displayed correctly (not updated) due to limitation of the visual tester!




Отзывы 2
cam028
6493
cam028 2024.02.01 12:16 

great product great customer service

Junaid Munawar
1062
Junaid Munawar 2023.04.26 12:03 

Currently testing it but this indicator paints a clear picture of market recommend

Рекомендуем также
The MTF Trend Dashboard indicator is a visual technical analysis tool designed for MetaTrader 4 that centralizes the trend status of all timeframes into a single separate window below the main chart. Instead of forcing you to constantly switch charts (from M5 to H4, D1, etc.) to check the macro trend, the indicator calculates real-time crossovers and maps the situation as a graphical matrix of colored bars. Here is a detailed description of its operation and structure: Visual Structure and O
FREE
Bollinger Trend Lines – MT4 & MT5 Bollinger Trend Lines   is a professional volatility-based trend indicator designed to clearly identify trend direction and dynamic stop levels using Bollinger Bands. Fuses on one core principle: follow the trend, ignore noise, and let volatility define the stop. How it works The indicator builds   trailing trend lines   using Bollinger Bands: In an   uptrend , the   lower band trails price and can only rise In a   downtrend , the   upper band trails pri
La strategia implementata in questo indicatore è un sistema Trend Following Multi-Timeframe (H1/M15) ad alta precisione , progettato specificamente per il trading intraday . Combina l'analisi della struttura macro del mercato (su grafico a 1 ora) con l'efficacia dei pattern candlestick di inversione nel micro-trend (su grafico a 15 minuti). Ecco la scomposizione dettagliata delle regole operative utilizzate dal codice: 1. Filtro Temporale (Intraday) La strategia opera esclusivamente all'interno
FREE
Fractal Pivot Lines — Indicator Overview  Fractal Pivot Lines is a custom trend-structure indicator for MetaTrader 4 . It automatically connects key fractal highs and lows with dynamic lines so you can see how price is respecting local structure, building channels, and preparing for potential reversals. Instead of staring at dozens of candles and guessing where the real pivots are, the indicator turns fractals into clear support/resistance paths and trend channels . What the Indicator Does C
The Binary Profit Maker,  This indicator works on MT4 and is very easy to use. When you receive a signal from it, you wait for that candle with the signal to close and you enter your trade at the beginning of the next new candle . A Up Purple arrow means Buy and a Down Purple arrow means Sell. All arrows comes with Alert  like for easy identification of trade signal. Are you okay with that? How To Enter Trade? 1 minute candle 1 minute expire
NHK Liquidity HeatMap helps traders visualize potential liquidity zones directly on their MT5 charts. Identify Buy/Sell Liquidity Levels, visualize liquidity distribution through a dynamic volume profile, and locate the Point of Control (POC)—the highest liquidity area. ( MT5 Vresion ) See Where the Market Hunts Your Stops. Trade with a Liquidity Advantage! Key Features: Buy & Sell Liquidity Zone Detection Dynamic Liquidity HeatMap Profile POC (Maximum Liquidity) Highlight Liquidity Levels Visu
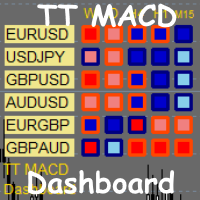
TT MACD Dashboard is multi-time frame and multi-currency market scanner. It is telling you the value of MACD and MACD histogram (a difference between MACD line and Signal line) in a form of small rectangle. If MACD value is above zero (MACD is bullish). Rectangle border color is bullish (Navy by default).  If MACD value is below zero (MACD is bearish). Rectangle border color is bearish (OrangeRed by default). If MACD histogram is rising and above zero (Bullish histogram). Rectangle color is bull
«Dynamic Scalping Oscillator» — это продвинутый пользовательский индикатор Crypto_Forex, эффективный инструмент для торговли на MT4! — Новое поколение осцилляторов — смотрите изображения, чтобы узнать, как им пользоваться. — Dynamic Scalping Oscillator имеет адаптивные зоны перепроданности/перекупленности. — Осциллятор — вспомогательный инструмент для поиска точных точек входа в динамических зонах перепроданности/перекупленности. — Значения перепроданности: ниже зелёной линии, значения перекупл
Super Reversal Pattern Indicator Unlock the power of advanced pattern recognition with our Super Reversal Pattern Indicator. Designed for traders seeking precision and reliability, this indicator identifies one of the most effective reversal patterns in technical analysis, offering a significant edge in your trading strategy. Key Features: Non-Repainting Accuracy: Enjoy the confidence of non-repainting technology. Once a Super Reversal Pattern is detected, it remains static, providing consiste
TT MACD indicator
Tomislav Turcin
4.67 (9)
A classical MACD indicator where both the MACD line and the Signal line are displayed as lines. The difference between MACD and Signal line is displayed as a histogram. A user can change the color and thickness of histogram lines. So, histogram lines can be grouped into four different groups: positive ascending, positive descending, negative descending and negative ascending. Multi-currency Dashboard for the indicator is available  https://www.mql5.com/en/market/product/72354
FREE
Trend PRO Expert Advisor  is developed base on the PipFinite Trend PRO Indicator, the best indicators on the market so far. PipFinite  Trend Pro's smart algorithm detects the trend, filters out market noise and gives entry signals with exit levels.  This EA open order when the indicator has buy/sell signals and set SL/TP follow the indicator rules. You can read more information about PipFinite Trend PRO indicator  here . Important Information   This EA will only work if you purchased  PipFinte
Индикатор Trend Stop обнаруживает смену тренда за выбранный период времени. Дополнительная функция – отображение оптимальных стоп-уровней. Устанавливайте стоп-ордера ниже линии Trend Stop при бычьем тренде и выше данной линии – при медвежьем. Trend Stop отображает максимальное/минимальное значение за последние N периодов. Расчет В зависимости от текущего тренда, это может быть максимальное значение за последние N периодов для медвежьего тренда или минимальное значение за последние N периодов дл
Индикатор Crypto_Forex "Auto FIBO Pro" - отличный вспомогательный инструмент в торговле! - Индикатор автоматически рассчитывает и размещает на графике уровни Фибоначчи и локальные линии тренда (красного цвета). - Уровни Фибоначчи указывают ключевые области, где цена может развернуться. - Наиболее важными уровнями являются 23,6%, 38,2%, 50% и 61,8%. - Вы можете использовать его для скальпинга на разворот или для торговли по зональной сетке. - Существует множество возможностей улучшить вашу текущ
Октавный Фрактальный Канал — Динамические Уровни Поддержки/Сопротивления по Ганну с Автоматическим Масштабированием. Индикатор строит динамический канал на основе фрактальной структуры ценового движения. Уровни канала адаптируются под текущий актив и таймфрейм, что позволяет использовать его на различных финансовых инструментах — от валютных пар до криптовалют и индексов. Индикатор может применяться в сочетании с другими техническими инструментами, например, с осциллятором RSI, для дополнительно
Представляем советник HFT KING — лучшего HFT-короля трейдинга! Эта полностью автоматизированная высокочастотная торговая система призвана революционизировать ваш торговый опыт благодаря передовому алгоритму и новейшим функциям. HFT King использует уникальное сочетание технического анализа, искусственного интеллекта, высокочастотной торговли и машинного обучения, чтобы предоставлять трейдерам надежные и прибыльные торговые сигналы. Передовая технология HFT King очень эффективна для определения т
Beta Signal   - индикатор предназначенный для поиска локальных экстремумов, определения текущей тенденции. В расчетах индикатора используется авторская методика. С помощью индикатора можно определять места возможного разворота цены желательно в направлении тенденции, но также с достаточной точностью и против нее. Также с помощью индикатора можно определять текущую тенденцию. Индикатор подходит для любых валютных пар, но для адекватного отображения показания необходимо, чтобы было достаточно исто
As traders, we know that identifying price contractions and consolidations is crucial for profitable trading. Fortunately, we have a powerful tool at our disposal. The indicator to trade price consolidation is designed to identify price contraction and alerts us on formation. It does this by analyzing historical price data and identifying price action patterns. The algorithm then uses this information to mark the zone , potential targets and liquidity lines, giving us valuable insights into mark
Matrix Arrow EA MT4
Juvenille Emperor Limited
5 (8)
Matrix Arrow EA MT4 - уникальный советник, который может торговать по сигналам MT4 индикатора Matrix Arrow с помощью торговой панели на графике, вручную или на 100% автоматически. Индикатор Matrix Arrow MT4 будет определять текущую тенденцию на ранних этапах, собирая информацию и данные от до 10 стандартных индикаторов, а именно: Индекс среднего направленного движения (ADX), Индекс товарного канала (CCI), Классические свечи Heiken Ashi, Скользящая средняя, Дивергенция схождения скользящих средни
TT Arrows is a trend based indicator that very succesfully predicts the start of the new trend.  The indicator is working with all trading instruments and in M5, M15, H1 and H4 timeframes. Up arrow signals a good time to enter a bullish trade while down arrow signals a good time to enter a bearish trade. The trade should be taken when the candle that has the arrow is closed. Following this strategy you will have have a high percentage of winning trades. Enjoy!
PipFinite Breakout EDGE
Karlo Wilson Vendiola
4.93 (488)
Преимущество, которого вам не хватает, чтобы стать профессионалом. Следуйте за пошаговой системой, которая обнаруживает самые мощные прорывы! Изучите рыночные модели, которые дают возможность получить значительную прибыль на основе проверенной и протестированной стратегии. Воспользуйтесь своим важным преимуществом Получите его здесь www.mql5.com/en/blogs/post/723208 Версия надежного советника Автоматизируйте сигналы Breakout EDGE с помощью "EA Breakout EDGE" ссылка У вас есть доступ к уник
Adaptive VP Gold — это автоматический торговый советник, разработанный для торговли золотом, преимущественно XAUUSD, с использованием адаптивного подхода к анализу рынка. Стратегия сочетает анализ Volume Profile, определение рыночного режима, Price Action, волатильность, импульс и встроенную систему фильтрации на основе машинного обучения. Советник определяет различные рыночные условия и соответствующим образом адаптирует логику входа. Торговый алгоритм включает отдельные механизмы для откатов,
Индикаторы [ZhiBiCCI] подходят для всех циклов использования, а также подходят для всех разновидностей рынка. [ZhiBiCCI] Зеленая сплошная линия - разворот бычьей дивергенции. Зеленая пунктирная линия - классическая бычья дивергенция. [ZhiBiCCI] Сплошная линия к красному - обратная медвежья дивергенция. Красная пунктирная линия - классическая медвежья дивергенция. [ZhiBiCCI] можно установить в параметрах (Предупреждение, Отправить почту, Отправить уведомление), установить на (true) для отправк
Советник Infinity является скальпером, сделки совершаются при пробитии уровней сопротивления и поддержки в сторону движения цены. Управление открытыми позициями осуществляется по нескольким сценариям / алгоритмам в зависимости от ситуации на рынке (фиксированный стоп-лосс и тейк-профит, трейлинг-стоп, удержание позиции, в случае индикации тренда и др.). Требования к брокеру Cоветник чувствителен к спреду, проскальзываниям и скорости исполнения сделок. Не рекомендуется использовать советник при
The Smart Divergence Dashboard is your ultimate tool for identifying high-probability trading opportunities. This cutting-edge indicator is meticulously designed to detect Regular Divergences, offering traders a clear and actionable advantage. MT5 Version -  https://www.mql5.com/en/market/product/120703/ Key Features: Real-time Divergence Detection: Instantly pinpoints Higher High/Lower Low and Oscillator Higher Low divergences across multiple currency pairs and timeframes using   Awesome Oscill
Noize Absorption Index - is the manual trading system that measures the difference of pressure between bears forces and bulls forces. Green line - is a noize free index that showing curent situation. Zero value of index shows totally choppy/flat market.Values above zero level shows how powerfull bullish wave is and values below zero measures bearish forces.Up arrow appears on bearish market when it's ready to reverse, dn arrow appears on weak bullish market, as a result of reverse expectation. S
Magical Arrow
Ranguni Abdulsamir Abdulmajid
Magical Arrow Indicator – Clear & Reliable Signals The Magical Arrow Indicator is a non-repainting, trend-following tool that gives you crystal-clear Buy and Sell signals . It  high-probability reversals and entries . No more guesswork – just follow the arrows on your chart! The Magical Arrow Indicator is a powerful, easy-to-use trading tool that helps you catch the most profitable Buy and Sell opportunities in the Forex market. It is designed for beginners and professional traders , giving you
Индикатор поддержки и сопротивления для бинарных опционов Этот индикатор разработан специально для торговли бинарными опционами и отлично показывает откаты от уровней поддержки и сопротивления. Сигналы появляются на текущей свече. Красная стрелка, направленная вниз, указывает на потенциальную возможность продажи, а синяя стрелка, направленная вверх, предлагает возможности для покупки. Все, что вам нужно настроить, это цвет сигнальных стрелок. Рекомендуется использовать его на таймфреймах M1-M5,
EARLY REMINDER: The Starting price is 65 price will rise soon up to 365$ and then 750$ after first 10 copies of sales. Grab this offer now! Introduction Hello, traders! Welcome to the demonstration of the Forex Beast Indicator , a comprehensive tool designed to assist aspiring traders in navigating the complexities of the forex market. This indicator incorporates seven essential components to provide a well-rounded trading experience: Moving Averages Colored Zones Support and Resistance Levels
SnR Double Breakout Level MT4 by RWBTradeLab A clean, non-repainting breakout-confirmation indicator for MetaTrader 4, built for price action traders who want high-confidence Support/Resistance breakouts based on DOUBLE structure logic — two levels must form first, then price must break correctly. All from CLOSED candles only. What This Indicator Does The indicator detects Double Breakout key levels using a strict state machine: Internal Structure Levels - A Level: Green -> Red (Level = 1st
FREE
We do not want to make you confused with an imaginary high profit screenshot from Strategy Tester which has no relation/guarantee of future profit! We just want to tell you the real thing about our EA. TrendEx Pro has been developed to trade on Gold specially, combining multiple strategies algorithm to ensure Trend catching and trading on. It can identify both short and long trends and opens positions accordingly with excellent built-in risk management logic. There is no use of any dangerous met
С этим продуктом покупают
Currency Strength Wizard — очень мощный индикатор, предоставляющий вам комплексное решение для успешной торговли. Индикатор рассчитывает силу той или иной форекс-пары, используя данные всех валют на нескольких тайм фреймах. Эти данные представлены в виде простых в использовании индексов валют и линий силы валют, которые вы можете использовать, чтобы увидеть силу той или иной валюты. Все, что вам нужно, это прикрепить индикатор к графику, на котором вы хотите торговать, и индикатор покажет вам ре
Trend SniperX MT4
Sarvarbek Abduvoxobov
5 (6)
Trend Sniper X — это мультитаймфреймовый трендовый индикатор для MetaTrader 5, который помогает трейдерам точно и четко определять направление тренда и потенциальные точки разворота. Для MT5: https://www.mql5.com/en/market/product/181101 Информация о цене: Текущая цена является промо-ценой и может измениться по мере выхода новых обновлений и функций. Канал Code2Profit Освойте рынок с помощью мультитаймфреймового анализа! Как максимизировать процент побед с Trend Sniper X: ключевые правила и сове
M1 Sniper
Oleg Rodin
4.97 (30)
M1 SNIPER — это простая в использовании торговая система. Это стрелочный индикатор, разработанный для тайм фрейма M1. Индикатор можно использовать как отдельную систему для скальпинга на тайм фрейме M1, а также как часть вашей существующей торговой системы. Хотя эта торговая система была разработана специально для торговли на M1, ее можно использовать и с другими тайм фреймами. Первоначально я разработал этот метод для торговли XAUUSD и BTCUSD. Но я считаю этот метод полезным и для торговли на д
SIO Oscillator: самооптимизирующийся осциллятор дисбаланса семивариаций Купите индикатор и получите советник (EA) на его основе БЕСПЛАТНО. Большинство осцилляторов воспринимают любое движение цены одинаково. SIO разделяет давление покупателей и продавцов и измеряет дисбаланс между ними, показывая, какая сторона действительно контролирует рынок. Когда дисбаланс достигает экстремума, SIO выдаёт чёткий сигнал с уровнями входа, Stop Loss и Take Profit. Главное отличие SIO в том, что он не полагается
Gann Made Easy - это профессиональная, но при этом очень простая в применении Форекс система, основанная на лучших принципах торговли по методам господина У.Д. Ганна. Индикатор дает точные BUY/SELL сигналы, включающие в себя уровни Stop Loss и Take Profit. ПОЖАЛУЙСТА, СВЯЖИТЕСЬ СО МНОЙ ПОСЛЕ ПОКУПКИ, ЧТОБЫ ПОЛУЧИТЬ ТОРГОВЫЕ ИНСТРУКЦИИ И ОТЛИЧНЫЕ ДОПОЛНИТЕЛЬНЫЕ ИНДИКАТОРЫ БЕСПЛАТНО! Вероятно вы уже не раз слышали о торговли по методам Ганна. Как правило теория Ганна отпугивает от себя не только н
Advanced Supply Demand
Bernhard Schweigert
4.91 (302)
Специальное предложение – скидка 30% Этот индикатор является уникальным, качественным и доступным инструментом для торговли, включающим в себя наши собственные разработки и новую формулу. В обновленной версии появилась возможность отображать зоны двух таймфреймов. Это означает, что вам будут доступны зоны не только на старшем ТФ, а сразу с двух таймфреймов - таймфрейма графика и старшего: отображение вложенных зон. Обновление обязательно понравится всем трейдерам, торгующим по зонам спроса и пре
Этот индикатор представляет собой индикатор автоматического волнового анализа, который идеально подходит для практической торговли! Случай... Примечание.   Я не привык использовать западные названия для классификации волн. Из-за влияния соглашения об именах Тан Лунь (Тан Чжун Шуо Дзен) я назвал основную волну   ручкой   , а вторичную полосу волн —   сегментом   Ат. в то же время сегмент имеет направление тренда. Именование   в основном является трендовым сегментом   (этот метод именования буде
В настоящее время скидка 30%! Лучшее решение для новичка или трейдера-эксперта! Эта приборная панель работает на 28 валютных парах. Он основан на 2 наших основных индикаторах (Advanced Currency Strength 28 и Advanced Currency Impulse). Он дает отличный обзор всего рынка Forex. Он показывает значения Advanced Currency Strength, скорость движения валюты и сигналы для 28 пар Forex на всех (9) таймфреймах. Представьте, как улучшится ваша торговля, когда вы сможете наблюдать за всем рынком с помощ
This is a professional chart indicator designed for traders focused on stability and clear price action. It helps filter market noise and provides clear visual entry and exit zones for your trading decisions. Price Information: The current price is promotional and is subject to change as upcoming updates and new features are released. MQL5 public channel:  CLICK HERE for MT5:  Non-repainting MT5 version Core Features: Strictly Non-Repainting: The system is built with strict non-repaint logic. W
Scalper Vault — это мощная, полноценная торговая система, созданная для трейдеров, которые стремятся к стабильным результатам в внутридневной торговле. Этот высокоточный индикатор представляет собой комплексное, самостоятельное торговое решение, обеспечивающее аналитику профессионального (институционального) уровня как для торговли на рынке Forex, так и для работы с бинарными опционами. Пожалуйста, свяжитесь со мной после покупки, чтобы получить мои торговые советы, а также отличный бонус! Исклю
Представляем ON Trade Waves Patterns Harmonic Elliot Wolfe, передовой индикатор, разработанный для обнаружения разнообразных рыночных паттернов с использованием как ручных, так и автоматизированных методов. Вот как это работает: Гармонические паттерны: Этот индикатор может определять гармонические паттерны, появляющиеся на вашем графике. Эти паттерны важны для трейдеров, практикующих теорию гармонической торговли, как это описано в книге Скотта Карни "Гармоническая Торговля том 1 и 2". Независи
RFI LEVELS PRO   определяет разворотные конструкции и ключевые зоны возврата цены, где может появляться активность крупных игроков. Индикатор помогает увидеть формирование нового тренда, определить потенциальную точку входа и заранее контролировать уровни риска и прибыли. VERSION MT5     —   Максимальный потенциал индикатора раскрывается при совместном использовании с   TREND LINES PRO . Что показывает индикатор: Разворотные конструкции и уровни, которые активируются в начале нового тренда. Поте
ShapeRadar — индикатор классических графических паттернов ShapeRadar автоматически находит на графике классические фигуры технического анализа: двойные и тройные вершины и доньи, «голову и плечи» и её обратную версию, восходящие и нисходящие клинья, прямоугольники, треугольники, флаги и вымпелы. Когда цена закрывается за границей фигуры, индикатор рисует сам паттерн, точку входа, уровень стоп-лосса и цель, а на панели показывает сводку по всем найденным фигурам. Версия для MetaTrader 5:  https:/
PRO Renko System - это высокоточная система торговли на графиках RENKO. Система универсальна. Данная торговая система может применяться к различным торговым инструментам. Система эффективно нейтрализует так называемый рыночный шум, открывая доступ к точным разворотным сигналам. Индикатор прост в использовании и имеет лишь один параметр, отвечающий за генерацию сигналов. Вы легко можете адаптировать алгоритм к интересующему вас торговому инструменту и размеру ренко бара. Всем покупателям с удовол
SR Liquidity — это торговый индикатор, предназначенный для выявления скрытых зон, где концентрируется рыночная ликвидность и наблюдается наиболее сильная реакция цены. Эти особые зоны ликвидности выступают в качестве мощных уровней поддержки и сопротивления, предоставляя вам четкую картину того, где с наибольшей вероятностью произойдет разворот рынка. Вместо построения стандартных линий поддержки и сопротивления, индикатор SR Liquidity анализирует реальное поведение цены, выявляя зоны концентрац
Auto Optimized SpeedAngle — это система векторизации импульса институционального уровня, которая исключает подгонку под исторические данные (curve-fitting) за счет непрерывной форвард-оптимизации (Walk-Forward Optimization, WFO). Вместо того чтобы полагаться на статические входные параметры, которые теряют эффективность при смене рыночных режимов, индикатор динамически перекалибрует свои настройки, используя валидацию на вневыборочных данных (Out-of-Sample, OOS). Это гарантирует, что отображаемы
Professional Volume Profile Индикатор для MetaTrader 4, который строит горизонтальный профиль объема (Volume Profile) на графике цен. Показывает уровни с наибольшим количеством сделок, помогая находить зоны поддержки/сопротивления и оценивать баланс сил на рынке. Что показывает индикатор POC (Point of Control) — уровень с максимальным объемом торгов (красная линия). VAH / VAL (Value Area High / Low) — верхняя и нижняя границы зоны стоимости, где было совершено 70% объема (оранжевые пунктиры). Ги
Scalping Entry Points - ручная торговая система, которая может подстраиваться под движения цены и давать сигналы для открытия сделок без перерисовки. Направление тренда индикатор определяет центральным уровнем поддержки и сопротивления. Точечный индикатор предоставляет сигналы для входов и выходов. Подходит для ручной торговли внутри дня, скальпинга и бинарных опционов. Работает на всех тайм-фреймах и торговых инструментах. Индикатор дает несколько типов оповещений. Как использовать продукт Си
All in One package includes the  Oscillator Predictor ,  MACD Predictor ,  Thrust Scanner  and  Advanced Fibonacci  indicators which are mandatory for applying  Dinapoli  trade plans.  Please visit below links for detailed explanations of indicators. Advanced Fibonacci Indicator =>  https://www.mql5.com/en/market/product/52834 Thrust Scanner Indicator => https://www.mql5.com/en/market/product/52830 Overbought /Oversold Predictor indicator => https://www.mql5.com/en/market/product/52621 Macd P
Quantum Imbalance Profiles   — индикатор фаз баланса и дисбаланса. Он показывает, на каких ценах рынок проторговывал объём, какая сторона доминировала внутри этой зоны и через какие уровни цена затем расширилась импульсом. Классический профиль объёма отвечает на один вопрос: где проходила торговля. Он не показывает, какая сторона доминировала на каждой цене, чем закончилась проторговка и в какую сторону рынок из неё вышел. Quantum Imbalance Profiles строит профиль в режиме Volume Bid/Ask — объём
Индикатор для ручной торговли и технического анализа для Forex. Состоит из трендового индикатора с уровнем открытия торгового дня и стрелочного индикатора для определения точек входа. Индикатор не перекрашивается, работает по закрытию свечи. Содержит несколько типов оповещений для сигнальных стрелок. Можно настроить для работы на любом графике, торговом инструменте или тайм-фрейме. Стратегия работы базируется на поиске движений цены по тренду. Для совершения сделок " Buy ": Трендовая линия д
Индикатор силы, который измеряет движение цены для подтверждения тренда и силы. Продвинутый мультивалютный и мультитаймфреймовый индикатор, который позволяет одним взглядом на график увидеть все валютные пары в тренде , а также самые сильные и слабые валюты, движущие этими трендами. Этот индикатор интеллектуально анализирует движения цен 28 валютных пар одновременно на всех таймфреймах в режиме реального времени , поэтому вы всегда будете знать о самых сильных и слабых валютах в составе пары . C
Dark Support Resistance  is an Indicator for intraday trading. This Indicator is programmed to identify  Support and Resistance Lines , providing a high level of accuracy and reliability. Key benefits Easily visible lines Only the most important levels will be displayed Automated adjustment for each timeframe and instrument Easy to use even for beginners Never repaints, never backpaints, Not Lag 100% compatible with Expert Advisor development All types of alerts available: Pop-up, Email, Push
СЕЙЧАС СКИДКА 40% !!! Лучшее решение для новичка или трейдера-эксперта! Этот индикатор является уникальным, высококачественным и доступным торговым инструментом, поскольку мы включили в него ряд собственных функций и секретную формулу. Всего на ОДНОМ графике он выдает алерты по всем 28 валютным парам. Представьте, как улучшится ваша торговля, ведь вы сможете точно определить точку запуска нового тренда или возможность скальпирования! Построенный на новых базовых алгоритмах, он позволяет еще
M1 Arrow Scalping - показывает сигналы на периоде М1 , не перерисовывает точки входа и может работать на всех основных валютных парах + металлы (золото/серебро). Индикатор анализирует рынок с помощью алгоритмов определения ценовых закономерностей и показывает трейдеру точки разворота цены на графике. Красная точка показывает, что цена будет разворачиваться вниз, а синяя точка показывает, что цена будет разворачиваться вверх. Так же индикатор отправляет сигналы на телефон в виде PUSH уведомлений.
Breakout Force SMC — командный центр управления структурой рынка для MetaTrader 4. Индикатор автоматически находит слом структуры (BOS) и смену характера тренда (CHoCH). На каждом сигнале сразу строит план сделки: вход, четыре цели TP1–TP4 и стоп-лосс по ATR. И показывает прямо на графике, как часто эти цели достигались. Это не «всё в одном» с сотней функций. Индикатор делает одно дело: размечает структуру, считает уровни и честно ведёт статистику по собственным сигналам. Как это работает Находи
Scalp Arrow Exit Signals (MT4 Indicator) A powerful all‑in‑one MT4 indicator providing precise entries, exits, and re‑entries across any timeframe or trading style. The Scalp Arrow Exit Signals is a complete “black‑box” signal system engineered for MT4 traders who want clarity, speed, and reliability. It generates clean buy/sell arrows along with exit, re‑entry, retracement, and pull‑back entry signals — all supported by flexible alerts and customizable risk settings. Whether you scalp fast ch
Этот индикатор исследует ценовую структуру фракталов разных периодов, чтобы определить возможные точки разворота на рынке, предоставляя время позиционным трейдерам, которые уже имеют фундаментальную или техническую модель оценки. В отличие от своего младшего брата, Reversal Fractals , этот индикатор не пропустит развороты из-за выбранного периода и будет находить разворотные фракталы зигзагообразно, игнорируя те развороты, которые не несут достаточного импульса для начала устойчивого движения ц
Confluence Dashboard MT4 is a dashboard indicator for MetaTrader 4. One row per symbol shows six checks (EMA, ADX, MACD, RSI, SuperTrend, UT Bot) and a BUY, SELL or WAIT verdict, with alerts. You choose how many checks must agree before the verdict turns BUY or SELL, so you see at a glance which symbols line up on one timeframe. It places no orders and does not repaint. Rows use closed bars only, and one copy shows one timeframe. Standalone: everything is built in. You do not need to buy or inst
Quant Direction
Georgios Kalomoiropoulos
Quant Direction — это инструмент трехмерного анализа рынка. Он обеспечивает полностью объективный, основанный на алгоритмах анализ рынка, одновременно вычисляя точные процентные отклонения по нескольким параметрам. Разработанный с использованием передовых инструментов моделирования на основе искусственного интеллекта и тщательно протестированный, алгоритм предназначен для интерпретации рынка с уникальной точностью. Он может анализировать любую валютную пару или финансовый инструмент на вашей пла
Другие продукты этого автора
As traders, we know that identifying price contractions and consolidations is crucial for profitable trading. Fortunately, we have a powerful tool at our disposal. The indicator to trade price consolidation is designed to identify price contraction and alerts us on formation. It does this by analyzing historical price data and identifying price action patterns. The algorithm then uses this information to mark the zone , potential targets and liquidity lines, giving us valuable insights into mark
Dynamic Range and Target Indicator: Your Reliable Trading Partner Introducing an innovative indicator that revolutionizes how you analyze markets and make trading decisions. Whether you're a beginner seeking clear guidance or an experienced trader looking to enhance your strategy, this tool is designed to meet your needs.   Key Features: 1. Dynamic Range Determination: The indicator continuously analyzes the market, identifying the most recent significant price ranges. 2. Clear Support an
Market Sessionsync** is a cutting-edge trading session indicator designed to enhance your trading experience by visually breaking down the market's daily rhythm. With a compact window overlaid on your chart, this indicator provides a split-second understanding of the current trading session through: Basic setup: Set Difference between your local time and your broker time , set DST(Daylight Saving Time) ON or OFF , set timescale sync you want to use (Local, Broker, CET) - A vertical time marker
FREE
TrendXplorer indicator is designed to provide valuable insights into market trends, helping you navigate the dynamic world of trading with confidence. Key Features: Accurate Trend Analysis: TrendXplorer utilizes a special algorithm to analyze trends combined with price action. This enables easier trend detection and is less prone to change during price manipulation. Built-in Risk Calculator: Take control of your risk management with TrendXplorer's built-in risk calculator. This feature assesses
Assembler
Darko Licardo
5 (1)
Introducing Assembler:  The best value for money,  Designed for advanced traders and professionals, yet accessible for ambitious beginners ready to elevate their trading game. Great for ICT, SMC, TREND and breakout traders . Combining advanced analytics, a sleek graphical interface, and highly customizable features, Assembler empowers you to trade with precision, clarity, and confidence. Key Features of Assembler 1. Dynamic Graphical User Interface (GUI): A fully draggable, customizable interf
VWAP Trend Pro (Volume Weighted Average Price) is a versatile trading tool that can be used effectively in several ways: This is an advanced Volume Weighted Average Price indicator that revolutionizes your trading experience by dynamically changing colors across scanned timeframes, providing real-time trend insights. The intuitive right corner scanner with three simple squares represents Monthly, Weekly, and Daily trends, each bordered by the current trend color and with background color indicat
MATRIX Market Scanner Comprehensive Analytics Without the Complexity Our innovative, cell-based dashboard gives you a panoramic view of the market—letting you monitor multiple instruments and timeframes seamlessly. Its high level of customization delivers an intuitive, dynamic display that adapts to your trading style, empowering you to see the bigger picture and make smarter, faster decisions. New Update The latest update to the Indicator Matrix Market Scanner introduces a powerful new feature
VolaTrend - Smart Volatility Trend Analyzer Transform your trading with instant market condition recognition - know whether to trend trade or range trade at a single glance! What Makes VolaTrend Different? Tired of cluttered charts with multiple indicators? VolaTrend revolutionizes market analysis by combining three powerful volatility indicators into ONE intelligent system that gives you instant market clarity through a single, customizable button. No more guessing. No more chart clutter. Ju
The indicator to trade price consolidation is designed to identify price contraction and alerts us on formation. It does this by analyzing historical price data and identifying price action patterns. The algorithm then uses this information to mark the zone , potential targets and liquidity lines, giving us valuable insights into market behavior.  Traders can adjust parameters such as colors ,alerts types and how many  previously formed zones to display on chart . Furthermore, the indicator can
Фильтр:
cam028
6493
cam028 2024.02.01 12:16 

great product great customer service

Darko Licardo
1659
Ответ разработчика Darko Licardo 2024.02.01 12:34
Thank you. Your feedback is greatly appreciated.
Junaid Munawar
1062
Junaid Munawar 2023.04.26 12:03 

Currently testing it but this indicator paints a clear picture of market recommend

Darko Licardo
1659
Ответ разработчика Darko Licardo 2023.04.26 16:19
Thank you for the positive review! I am also using this indicator for some time and I am confident that it will continue to be a valuable tool for market analysis . Your feedback is greatly appreciated.
Ответ на отзыв