Assembler

5

Introducing Assembler:

 The best value for money, Designed for advanced traders and professionals, yet accessible for ambitious beginners ready to elevate their trading game.

Great for ICT, SMC, TREND and breakout traders

. Combining advanced analytics, a sleek graphical interface, and highly customizable features, Assembler empowers you to trade with precision, clarity, and confidence.


Key Features of Assembler

1. Dynamic Graphical User Interface (GUI):

  • A fully draggable, customizable interface that fits seamlessly into your workflow.
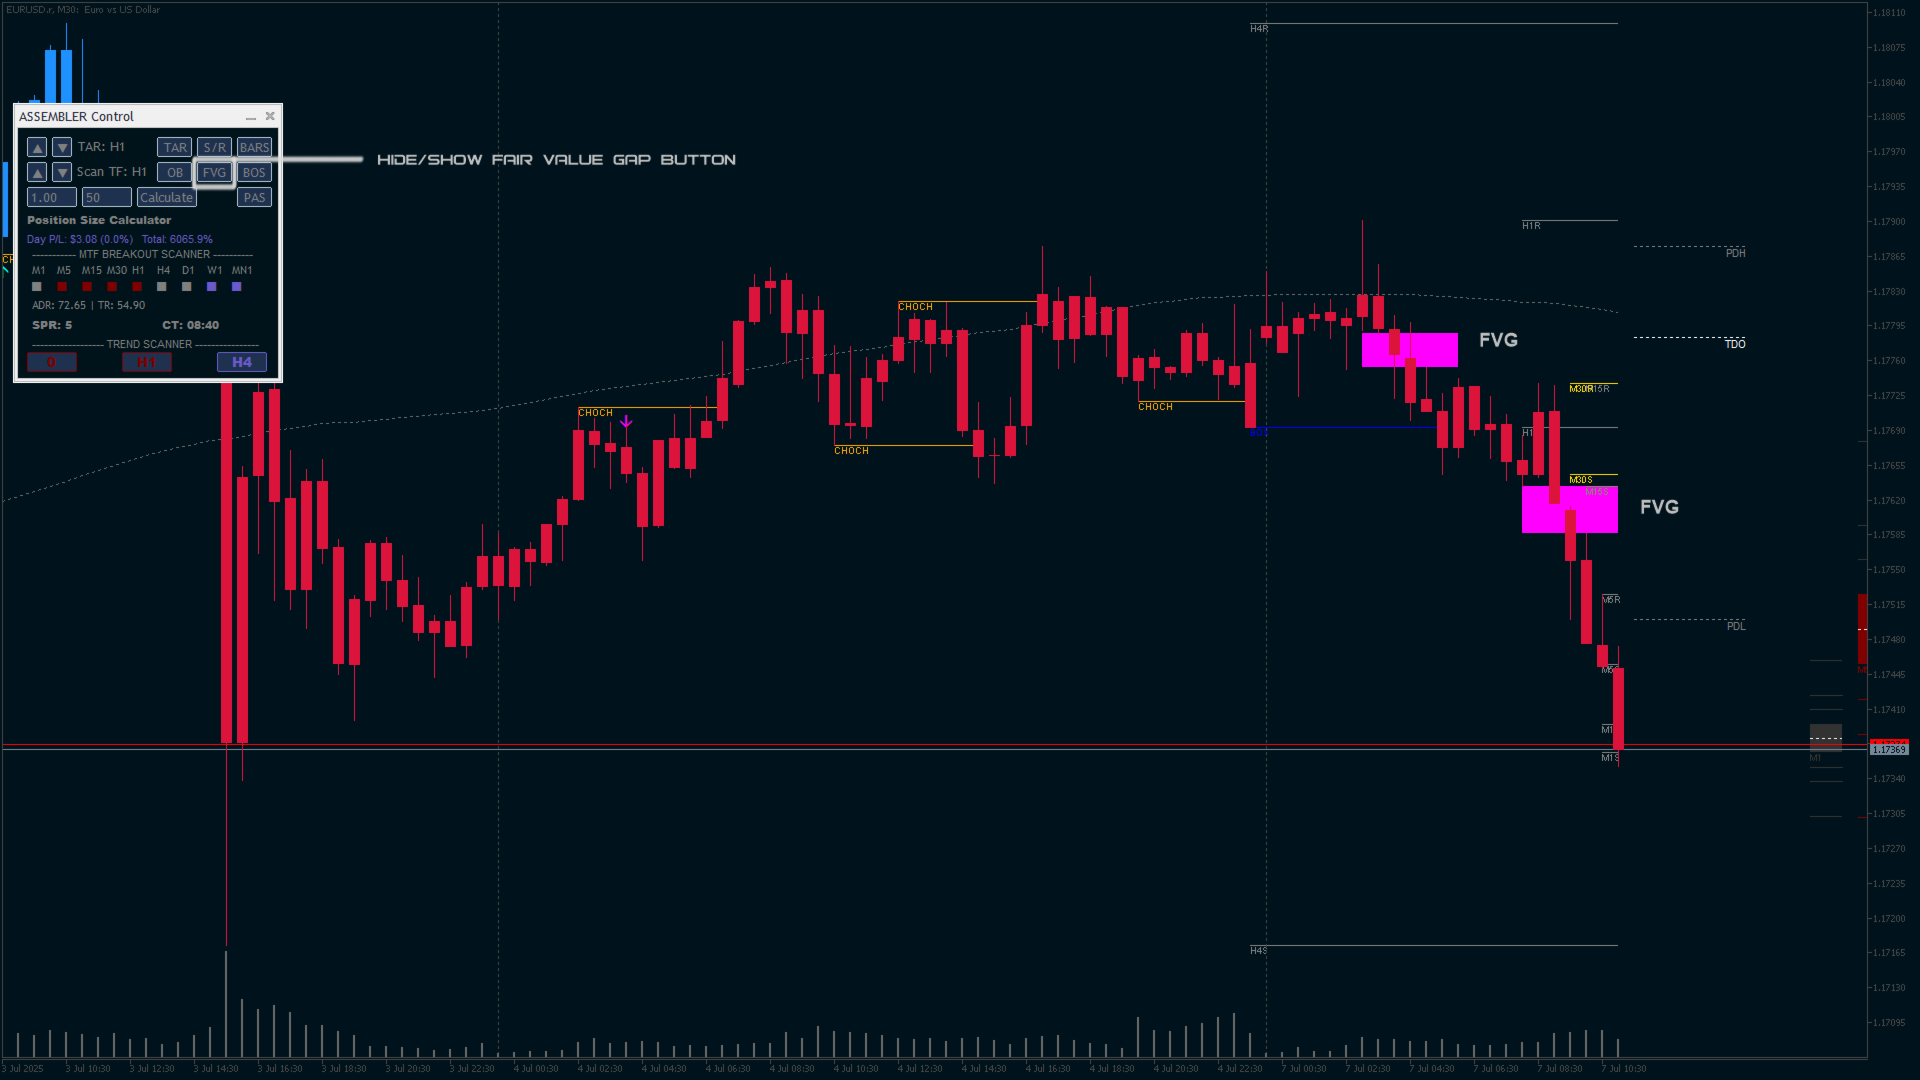
  • Toggle key elements such as Order Blocks, Targets, Support & Resistance, Range Bars, and Break of Structure (BOS) with intuitive controls.

2. Advanced Alerts System:

  • Real-time Multi-Timeframe Breakout Alerts for immediate notification of price action across different timeframes.
  • Trend Change Alerts ensure you stay ahead of market reversals, giving you the edge in timing entries and exits.

3. Enhanced Risk Management:

  • Built-in Position Size Calculator to help you manage risk effortlessly.
  • Track daily and total profit/loss directly on the GUI, keeping you aligned with your trading objectives.

4. Multi-Timeframe Breakout Scanner:

  • A scanner with clear, color-coded arrows indicating breakout direction across multiple timeframes.
  • Quickly identify opportunities and detect whether the price is consolidating or breaking out.

5. Average Daily Range (ADR) Insights:

  • Monitor the current range against the ADR to assess market volatility.
  • Stay informed of spread conditions with dynamic coloring that highlights unusual spread widening.

6. Powerful Trend Scanner:

  • Displays trends for three selected timeframes with easy-to-read buttons.
  • Color-coded buttons and backgrounds distinguish between the current trend (text and border in current trend color) and newly confirmed trend changes (button color in new trend)
  • Visualize trends in three modes: Candlestick Coloring, Trend Line, or Bar Coloring for ultimate flexibility.
  • Clicking on a trend scanner buttons cycles through timeframes

7. Smart Chart Elements:

  • Automatically plots Support & Resistance levels, Order Blocks, FVG and Market Structure (BOS and CHOCH) for streamlined analysis.
  • Dynamically adjustable targets plotted near the current candle to guide your trading decisions.

8. Range Bars with Alerts:

  • Innovative Multi-timeframe Range Bars adapt dynamically, turning gray during consolidation and changing colors with breakout direction.
  • Integrated breakout alerts and clearly marked targets help you spot MTF alignment high-probability setups with ease.

9. Additional Market Tools:

  • Key level markers for Yesterday’s High/Low and Today’s Open provide immediate insight into market context.
  • A real-time Candle Timer ensures perfect timing for entries and exits.

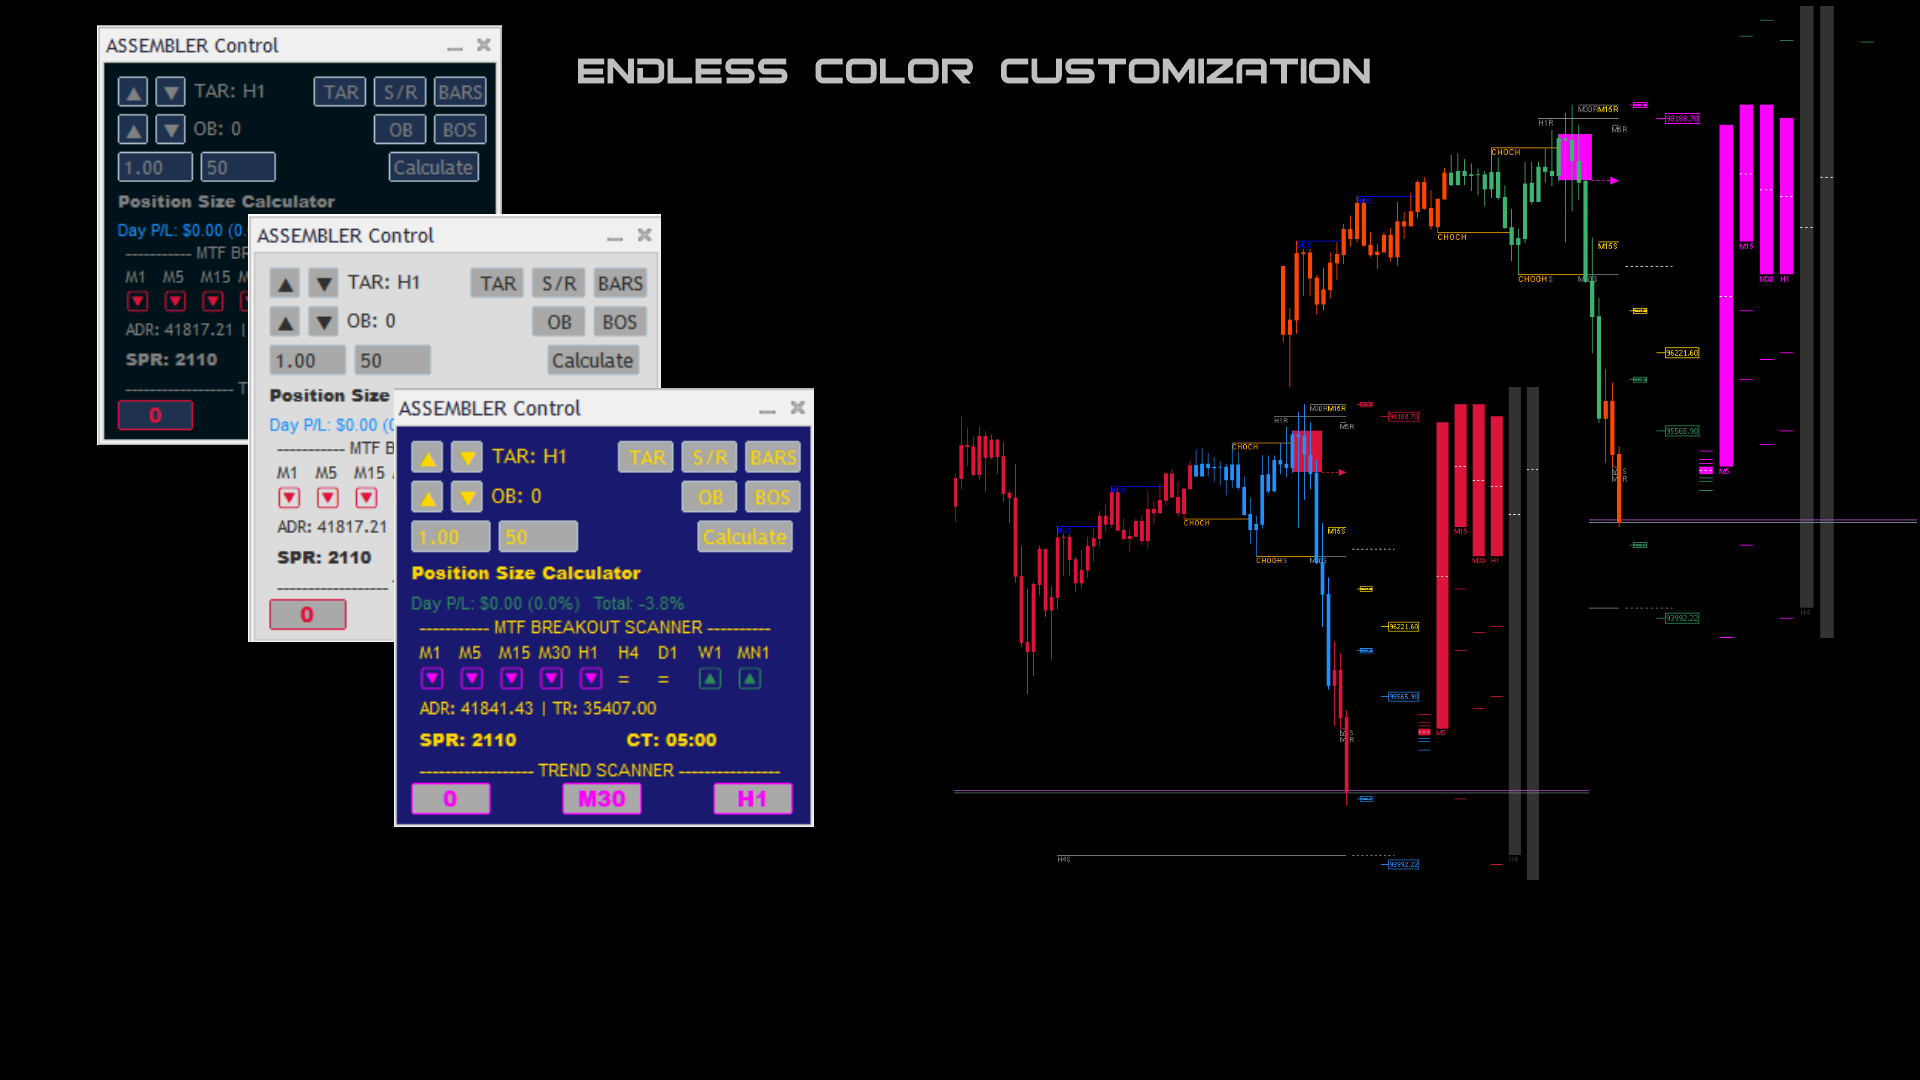
10. Fully Customizable:

  • Tailor the appearance to suit your preferences with adjustable colors, styles, and settings for all chart elements.

Why Choose Assembler?

Assembler isn’t just an indicator—it’s your complete trading assistant. It is designed to:

  • Simplify Complexity: Consolidate all critical tools into one intuitive package
  • Spot Multi-Timeframe Alignments: Effortlessly identify alignments and confluences across timeframes for high-confidence trades.
  • Enhance Decision-Making: Alerts for breakouts and trend changes keep you in tune with market dynamics.
  • Boost Customization: Fully adjustable settings ensure Assembler adapts to your trading style, not the other way around.

Take Your Trading to the Next Level

Assembler’s cutting-edge design and powerful features make it the ultimate tool for spotting high-probability setups and improving your trading accuracy.

With real-time insights, customizable alerts, and intuitive controls, you’ll trade smarter, faster, and more confidently.


----------------------------------------------------------------------------------------------------------------------------------------------------------------------------------------------------

Assembler Indicator User Guide


Welcome to the Assembler Indicator user guide. This manual will help you understand and configure the settings effectively, ensuring you make the most out of this advanced tool.


1. Color Settings


Assembler allows you to customize the colors of various elements such as trend lines, support/resistance, and targets. While not critical to functionality, setting colors to match your personal preferences or charting style can enhance readability and usability.

2. Multi Breakout Alerts

-  Alerts are triggered when breakouts occur across multiple timeframes.

- Settings:

  - Enable/Disable Alerts: Toggle alerts on or off.

  - Minimum Timeframes for Alert: Set how many timeframes must align for an alert.

- Tip: In case of higher timeframe breakouts (e.g., weekly/monthly), increase the number of timeframes monitored to avoid frequent alerts when trading lower timeframes (e.g., 15 or 30 minutes).


---


3. Risk Management Settings


- Default Stop Loss: The initial stop loss in pips, adjustable to suit your strategy.

- Risk Percent: The percentage of your account balance to risk per trade.

- Initial Balance: Used to calculate your daily and total profit/loss. Set this to match your trading account.


4. Trend Settings


- Trend Period: Defines the calculation period for trend plotting.

  - Default (50): Captures intermediate trends.

  - Higher Values (e.g., 100): Smooth out market noise and focus on major trends.

- ATR Period: Determines the Average True Range used in trend calculations. This value affects sensitivity.

- Display Style: Choose between:

  - Automatic: Adapts plotting style to your chart type (bars, candlestick, line).

  - Manual: Set your preferred plotting style.

The first button in trend scanner will plot arrow on chart and trigger alert on confirmed trend change.


---


5. Order Blocks


- Block Extension: Number of candles the order block rectangle extends.

- Extend to Current Bar: Enable to extend blocks to the current candle, creating wider like  support/resistance zones.

- Draw Lines to Current Time: Toggle to draw lines from order blocks to the current time.

- Candles to Use for Calculation: Defines the historical scope for calculating impact on order blocks and market structure . Lower values reduce resource usage.


---


 6. Market Structure (BOS/CHOCH)


- Break of Structure (BOS) and Change of Character (CHOCH) lines can be customized:

  - Colors: Set the color for each line type.

  - Line Style: Choose between solid, dashed, or dotted lines.


 7. Reference Lines

  Yesterday High/Low and Today Open Lines:

  - Customize their colors position and styles for better visibility.


8. Fractal Calculations


- Fractal Sensitivity: Adjust the number of candles used on each side of the fractal.

- Auto Fractal Candles: Automatically sets fractal sensitivity based on the current timeframe.

- Candle Close Outside Range: Choose whether market structure is determined by candle close or high/low extremes.


9. Lower Timeframe Display


- Show Lower Timeframes: Toggle the visibility of ranges from timeframes lower than the current one.

- Impact: Affects range bar display on the right side of chart;


10. Spread Sensitivity


- Spread Sensitivity: Adjusts the threshold for identifying unusual spread widening.

- Visual Feedback: When spreads exceed the sensitivity level, they are highlighted in red, alerting you to potential volatility or illiquidity.

11. FVG

 Seamlessly detect Fair Value Gaps (FVGs) directly on the current chart. With the integrated control panel's timeframe scroll buttons


Tips for Optimal Use

1. Customization: Take advantage of the highly customizable settings to align the indicator with your trading style.

2. Alerts: Configure breakout and trend alerts to avoid unnecessary distractions while staying informed about critical market events.

3. Performance: Balance functionality and resource efficiency by adjusting settings such as candles for order block calculation and fractal sensitivity.


Assembler is a versatile, professional-grade tool that can empower traders at all levels. Use this guide to fine-tune its settings and elevate your market analysis to new heights!


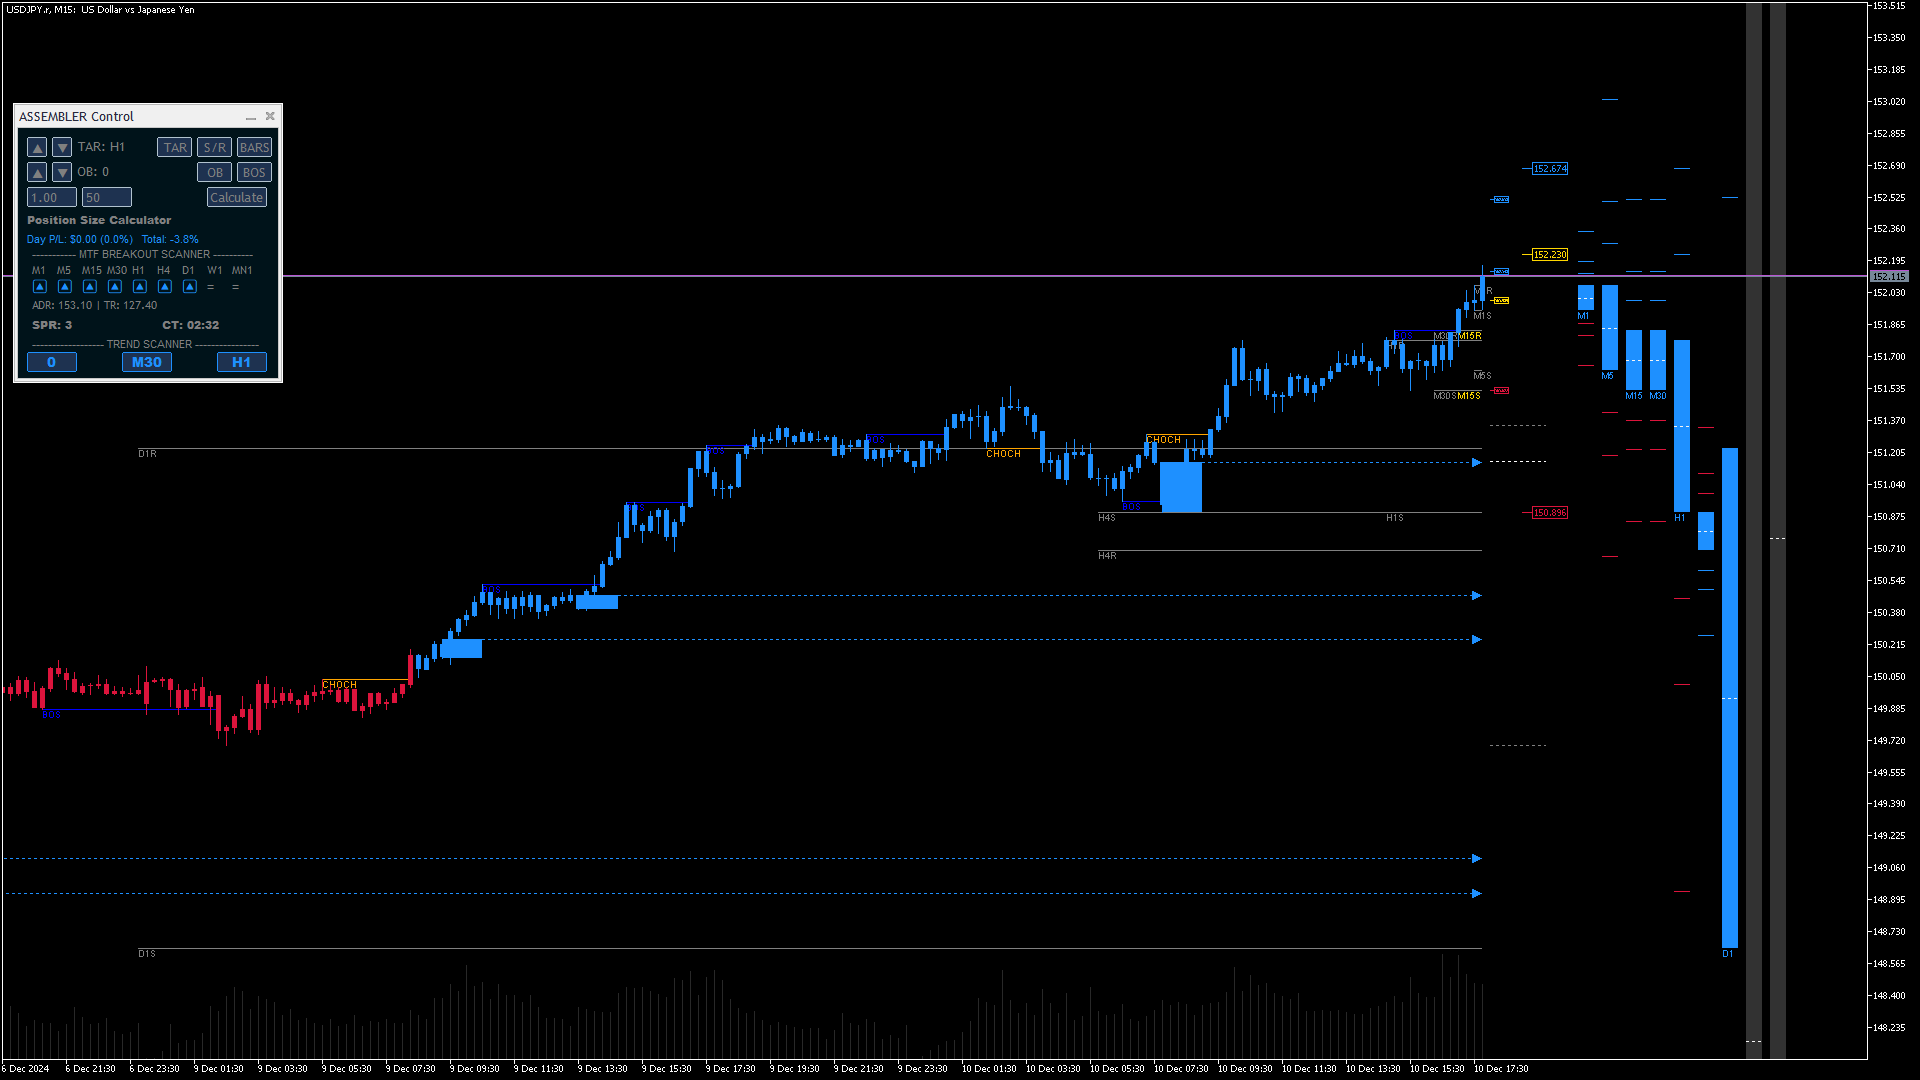
How to Interpret On-Chart Elements

  1. Trend Representation:
    The trend is displayed in three ways depending on initial settings:

    • Candle Colors: Candlesticks are colored based on the trend direction.
    • Bar Colors: Bars are shaded to reflect the trend.
    • ATR Line: A plotted ATR-based trend line in the trend color.
  2. Support and Resistance:
    Horizontal gray lines represent fractal-based support and resistance levels for each timeframe, labeled accordingly.

  3. Targets:

    • Price Labels: Targets are shown as price labels . Smaller price labels represent the current timeframe, while larger price labels are for higher timeframes. The red labels next to support/resistance lines indicate targets that can also be used to set stop-loss levels.
    • Dynamic Adjustments: Targets adjust direction if the price crosses the midpoint of the range, preparing for a potential breakout.
    • Target Probabilities:
      • Target 1 (T1): 50% of the range, with the highest probability of being hit.
      • Target 2 (T2): 100% of the range Also likely but may involve a retracement to the original range before being reached.
      • Target 3 (T3): Useful for news events or sudden breakouts after a narrow range.
    • Timeframe Adjustment: Use the arrow buttons next to the TAR label on the UI to change the timeframe for displayed larger targets.
  4. Maximizing Probability:
    Look for confluence between targets from different timeframes or alignment with other key elements, such as order blocks, today’s open, moving averages, or pivots. This is easily identified using the range bar targets on the right side of the chart.

This concise guide will help users interpret and utilize the on-chart elements effectively.

Tips:

  1. If the button does not register a mouse click, try moving the GUI to a location where there are no objects (e.g., trendlines, rectangles, etc.) behind it. This helps ensure that the button receives the click event properly.

  2. Market Entry Timing: Market entries on new trends have a greater potential for higher profit compared to entries near the end of trends. Identifying and entering the market at the beginning of a new trend can maximize profit opportunities.

  3. For Intraday trading use H1 and h4 targets in confluence with lower timeframes. 

Latest updates:

-we added new futures:

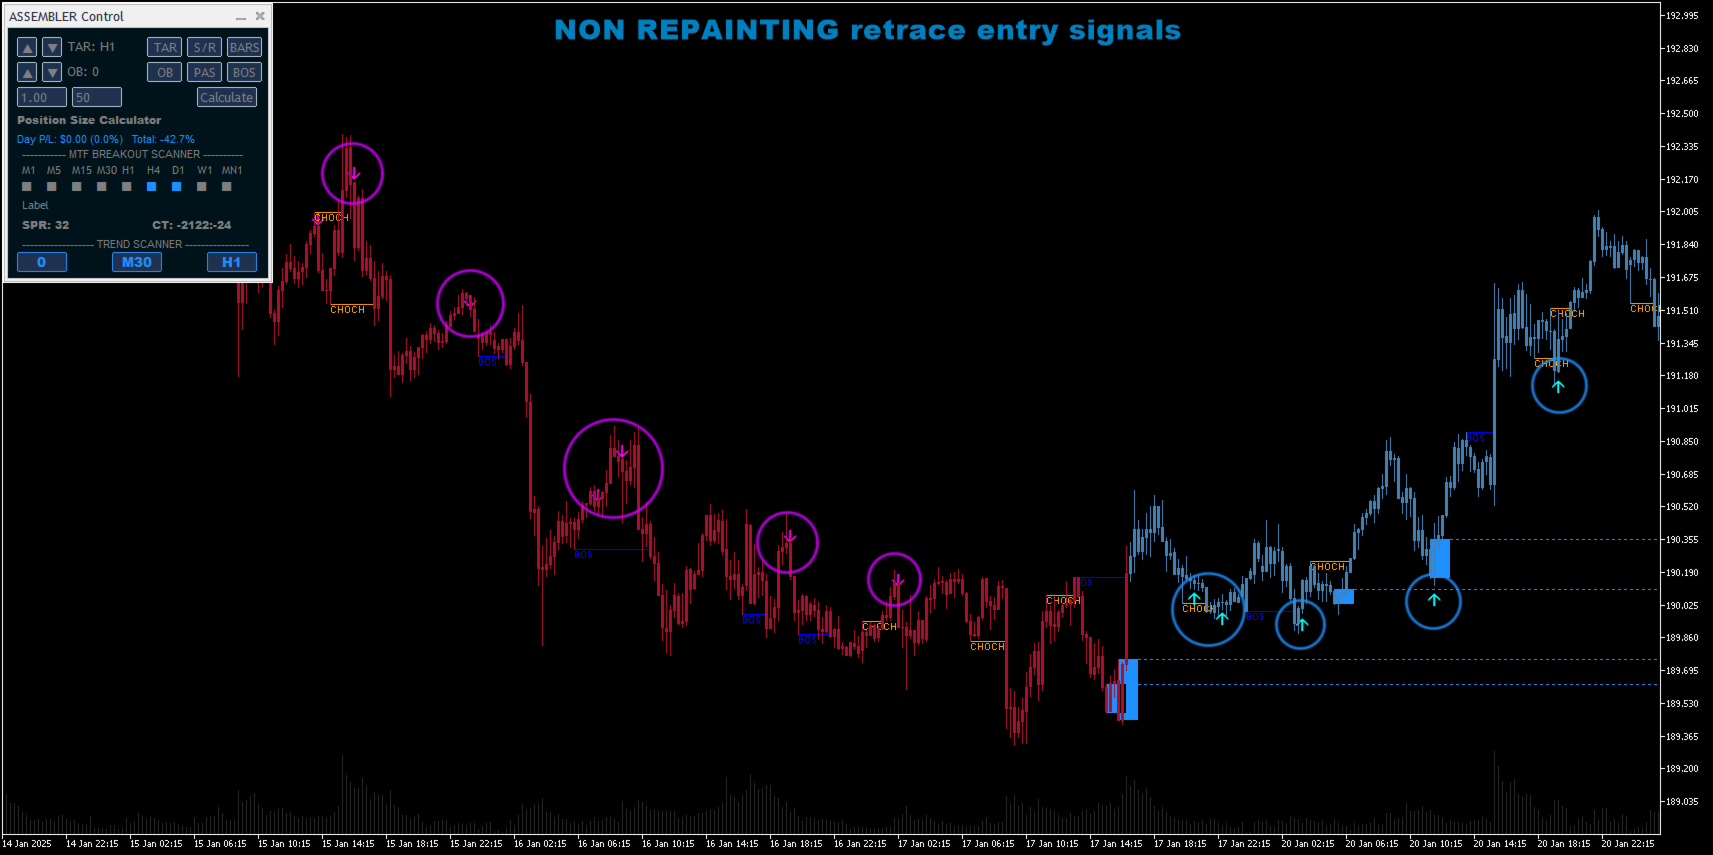
NON REPAINTING retrace / pullbacks entry signals

-enhanced trend algorithm

-bar targets change color only if there is a breakout in individual timeframes  

New Feature – Dynamic FVG Detection Across Timeframes Seamlessly detect Fair Value Gaps (FVGs) directly on the current chart. With the integrated control panel's timeframe scroll buttons, traders can now view FVGs from multiple timeframes without switching charts—saving time and enhancing workflow efficiency for ICT and SMC strategies.








评分 1
Rutt Tungkiratichai
2899
Rutt Tungkiratichai 2025.01.26 10:49 
 

good Indi for breakout trading

推荐产品
Weinstein Stage Analysis (MTF) – Professional Market Structure Indicator This indicator implements Stan Weinstein’s Stage Analysis in a clean, modern, and fully MTF-correct way for MetaTrader 5. It automatically identifies the four classical market stages: Stage 1 – Base / Accumulation Stage 2 – Advancing Trend Stage 3 – Distribution Stage 4 – Declining Trend Unlike many simplified versions, this indicator: Calculates the trend on a higher timeframe moving average Projects the correct stage onto
TrendlineBreak Alert
Yasir Zaidi
4 (2)
Get ALERTS for break of your TRENDLINES, SUPPORT LINES, RESISTANCE LINE, ANY LINE!! 1. Draw a line on the chart (Trend, support, resistance, whatever you like) and give it a name (e.g. MY EURUSD line) 2. Load the Indicator and input the Line Name the same name in Indicator INPUT so system knows the name of your line (= MY EURUSD line) 3. Get Alerts when Price breaks the line and closes Works on All Time frames and charts LEAVE A COMMENT AND IF THERE IS ENOUGH INTEREST I WILL WRITE AN EA WHICH W
FREE
Bid Price Timer Indicator — 精准计时,智能价格追踪! 使用 Bid Price Timer Indicator ,让您的交易更具 时间感与精准度 !这是专为重视 时机、精确与清晰度 的交易者打造的强大工具。 主要功能: 固定计时器显示 —— 始终显示在图表 右侧 (可自定义 X_Offset)。 动态价格追踪 —— 计时器会随 买价 (Bid) 实时 上下移动 。 自动重新定位 —— 当市场价格变化时,计时器会 自动跟随 新的价格水平。 可选水平线 —— 可添加一条 水平线 ,清晰显示 当前买价位置 。 ️ 实时倒计时 —— 每秒自动更新,显示 距离下一根K线的倒计时 ,让您不错过任何交易时机! 交易者喜爱的理由: 帮助您以 毫秒级精度 掌握K线收盘时间 让图表更 简洁、美观、信息丰富 非常适合 剥头皮、日内交易与技术分析 简洁、高效、现代化的设计,让 Bid Price Timer Indicator 成为您市场中精准控制时间的最佳助手!
Uno Quant Trader
Mark Joseph Borromeo Juan
UNO Quant Trader UNO Quant Trader is a premium market-bias and trade-planning indicator built for traders who want cleaner decisions, faster chart reading, and a professional dashboard view. This indicator uses a multi-layer mathematical market model designed to analyze price behavior, momentum pressure, imbalance zones, trend strength, market exhaustion, and high-probability trade areas. Instead of relying on emotion or random entries, UNO Quant Trader helps you read the market using structured
Pivot Point Supertrend (corresponds to Pivot Point Super Trend indicator from Trading View) Pivot Point Period:    Pivot point defined as highest high and highest low... input 2 = defining highest high and highest low with 2 bars on each side which are lower (for highest high) and are higher (for lowest low calculation) ATR Length  : the  ATR  calculation is based on 10 periods ATR Factor: ATR multiplied by 3
FREE
Veltrion Smart Fibonacci   is a clean automatic Fibonacci structure overlay for MetaTrader 5. It automatically detects recent swing highs and swing lows, then draws key Fibonacci retracement levels directly on the chart. The indicator is designed to help traders visualize market structure, retracement zones, and the golden zone without manually drawing Fibonacci tools. Key Features Automatic swing high and swing low detection Clean Fibonacci retracement overlay Horizontal Fibonacci levels for a
# MT5 挤压动量指标 使用功能强大的**挤压动量指标**,释放爆发式市场机遇。该指标专为 MetaTrader 5 平台专业开发。 这款先进的波动率和动量指标可帮助交易者在重大市场行情发生前识别低波动时期。该指标结合了布林带和肯特纳通道的优势,揭示市场何时处于“挤压”状态,并准备突破。 内置的动量柱状图使趋势方向和动量变化一目了然,帮助交易者自信而精准地入场交易。 ## 功能特性 * 高级挤压检测系统 * 专业 MT5 平台实现 * 突破爆发前检测波动挤压 * 动态颜色变化的动量直方图 * 挤压状态点,方便解读市场状况 * 整合: * 布林带 * 肯特纳通道 * 线性回归动量 * 早期趋势转变检测 * 简洁流畅的独立窗口显示 * 完全自定义设置 * 轻量级优化,运行流畅 ## 动量直方图颜色 * 亮绿色 → 上涨动量增强 * 深绿色 → 上涨动量减弱 * 亮红色 → 下跌动量增强 * 深红色 → 下跌动量减弱 ## 挤压点颜色 * 白色 → 挤压开启(低波动/突破设置) * 金色 → 挤压释放(潜在突破行情) * 红色 → 无挤
This indicator allows you to observe candle formation over a specific period, such as the Nasdaq, which starts at mid-hour. For example, for the first hour. The distance and size of the candle positioned on the right side can be adjusted. Color can also be assigned based on falling and rising candles. The needle can be made visible or invisible if desired. The body size can also be adjusted as desired.
FREE
MFOP Market Forecast
Oscar Josue Pin Bacuzoy
Develop this indicator for periods of 30 minutes or more, focus on getting market trends right and making sure they are met. MFOP v8.1 gets straight to the point: it scans the market and tells you exactly when there is enough strength to enter a trade. This indicator doesn't do magic, it uses mathematical algorithms to filter out market noise, not enter into false breakouts and show you clear BUY (blue arrow) and SELL (red arrow) opportunities. It is designed and optimized specifically to take
Full Description Overview Drawdown Controller Calculator Indicator is an advanced professional risk-management tool for MetaTrader 5 , specially designed for traders who use multiple running trades, pending orders, grid systems, and martingale strategies . This indicator allows you to see the future drawdown in advance — not only for currently running trades, but also for all pending orders combined , assuming they get triggered step by step. Instead of guessing or hoping, you will know ex
FREE
Dynamic Range and Target Indicator: Your Reliable Trading Partner Introducing an innovative indicator that revolutionizes how you analyze markets and make trading decisions. Whether you're a beginner seeking clear guidance or an experienced trader looking to enhance your strategy, this tool is designed to meet your needs.   Key Features: 1. Dynamic Range Determination: The indicator continuously analyzes the market, identifying the most recent significant price ranges. 2. Clear Support an
Link to our best products: LINK Link to our Trading Dashboard: LINK !!!!!!! Attention, you can find premium discounts by clicking on arrows!!!!!! Setting of this indicator candles mode: Show zones from the beginning Swing number for highs and lows Show background color Color of Premium Color of Discount show level 0% line show level 25% line show level 50% line show level 75% line show level 100% line The Premium and Discount concept is a core principle of Smart Money Concepts (SMC) used to i
Quantum Frequency Indicator MT5 Universal Market Frequency Analyzer for MT5 Trade Forex, Crypto, Stocks & Indices With Advanced Frequency-Based Signals Overview The Quantum Frequency Indicator (QFI) MT5 Version is a next-generation analytical tool designed to detect the hidden frequency structures within financial markets. Based on 14 years of research into market vibrations, price cycles and energy flow patterns, QFI provides traders with highly refined Buy and Sell zones across all major
The indicator monitors the Dinapoli MACD trend in multiple timeframes for the all markets filtered and shows the results on Dashboard. Key Features Indicator can be used for all markets Monitors every timeframe, from 1 Min to Monthly Parameters UseMarketWatch: Set true to copy all symbols available in market watch MarketWatchCount : Set the number of symbols that you want to copy from the market watch list. CustomSymbols: Enter the custom symbols that you want to be available in dashboard. Ti
CDV Candle Engine Pro
The Hung Ngo
5 (1)
CDV Candle Engine Pro is a MetaTrader 5 indicator designed to visualize Cumulative Delta Volume (CDV) directly on the price chart. It helps traders read market pressure more clearly by showing the balance between buying and selling activity in a clean, customizable layout. If you trade on MetaTrader 4, the MT4 edition is available here:  CDV Candle Engine Pro MT4 Public channel:   CLICK HERE Main Features CDV candle visualization on the main chart for easy reading in real time. Optional subwind
- Displays horizontal lines for Previous Day High (PDH) and Previous Day Low (PDL) on the chart. - Customizable line colors via input parameters. - Sends sound alerts, pop-up notifications, and mobile push notifications upon the initial crossover of PDH or PDL. - Alerts are triggered only once per crossover event; they re-trigger only if the price moves away and re-crosses after a specified minimum interval. - Automatically updates the PDH/PDL levels at the start of each new day. - All indicator
FREE
The indicator is designed to close positions on the market in time. For example: to take profits ahead of schedule if the price has not reached TakeProfit, and the market is turning around. The indicator analyzes the momentum, not the trend. He does not give any information about the trend. The indicator is well suited for finding divergence. The Ershov 38 Parrots indicator dynamically adjusts to the market and detects price movement impulses of medium and high amplitude. It almost does not rea
3 candel indicator in 1 !!! The 3 most important candel indicator in 1 packadge. Help trader in chart visualisation, prevent reversal !!! Doji : Gravestone Doji, Long Legged Doji, Dragonfly Doji. Engulfing : Bullish, Bearish. Hammer : red hammer, green hammer. Fully parametrable indicator icon color config and alarm. Free life time update !!! Just try our demo for free.
VP RSI Reversal Signal Arrows — Product Description Short Description VP RSI Reversal Signal Arrows is a clean MetaTrader 5 indicator that displays buy and sell reversal arrows when RSI exits oversold or overbought zones, with an optional moving average trend filter. Main Description VP RSI Reversal Signal Arrows is a visual technical analysis indicator for MetaTrader 5. It is designed for manual traders who want a simple RSI-based reversal assistant directly on the price chart. The indicator
The indicator scans for TD Sequential signals in multiple timeframes for the all markets filtered and shows the results on Dashboard. Key Features Dashboard can be used for all markets It can scan for signals on MN1, W1, D1, H4, H1, M30, M15 ,M5, M1 timeframes Parameters UseMarketWatch: Set true to copy all symbols available in market watch MarketWatchCount : Set the number of symbols that you want to copy from the market watch list. CustomSymbols: Enter the custom symbols that you want to be a
Buy Sell Trend KPG
Le Uyen Phuong Nguyen
4.25 (4)
Buy Sell Trend KPG - 用户指南 (MT5) Buy Sell Trend KPG 是一款适用于 MetaTrader 5 的多功能指标。它在图表上显示买入和卖出信号,提供声音提醒,并包含一个仪表板,可显示多个时间框架的趋势方向。 功能 实时信号以彩色箭头形式显示在价格图表上。 出现新信号时播放声音通知。 仪表板显示多个时间框架(从 MN1 到 M1)的趋势方向及汇总百分比。 该指标可在用户选择的任何时间框架上运行。 信号类型 绿色箭头 - 基本买入信号 红色箭头 - 基本卖出信号 深绿色箭头 - 额外买入信号 深红色箭头 - 额外卖出信号 趋势线用于指示动态支撑位和阻力位。 条形颜色有助于直观识别当前趋势。 仪表板信息 汇总百分比显示整体市场倾向。 当买入信号百分比高于 50% 时,仪表板指示上升趋势。 当卖出信号百分比高于 50% 时,仪表板指示下降趋势。 短横线 (-) 表示横盘市场。 建议用法(仅供参考) 使用 H1 或 H4 上的仪表板识别主要趋势方向。 在 M5 或 M15 时间框架上寻找匹配的信号。 当深绿色或深红色信号与 H1/H4 的主要趋势一致时,
FREE
XENON SUPERTRENDS : The Institutional Gold Standard for MT5 "Precision. Stability. Dominance. Experience the Truth in Every Tick." Welcome to the pinnacle of trend-following precision. XENON SUPERTRENDS Master Edition is not just an indicator; it is a high-performance analytical environment engineered for professional traders who demand absolute transparency and unshakeable accuracy. Specifically optimized for the world’s most volatile assets like Gold (XAUUSD), Global Indices (NASDAQ/DAX), an
Liquidity Trap Entry System — 挂载即用 价格突破关键位,你入场——然后立刻反转打掉你的止损? 这就是 流动性陷阱(liquidity trap) :大资金制造假突破来收集流动性,然后反转。本指标精准识别这一情景,并直接在图表上画好现成的交易计划。 极简——三步搞定 用默认设置 把指标挂到图表上 。 信号立即出现: Entry – SL – TP1→TP4 ,全部以线条画出。 下单。完成。 无需复杂调参,无需记几十个参数。 挂上就能用。 为何值得信赖 不重绘(Non-repaint) ——信号在K线收盘时确定并固定,之后绝不改变。 信号清晰 ——每个信号都是一个箭头加完整的 Entry/SL/TP,毫不含糊。 风险可控 ——每笔交易都有硬性止损。无马丁,无网格。 每售出 30 份价格上调一次——下一档价格为 $98。 趁现价尽快入手。 功能——每项一行 自动 SL 与 4 档 TP ——基于 ATR 的 SL;TP1–TP4 配有风险/回报填色区。 推荐 TP ——根据你图表的历史数据,标出最均衡的 TP 位。 MTF 扫描器 ——在 M15/H1/
Product Name: FXmans Pro SMC Structure Description: Navigate the markets with institutional precision. FXmans Pro SMC Structure is an advanced, algorithmically optimized indicator designed to decode Smart Money Concepts (SMC) directly on your chart. Built on a highly secure and lightweight engine, this tool avoids the lag of standard pivot points by utilizing Bill Williams' Fractal logic for laser-accurate market structure mapping. Whether you are a day trader or a swing trader, this indicator f
FlatOut Movings Robot:绝对掌控震荡盘整,自信领航趋势行情。 基于移动平均线的指标策略都有一个共同 text 里的噩梦:一旦市场切换阶段,您的本金就会开始缩水。传统的均线在震荡市(盘整期)中会产生数十次虚假交叉,而标准的过滤器又存在严重的滞后性。这导致您常常深夜顶着压力守在终端前,却偏偏在行情行将结束时才建仓入场。 本软件专为解决这一具体痛点而生。机器人能够持续扫描图表,像获取了订单簿的内部消息(内幕数据)一样读取市场结构。无论是在死气沉沉的横盘震荡中,还是在强劲的趋势脉冲行情下,它都能保持同样高效的交易表现。系统宛如一把手术刀,精准地将真实突破与进入交易通道的虚假洗盘剥离开来。 历经市场混沌时代的岁月检验 该软件的数学核心已通过了长达十年的无序价格风暴周期(各周期交替更迭)的严苛回测。该算法在设计之初就具备了抵御任何全球金融危机以及市场时代变革的能力。 脉冲猎手: 机器人在行情无回旋余地的临界点(即价格顺着阻力最小的方向飞速推进的节点)切入交易。入场点经过极度精准的计算,因此持仓头寸通常几乎不会承受有害的反向浮亏压力。 连胜主宰: 机器人字典里没有
Price Action Map MT5
Suvashish Halder
5 (1)
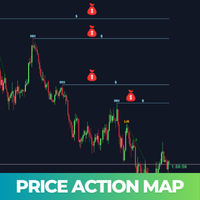
Price Action Map is an advanced trading indicator meticulously designed to provide clear visual insights into market structure by precisely labeling Higher Highs (HH) , Higher Lows (HL) , Lower Highs (LH) , and Lower Lows (LL) . Traders who find it challenging to accurately identify higher highs, lower lows, or understand different market phases will find this tool exceptionally valuable. Price Action Map significantly simplifies the analysis process, enabling traders at all skill levels to conf
ADR Pro
Oleksandr Myrhorodskyi
ADR Pro — Auto Adaptive Daily Range & Volatility Indicator (ATR + ADR + Alerts) Auto Adaptation. All Markets. No Guesswork . Enhance your trading decisions with precise ADR levels — for Forex, Crypto, Stocks, Indices, Metals, Energy, Commodities, and ETFs. Easy Setup Professional Features Lifetime Free Updates ADR Pro is your personal "volatility compass" that shows the real daily range boundaries for any asset. Forget manual calculations and constant parameter adjustments — the indicator
DoubleBB MARSI — 专为日内交易优化的全能图表工具 价格当前位置 · 市场情绪 · 入场信号 — 一屏掌握 一句话概述 DoubleBB MARSI 将日内交易所需的三大核心信息 — 每日参考价位 · RSI 市场情绪 · 双布林带信号 — 整合在同一张图表中,帮助交易者快速做出准确决策。 交易者获得的三大价值 DoubleBB MARSI 不仅是一个普通指标,而是覆盖整个日内交易周期的综合工具,所有信息一屏呈现。 1. "现在价格在哪里?" — 自动显示每日关键价位 图表上自动绘制三条关键线: · DO(Day Open · 今日开盘价) · PDH(Previous Day High · 前日最高价) · PDL(Previous Day Low · 前日最低价) 立刻判断当前价格处于多头还是空头优势区域。 "现在是在今日开盘价之上交易,还是之下?" "是否已突破前日高点,或跌破前日低点?" → 看一眼图表,1 秒钟内得出答案。 获得收益: · 节省判断方向的时间 · 设置止损 / 止盈时拥有清晰参考 · 立刻区分震荡区间与趋势行情 2. "现
Pattern Builder Pro — MetaTrader 5 自定义摆动形态扫描器 Pattern Builder Pro 是一款 MetaTrader 5 指标和市场扫描工具,允许交易者手动绘制任意自定义摆动形态(swing pattern),并在市场观察窗口的所有品种、多个时间周期上实时扫描相似的价格形态。与仅支持头肩形、三角形、旗形等固定形态的传统图表形态指标不同,这款 MT5 形态识别工具让您自行定义价格行为形态——任意数量的摆动点、任意形状——并通过包含 11 项加权指标的相似度引擎(含动态时间规整 DTW 与普氏分析 Procrustes)实时查找匹配设置。 主要功能: 交互式形态绘图板,基于 XY 网格,可像素级精确放置摆动点 多指标相似度引擎:几何形状、角度序列、斜率、回撤比例、扩展比例、摆动数量比、宽高比、趋势方向、结构顺序与波段振幅顺序 可选启用动态时间规整(DTW)与普氏分析,实现与尺寸、方向无关的形态匹配 当日最高价/最低价(HOD/LOD)点验证,精确过滤交易设置 异步市场扫描——可在 M5 至 D1 多个周期扫描数百个品种而不卡顿终端 可排序、分页的
N/B: All our product purchase comes with our free ‘’DAILY   SCALPER EA’’ -   bit.ly/4qlFLNh Whatsapp Developer for yours after successful purchase PROFESSIONAL DOUBLE TOP/BOTTOM PATTERN SCANNER The Ultimate Reversal Trading System for Forex & Crypto Traders  TRANSFORM YOUR TRADING WITH INSTANT PATTERN RECOGNITION Are you tired of missing profitable reversal setups? Exhausted from staring at charts for hours, trying to spot double tops and bottoms? Frustrated with false breakouts and misse
该产品的买家也购买
Neuro Poseidon MT5
Daria Rezueva
4.8 (54)
Neuro Poseidon is a new indicator by Daria Rezueva. It combines precise trading signals with adaptive TP/SL levels - creating best possible trades as a result! Message me and get  Neuro Poseidon Assistant  as a gift to automize your trading process! What makes it stand out? 1. Proven profitability on all assets and timeframes 2. Only confirmed BUY and SELL signals present on the chart 3. Adaptive TP & SL levels generated by the software for each trade 4. Easy to understand - suitable for al
M1 Quantum MT5
Hamed Dehgani
4.6 (10)
使用 M1 Quantum 的实盘交易信号 : 信号 (交易由 Quantum Trade Assistant 自动 执行,并作为本产品 免费 提供。) 价格计划: 当前价格: $169 (早期用户优惠) 下一阶段计划价格: $189 计划零售价: $299 开发者提示: 购买后请联系我,以获取 最新推荐的参数设置文件(Set File) 、交易建议,以及加入 VIP 支持群组 ,与其他 M1 Quantum 用户交流经验。 常见问题 - 设置文件 - 安装指南 M1 Quantum 是一款专业的 M1 交易系统,提供快速且精准的交易信号,并内置止损(Stop Loss)、止盈(Take Profit)以及智能资金管理功能。 M1 Quantum 包含专业的资金管理系统,通过专注于 连续盈利交易 ,帮助交易者更快地增长账户资金。 M1 Quantum 指标 的主要特点 专为 M1 时间周期 和所有 主要货币对 设计 所有交易均配备止损和止盈 内置 资金管理功能 ,并指导交易者轻松执行交易计划 高胜率,高比例的 连续盈利交易 无重绘,无延迟 适合各种类型的交易者,简单易懂 要使用 M
UZFX {SSS} 超短线智能信号 v4.0 MT5 是一款无重绘的高性能交易指标,专为在快速波动的市场中需要精准、实时信号的超短线交易者、日内交易者和波段交易者设计。该指标由 (UZFX-LABS) 开发,融合了价格行为分析、趋势确认和智能过滤技术,可在所有货币对和时间周期内生成高概率的买卖信号、预警信号以及趋势延续机会。 别再对交易犹豫不决了,开始遵循这一专为追求清晰、精准和纪律性市场执行的交易者设计的结构化信号系统吧。 我的建议* 最佳时间周期:15分钟及以上。 {H1} 是我的最爱。而且效果令人惊叹……!! 更新后的主要功能 • 自动买入和卖出信号检测 • 先进的反转识别逻辑 • 潜在市场反转前的早期预警信号 • 趋势延续确认信号 • 内置风险管理功能,包含入场点、止损点、TP1、TP2和TP3水平 • 完全可自定义的风险回报比 • 实时警报、声音提醒和移动端推送通知 • 带交易建议的专业信息面板 • 适用于所有MT5交易品种和时间周期 • 界面简洁、轻量且用户友好 为什么交易者选择 UZFX SSS? 大多数交易者亏损的原因在于入场过晚、平仓过早,或者缺乏明确的交
Divergence Bomber
Ihor Otkydach
4.9 (92)
购买该指标的每位用户将额外免费获得以下内容: 原创工具“Bomber Utility”,该工具会自动跟踪每一笔交易,设置止损和止盈点,并根据策略规则自动平仓; 适用于不同交易品种的指标设置文件(Set 文件); 三种不同风险模式下的 Bomber Utility 设置文件:“最低风险”、“平衡风险” 和 “观望策略”; 一套详细的 视频操作手册,帮助您快速完成安装、配置并开始使用本交易系统。 注意: 要获取以上所有赠品,请通过 MQL5 的私人消息系统联系卖家。 我为您介绍原创的自定义指标 “Divergence Bomber”(背离轰炸机),它是一套基于 MACD 背离交易策略 的“全功能”交易系统。 该技术指标的主要任务是识别 价格与 MACD 指标之间的背离,并发出交易信号(包括推送通知),指示未来价格可能的运动方向。平均而言,这些信号的准确率超过 98%。有关该指标如何工作的详细说明,请观看本页面上的视频演示。 该系统使用 止损订单 和 动态回撤平仓机制 来管理交易。 Divergence Bomber 指标的主要特点: 支持交易的品种: AUDCAD、AUDCHF、AUDSG
Entry Points Pro for MT5
Yury Orlov
4.5 (146)
传奇回归:Entry Points Pro 10。 这款传奇指标曾 3 年稳居 MQL5 Market 前三,如今全面重启。 数百条热情好评(两个版本合计 589 条),每天有数千名交易者用它交易,演示版下载 31,000+   MT4+MT5  次。 五年来我读过你们的每一条评价——在第 10 版里,我没有给出许诺,而是把答案直接做进了产品。指标作者自 1999 年入市, 珍视诚信、自己的声誉和自己的客户 。 Entry Points Pro 给出的入场信号严格不重绘。 而且这一次不再只是作者的一面之词,而是可验证的事实:确认信号只在 K 线收盘后标出,自动化测试记录到 零重绘 (在 EURUSD、XAUUSD 和 BTCUSD 上共 2,486,568 次不变量检查——0 次违规)。测试方法完全公开——您可以在策略测试器中自行复现。 购买后请务必第一时间给我发私信。 我会发给您 扩展版说明书《交易者圣经》 ——使用本指标交易的完整指南——并告诉您如何免费获得 赠品:市场扫描器 ,它能同时分析多个品种和多个时间周期,并在一个界面上显示 Entry Points Pro 此刻在哪里表现
Quantum TrendPulse
Bogdan Ion Puscasu
5 (25)
介绍 Quantum TrendPulse   ,这是一款终极交易工具,它将 SuperTrend   、   RSI 和 Stochastic 的强大功能整合到一个综合指标中,以最大限度地发挥您的交易潜力。该指标专为追求精准和效率的交易者而设计,可帮助您自信地识别市场趋势、动量变化以及最佳进入和退出点。 主要特点: 超级趋势整合: 轻松跟随当前的市场趋势并乘上盈利浪潮。 RSI 精度: 检测超买和超卖水平,非常适合把握市场逆转时机,可用作 SuperTrend 的过滤器 随机精度: 利用随机振荡在波动的市场中寻找隐藏的机会, 用作超级趋势的过滤器 多时间范围分析: 从 M5 到 H1 或 H4,在不同时间范围内关注市场动态。 可定制的警报: 当您的自定义交易条件得到满足时收到通知,这样您就不会错过任何交易。 无论您是新手还是经验丰富的交易员,   Quantum TrendPulse 都能为您提供所需的优势,帮助您增强策略并自信地进行交易。借助这一强大的指标,将洞察力转化为利润 — 掌控您的交易! ***购买 Quantum TrendPulse,即可免费获得 Quantum Tr
M1 Sniper MT5
Oleg Rodin
5 (4)
M1 SNIPER   是一款易于使用的交易指标系统。它是一个专为 M1 时间框架设计的箭头指标。该指标可以作为独立的系统在 M1 时间框架下进行剥头皮交易,也可以作为您现有交易系统的一部分使用。虽然该交易系统专为 M1 时间框架交易而设计,但它也可以用于其他时间框架。我最初设计此方法是为了交易 XAUUSD 和 BTCUSD。但我发现这种方法在其他市场交易中也同样有用。 指标信号既可以顺势交易,也可以逆势交易。我教授一种特殊的交易技巧,帮助您利用指标信号进行双向交易。该方法基于使用特殊的动态支撑位和阻力位区域。 购买后,您可以立即下载 M1 SNIPER 箭头指标。此外,我还为所有 M1 SNIPER 工具用户免费提供下方屏幕截图所示的 Apollo Dynamic SR 指标!这两个指标的组合可以帮助您更轻松、更准确地利用 M1 时间框架进行交易。 购买后请联系我,免费获取交易提示和奖励指标! 祝您交易成功!
ARIPoint
Temirlan Kdyrkhan
1 (1)
ARIPoint is a powerful trading companion designed to generate high-probability entry signals with dynamic TP/SL/DP levels based on volatility. Built-in performance tracking shows win/loss stats, PP1/PP2 hits, and success rates all updated live. Key Features: Buy/Sell signals with adaptive volatility bands Real-time TP/SL/DP levels based on ATR Built-in MA Filter with optional ATR/StdDev volatility Performance stats panel (Success, Profit/Loss, PP1/PP2) Alerts via popup, sound, push, or email Cu
介绍     Quantum Breakout PRO   ,突破性的 MQL5 指标,正在改变您交易突破区域的方式!由拥有超过13年交易经验的资深交易员团队开发,     量子突破 PRO     旨在通过其创新和动态的突破区域策略将您的交易之旅推向新的高度。 量子突破指标将为您提供带有 5 个利润目标区域的突破区域的信号箭头,以及基于突破框的止损建议。 它既适合新手交易者,也适合专业交易者。 量子 EA 通道:       点击这里 重要的!购买后请私信我领取安装手册。 建议: 时间范围:M15 货币对:GBPJPY、EURJPY、USDJPY、NZDUSD、XAUUSD 账户类型:ECN、Raw 或 Razor,点差极低 经纪商时间:GMT +3 经纪商:IC Markets、Pepperstone with Raw 和 Razor 的点差最低 规格: 不重漆! 最多 5 个建议利润目标区域 建议止损水平 可定制的盒子。您可以设置自己的 Box Time Start 和 Box Time End。 接触 如果您有任何疑问或需要帮助,请通过私人消息与我联系。
The Oracle Pro
Ottaviano De Cicco
5 (1)
The Oracle Pro:用于 MT5 的合成多周期偏向引擎 ️ 夏季上市优惠 — 早期买家可以 199 USD 获得 The Oracle Pro。价格将随关注度上升;最终价格 399 USD。 The Oracle Pro 是一款面向高要求与专业交易者的 MetaTrader 5 高级多周期 偏向引擎 。它以纪律回答一个问题:当前每个周期的方向偏向是什么、强度如何、各周期之间的一致程度如何?一切仅在已收盘的 K 线上计算——绝不重绘。 The Oracle Pro 是一套多因子共识系统。它将专有指标与优化算法整合为单一而精密的共识向量,并在单个指标实例内,跨当前周期与更高周期的堆栈进行读取——而不是在多个图表上堆叠互不相关的工具。 它是 Oracle 共识方法的专业进化版:完整重建为高级操作控制台,面向希望在一个纪律化工作流中获得深度、多周期背景与背离洞察的交易者。 是偏向引擎,而非信号生成器 The Oracle Pro 明确自身定位。它是一款提供纪律化方向背景的 多周期多因子偏向指标 。它 不是 信号生成器:不承诺入场、出场或盈利。偏向是背景——你在其方向上交易自己的设置
货币强度向导是一个非常强大的指标,为您提供成功交易的一体化解决方案。该指标使用多个时间范围内所有货币的数据来计算这个或那个外汇对的力量。此数据以易于使用的货币指数和货币电力线的形式表示,您可以使用它们来查看这种或那种货币的力量。 您所需要的只是将指标附加到您要交易的图表上,该指标将向您显示您交易的货币的真实强度。该指标还向您显示买卖量压力的极值,您可以在顺势交易时利用这些压力。该指标还显示了基于斐波那契的可能目标。该指标可用于各种交易时间范围。该指标支持各种货币对的交易。   该指标为您提供所有类型的警报,包括推送通知。 购买后请联系我。我将与您分享我的交易技巧,并免费为您提供丰厚的红利指标! 祝您交易愉快,获利丰厚!
Btmm state engine pro
Garry James Goodchild
5 (4)
BTMM State Engine Pro is a MetaTrader 5 indicator for traders who use the Beat The Market Maker approach: Asian session context, kill zone timing, level progression, peak formation detection, and a multi-pair scanner from a single chart. It combines cycle state logic with a built-in scanner dashboard so you do not need the same tool on many charts at once. What it does Draws the Asian session range; session times can follow broker server offset or be set in inputs. Tracks level progression (L
TPA True Price Action indicator reveals the true price action of the market makers through 100% non-repainting signals strictly at the close of a candle! TPA shows entries and re-entries, every time the bulls are definitely stronger than the bears and vice versa. Not to confuse with red/green candles. The shift of power gets confirmed at the earliest stage and is ONE exit strategy of several. There are available now two free parts of the TPA User Guide for our customers. The first "The Basics"
Bill Williams Advanced
Siarhei Vashchylka
5 (11)
Bill Williams Advanced is designed for automatic chart analysis using Bill Williams' "Profitunity" system. The indicator analyzes four timeframes at once. Manual (Be sure to read before purchasing) Advantages 1. Analyzes the chart using Bill Williams' "Profitunity" system. Signals are displayed in a table in the corner of the screen and on the price chart. 2. Finds all known AO and AC signals, as well as zone signals. Equipped with a trend filter based on the Alligator. 3. Finds "Divergence Bar
ICT Pro
Robby Suhendrawan
Ultimate AIO ICT Concept Indicator for MT5 Master Smart Money Concepts Automatically Are you tired of spending hours manually charting your screens every single day? The AIO ICT Concept indicator is your complete all-in-one solution for mastering Smart Money Concepts. Designed to eliminate the guesswork and emotional fatigue of manual technical analysis, this powerful algorithmic tool automatically maps out the most critical price action elements right on your chart. Discounted   Price   !!    
PrimeScalping
Temirlan Kdyrkhan
PrimeScalping is a powerful trading companion designed to generate high-probability entry signals with dynamic TP/SL/DP levels based on volatility. Built-in performance tracking shows win/loss stats, PP1/PP2 hits, and success rates — all updated live. Key Features: Buy/Sell signals with adaptive volatility bands Real-time TP/SL/DP levels based on ATR Built-in MA Filter with optional ATR/StdDev volatility Performance stats panel (Success, Profit/Loss, PP1/PP2) Alerts via popup, sound, push, or e
Transaction Speed MT5
Ivan Stefanov
5 (4)
当然,以下是翻译成中文(简体)的版本: 该指标标出市场中显现出 交易兴趣 的区域,并随后显示 订单积累区域 。它的工作方式类似于大规模的订单簿。 这是为 大资金 打造的指标,性能卓越。市场中有任何兴趣,你都能通过它清晰看到。 (这是一个 完全重写的自动化版本 —— 不再需要手动分析。) 交易速度 是一个全新的概念指标,它显示了市场上大订单 何时 、 何地 聚集,并揭示了其背后的意义。它可以在 非常早期 就检测到趋势的变化。 在外汇市场,所谓的“交易量”实际上是误导性的,因为那指的是价格在单位时间内的变化,因此真正的名称应是“交易速度”。 一切都取决于我们如何思考、如何行动、如何分析。 改变分析范式至关重要。 该指标完全重构了外汇市场上“交易量”的概念,用逻辑方式重新定义并应用,从而成为一个 独特而精准的工具 。 使用方法: 默认情况下,指标处于 自动模式 ,可独立用于任何时间周期。如果你希望切换到手动模式,只需点击 Auto / Manual Mode 按钮即可。 在 手动模式 下,所有计算从 2025年1月1日 开始。你可以根据需要更改该日期,以查看不同的分析结果。 最优数据周期
Gem SIGNAL
Shengzu Zhong
5 (1)
GEM Signal Pro GEM Signal Pro 是一款適用於 MetaTrader 5 的趨勢跟隨指標,專為希望在圖表上獲得更清晰訊號、更有結構的交易設定,以及更實用風險管理的交易者而設計。 它不僅僅顯示一個簡單的箭頭,GEM Signal Pro 還能以更清晰、更易讀的方式呈現完整的交易思路。當條件確認完成後,指標可在圖表上顯示進場價、止損價與止盈目標,幫助交易者更有效率地評估交易設定。 運作方式 該指標首先根據其內部邏輯識別有效的初始訊號。 當確認條件滿足後,GEM Signal Pro 會在圖表上顯示完整的交易設定。這讓交易者可以更清楚地看到交易結構,並減少手動分析與計算的工作量。 圖表上的交易價位 對於已確認的訊號,GEM Signal Pro 可顯示: 進場價 止損價 止盈 1 止盈 2 止盈 3 風險報酬比 這讓交易設定更容易理解,也有助於讓圖表分析更有條理。 內建風險管理 風險管理是此指標設計的重要部分。 止損位基於近期市場結構,結合附近的擺動高低點與可選的 ATR 緩衝距離。這能讓交易價位更貼近當前市場條件,而不只是依賴固定距離。 圖表資訊面板 GEM Si
Azimuth Pro
Ottaviano De Cicco
5 (7)
Azimuth Pro V2:MT5合成分形结构分析与确认入场 概述 Azimuth Pro 是 Merkava Labs 推出的多层级波段结构指标。四层嵌套波段层级、锚定波段的VWAP、ABC形态识别、三时间框架结构过滤以及收盘确认入场——一个图表,一个从微观波段到宏观周期的完整工作流程。 这不是盲目的信号产品。它是一个以结构为先的工作流程,专为重视位置、背景和时机的交易者打造。 ️ 夏季促销 — 庆祝夏至与 The Oracle Pro 上市:Azimuth Pro 七折优惠,现价 279 美元(原价 399 美元)。限时夏季优惠。 1. V2的变化 合成多时间框架引擎 高时间框架分析从零开始重建,采用与Meridian Pro相同的专有合成架构。更清晰的HTF背景、稳定的实时行为、无经典MTF同步问题。合成引擎还解锁了 固定比率时间框架级联 (x2、x3、x4、x6)——不再在经纪商的固定时间框架之间任意跳转,您可以按图表时间框架的固定倍数分析结构,在每个尺度上保持相同的分形关系。 确认入场箭头 作为稳定且可恢复的执行层而设计的收盘确认箭头。当ABC设置形成且自适应确认逻辑
MT5 Indicator   See What the Market Is Really Doing. See the 3 Market Phases live in front of you (Contraction, Expansion, Trend) and take better   entries at the early stage of the Trend Phase.   Stop guessing. Start reading the market like the institutions and smart money do.   Apex Market Structure Pro for MT5 is a precision smart-money analysis tool that strips away the noise and shows you the true   structure beneath every candle: liquidity, structure shifts, accumulation zones, and t
Advanced Supply Demand MT5
Bernhard Schweigert
4.53 (15)
任何新手或专业交易者的最佳解决方案! 该指标是一款独特、高质量、且价格合理的交易工具,因为我们已经整合了许多专有功能和新公式。 依据此更新,您将能够显示双重时间帧区域。 您不仅可以显示一个较高的时间帧,还可以同时显示图表时间帧,加上更高的时间帧:显示嵌套时区。 供需双方所有交易者都会喜欢它。 :) 重要信息披露 高级供需的最大潜力,请访问 https://www.mql5.com/zh/blogs/post/720245   想象您的交易如何得以改善,是因为您能够精准定位入场或目标位吗? 构建于新的底层算法,它可以更轻松地识别出买卖双方之间的潜在失衡。 这是因为它以图形方式展示供需最强劲区域,及其过去的表现(显示旧区域)。 这些功能旨在帮助您更轻松地发现最佳入场区域和价位。 现在您可以针对您的交易品种和时间帧来优化和编辑区域强度! 高级供需指标适用于所有产品和时间帧。 它是一个新的公式,非常新的功能是两个区域强度函数可由用户输入进行调整! 这在交易中是一大优势。 当您学习如何使用专有功能,例如带有价格游离最小 X 因子的区域强度时,您能够判断该区域强劲与否。 供需区域用作警报触发器。
KURAMA GOLD SIGNAL PRO(MT5)— 7层过滤 · 自动止盈止损 · 质量评分 · 信号历史保存 | 完整的XAUUSD交易系统 实时不重绘。信号出现的瞬间,箭头、入场、止盈、止损当场锁定,之后绝不移动。你交易的就是这个实时信号。而且在v7.20中,每一个真正发出的信号都会自动保存,并在重启后精确还原。 购买者专属赠品 购买永久授权,即可免费获得 AI Zone Radar(价值$59)+ 完整PDF手册。在产品价格之外,额外附赠价值$59的赠品。购买后在MQL5上给我留言即可。 AI Zone Radar: https://www.mql5.com/en/market/product/175834 在黄金交易者社区中被实际使用,因精度与易用性而广受好评。 你的难题 —— 以及解决方案 黄金一天波动$30–$50。你知道机会就在那里。但这些情况是否似曾相识: - 入场太早,价格逆行$10后才朝你的方向
Trend Forecaster
Alexey Minkov
5 (8)
Trend Forecaster 是一款 MetaTrader 5 指标,可将突破信号、潜在反转区域分析、市场波动区间数据和可视化统计面板整合到同一个图表工作区中。 它可以显示 Buy 和 Sell 信号,跟踪 Average Range 和 Current Range,并且可以根据当前交易品种和时间周期自动调整 Sensitivity。也支持手动设置 Sensitivity。 该指标可用于外汇货币对、金属、股票、指数和加密货币。支持不同时间周期,M5 可以作为一个实用的起点。 主要功能 突破和反转区域分析 Trend Forecaster 会分析已识别区域附近的价格行为,并在内部突破条件满足时显示 Buy 或 Sell 信号。该指标可用于研究趋势延续和潜在反转区域。 多过滤器信号逻辑 该指标将多个内部过滤器整合为一个简单的工作流程。用户在开始分析前不需要配置大量技术参数。 Auto-Tune Sensitivity 该指标可以根据近期历史数据,自动为当前交易品种和时间周期计算 Sensitivity。这有助于在切换不同交易品种时减少手动设置。 手动设置模式 如果你更喜欢固定设置,或
Quant Direction MT5
Georgios Kalomoiropoulos
Quant Direction 是一款三维市场分析工具。它通过同时计算多个维度上的精确百分比偏差,提供完全客观的、基于算法的市场分析视角。该算法采用先进的人工智能建模工具开发,并经过全面测试,旨在以独特的精准度解读市场。它可以分析您平台上的任何货币对或金融工具。 无论您是短线 交易者、日内 交易者还是波段交易者,Quant Direction 都是您的理想之选。 交易者的真正优势 Quant Direction 的真正优势在于彻底消除情绪、屏幕疲劳和过度思考。它无需手动点击十几个图表来寻找方向并反复质疑自己的偏好,引擎即可在几毫秒内即时处理 8 个时间周期(从 5 个月到月线)。它能准确告诉你任何时刻谁在掌控市场,确保你始终朝着概率最高的方向进行交易。 市场分析的三个维度 该算法将市场分为三个不同的交易维度,为您提供完整的宏观和微观视角: 超短线交易分析: 捕捉即时、快速的动量变化和较低时间框架的执行点。 日内分析: 识别真实的、潜在的每日方向性偏差。 波动分析: 专注于宏观趋势,确保您不会与大盘机构的走势背道而驰。 独家评分引擎 Quant Direction 的底层采用了一套
Grabber System MT5
Ihor Otkydach
4.83 (24)
向您介绍一款优秀的技术指标——Grabber,它是一套即开即用的“全包式”交易策略。 在一个代码中集成了强大的市场技术分析工具、交易信号(箭头)、提醒功能和推送通知。 每位购买该指标的用户还可免费获得以下内容: Grabber辅助工具:用于自动管理已开仓位 视频操作指南:逐步教学如何安装、设置和使用该指标进行交易 原创Set文件:可快速自动配置,帮助实现最佳交易效果 忘掉其他策略吧!只有Grabber能够真正激励你在交易中攀登新高峰! Grabber策略的主要特点: 交易周期:从M5到H4 适用资产:任意,但我推荐我亲自测试过的品种(GBPUSD、GBPCAD、GBPCHF、AUDCAD、AUDUSD、AUDSGD、AUDCHF、NZDUSD、NZDCAD、EURCAD、EURUSD、EURAUD、EURGBP、EURCHF、USDCAD、USDSGD) 交易时间:全天候 24/7 交易效果:我分享自己的真实交易结果,并在此教学如何操作: https://www.mql5.com/ru/market/product/134563?source=Site+Market+MT5+Indic
KT Alpha Hunter Arrows MT5
KEENBASE SOFTWARE SOLUTIONS
大多数箭头指标只给你一个信号,然后让你自己去判断剩下的一切。KT Alpha Hunter Arrows 为你提供完整的交易计划。 每一个信号箭头出现时,都会同时绘制一套完整计划:入场线、止损位、四个止盈目标,以及实时优势判断,告诉你当前这个交易品种和时间周期是否值得交易。随附的 Trade Manager EA 会在你手动入场后负责后续执行,让你在市场波动剧烈、情绪干扰明显时也能保持交易纪律。不重绘。仅在K线收盘后确认信号。适用于 Forex、黄金、指数以及任何你在 MT5 上交易的品种。 核心功能 不重绘买入和卖出箭头,只在K线收盘后生成。 每个信号都会显示入场线、结构性止损位和四个止盈目标。 Edge Dashboard 会分别评估当前图表上的买入和卖出机会。 判断系统包括:No Edge、Marginal、Tradeable、Good 或 Strong。 一键 Auto Optimize 按钮可根据当前品种和时间周期自动优化设置。 完整套装包含 Trade Manager EA,并提供五种专为本指标设计的预设交易管理方案。 Prop Firm Risk Panel 可在图表上
Spike detector Green V2
Odete Argelio Simbine
Spike DETECTOR Green V2 Spike Detection System - Version 2 Non-repainting indicator optimized for high-volatility markets such as Boom, Crash, and Volatility Indices. Detects strong momentum moves (spikes) with low latency. What Changed in V2: Algorithm 47% more accurate than the previous version Improved anti-false signal filtering system Faster detection (0.7 candles on average) Control panel with real-time metrics Key Features: Non-repainting signals with clear visual arrows Confidence-based
A2SR MT5 版 指标:自动化实际供需 (S/R)。 + 交易工具。 Product description in English here. --   Guidance   : -- at   https://www.mql5.com/en/blogs/post/734748/page4#comment_16532516 -- and  https://www.mql5.com/en/users/yohana/blog 强大、真实、省时,助您做出更明智的交易决策。 + 兼容 EA 的对象。 主要优势 领先的实际 SR 水平(不滞后,不重绘) 自 2014 年以来,A2SR 在 MT4 平台上经过多年的可靠性验证 ,现已面向 MetaTrader 5 平台推出。 它凭借领先的、不重绘的指标,为交易者带来卓越的优势,帮助他们在价格触及支撑位和阻力位之前识别实际支撑位和阻力位。 A2SR 提前计算支撑位和阻力位——在价格触及支撑位和阻力位之前——让交易者能够自信地规划交易。 独一无二、真正意义上的理念。 A2SR 建立在一种从未在任何媒体上发布或分享过的独特方法之上, 重
Beast Super Signal MT5
Florian Zuercher
2.71 (7)
正在寻找可以帮助您轻松识别有利可图的交易机会的强大外汇交易指标? Beast Super Signal 就是您的不二之选。 这个易于使用的基于趋势的指标持续监控市场状况,寻找新的发展趋势或跳入现有趋势。当所有内部策略一致且彼此 100% 融合时,Beast Super Signal 会发出买入或卖出信号,无需额外确认。当您收到信号箭头警报时,只需买入或卖出。 购买后给我留言,让我加入我的私人 VIP 群组! (仅限购买完整产品)。 购买后给我发消息以获取最新的优化设置文件。 此处提供 MT4 版本。 在此处 获取 Beast Super Signal EA。 查看评论部分以查看最新结果! Beast Super Signal 根据您偏好的 1:1、1:2 或 1:3 风险回报率建议入场价、止损和获利水平,让您放心交易。这个 Beast Super Signal 是 100% 不可重新绘制的,这意味着它永远不会重新计算或重新绘制,每次都能为您提供可靠的信号。 Beast Super Signal 指标适用于所有时间范围,包括货币对、指数、商品和加密货币对。 Beast S
ACB Breakout Arrows MT5
KEENBASE SOFTWARE SOLUTIONS
3.5 (2)
ACB Breakout Arrows 指标通过检测特殊的突破形态,提供市场中的关键入场信号。该指标持续扫描图表中的价格动量,在价格出现重大变动前,提前提供精确的入场信号。 点击此处获取多品种多周期扫描器 - ACB Breakout Arrows MT5 扫描器 主要特点 指标自动提供止损和止盈价格。 内置多周期扫描仪仪表盘,可追踪所有时间周期的突破信号。 适用于日内交易者、波段交易者和剥头皮交易者。 优化算法提升信号精度。 特别设置的快速盈利线用于无亏损移动或短线目标。 支持胜率、盈亏比、平均利润等绩效分析指标。 无重绘,信号可靠。 交易确认 - 可使用 ACB Trade Filter 指标 来过滤低概率的交易信号。 强烈买入: 向上箭头 + 绿色柱状图 + 多头趋势。 强烈卖出: 向下箭头 + 红色柱状图 + 空头趋势。 当柱状图为灰色且趋势为震荡时,应避免交易。 (可选) -  使用  KT 支撑阻力水平指标  避免在重要支撑/阻力位附近入场。这类交易可能迅速变成亏损。 “一个成功交易者的目标是做出最好的交易。金钱只是附属。” —— 亚历山大·埃尔德 输入参数 历史
作者的更多信息
PA Analyzer
Darko Licardo
5 (2)
With PA analyzer you will see a different perspective of price action , once you have unlocked the full potential of it, this tool will be essential  part of your trading system. PA Analyzer enables market price analysis and automatically marks support and resistance in all time frames. This indicator makes it easy to see whether the price is in range or trend, and generates dynamic profit take targets for the current time frame and the next higher time frame. This allows you to find target con
Market Sessionsync** is a cutting-edge trading session indicator designed to enhance your trading experience by visually breaking down the market's daily rhythm. With a compact window overlaid on your chart, this indicator provides a split-second understanding of the current trading session through: Basic setup: Set Difference between your local time and your broker time , set DST(Daylight Saving Time) ON or OFF , set timescale sync you want to use (Local, Broker, CET) - A vertical time marker
FREE
As traders, we know that identifying price contractions and consolidations is crucial for profitable trading. Fortunately, we have a powerful tool at our disposal. The indicator to trade price consolidation is designed to identify price contraction and alerts us on formation. It does this by analyzing historical price data and identifying price action patterns. The algorithm then uses this information to mark the zone , potential targets and liquidity lines, giving us valuable insights into mark
TrendXplorer
Darko Licardo
TrendXplorer indicator is designed to provide valuable insights into market trends, helping you navigate the dynamic world of trading with confidence. Key Features: Accurate Trend Analysis: TrendXplorer utilizes a special algorithm to analyze trends combined with price action. This enables easier trend detection and is less prone to change during price manipulation. Built-in Risk Calculator: Take control of your risk management with TrendXplorer's built-in risk calculator. This feature assesses
Dynamic Range and Target Indicator: Your Reliable Trading Partner Introducing an innovative indicator that revolutionizes how you analyze markets and make trading decisions. Whether you're a beginner seeking clear guidance or an experienced trader looking to enhance your strategy, this tool is designed to meet your needs.   Key Features: 1. Dynamic Range Determination: The indicator continuously analyzes the market, identifying the most recent significant price ranges. 2. Clear Support an
VWAP Trend Pro
Darko Licardo
VWAP Trend Pro (Volume Weighted Average Price) is a versatile trading tool that can be used effectively in several ways: This is an advanced Volume Weighted Average Price indicator that revolutionizes your trading experience by dynamically changing colors across scanned timeframes, providing real-time trend insights. The intuitive right corner scanner with three simple squares represents Monthly, Weekly, and Daily trends, each bordered by the current trend color and with background color indicat
MATRIX Market Scanner Comprehensive Analytics Without the Complexity Our innovative, cell-based dashboard gives you a panoramic view of the market—letting you monitor multiple instruments and timeframes seamlessly. Its high level of customization delivers an intuitive, dynamic display that adapts to your trading style, empowering you to see the bigger picture and make smarter, faster decisions. New Update The latest update to the Indicator Matrix Market Scanner introduces a powerful new feature
Volatrend
Darko Licardo
VolaTrend - Smart Volatility Trend Analyzer Transform your trading with instant market condition recognition - know whether to trend trade or range trade at a single glance! What Makes VolaTrend Different? Tired of cluttered charts with multiple indicators? VolaTrend revolutionizes market analysis by combining three powerful volatility indicators into ONE intelligent system that gives you instant market clarity through a single, customizable button. No more guessing. No more chart clutter. Ju
The indicator to trade price consolidation is designed to identify price contraction and alerts us on formation. It does this by analyzing historical price data and identifying price action patterns. The algorithm then uses this information to mark the zone , potential targets and liquidity lines, giving us valuable insights into market behavior.  Traders can adjust parameters such as colors ,alerts types and how many  previously formed zones to display on chart . Furthermore, the indicator can
筛选:
Rutt Tungkiratichai
2899
Rutt Tungkiratichai 2025.01.26 10:49 
 

good Indi for breakout trading

回复评论