Знакомство с языком MQL5 (Часть 31): Освоение API и функции WebRequest в языке MQL5 (V)

Введение
И снова приветствуем вас в Части 31 серии "Знакомство с языком MQL5"! В предыдущих статьях мы рассмотрели основы API и функции WebRequest в языке MQL5. Я показал вам, как отправить запрос на сервер, получить ответ и отсортировать ответ сервера, чтобы извлечь важную информацию. В частности, в предыдущей статье мы получили свечные данные за последние 5 дневных свечей BTCUSDT, используя API Binance. Мы также обсудили, как распределять связанные данные по отдельным массивам, например цены открытия, максимума, минимума и закрытия. Имея эти организованные данные, вы можете создавать и советники, и индикаторы.
В этой статье мы сделаем еще один шаг и займемся более сложным проектом. После сортировки ответа сервера мы извлечем ключевые свечные данные из последних десяти 30-минутных свечей BTCUSDT. Но мы не просто извлекаем данные: эта статья заложит основу для создания индикатора, который визуализирует данные в свечном формате. Сначала мы соберем информацию о свечах, отсортируем ее и сохраним в файл, прежде чем создать пользовательский индикатор, который будет читать этот файл и использовать сохраненные данные свечей для немедленного отображения свечей на графике, потому что индикаторы не могут использовать функцию WebRequest напрямую в реальном времени. С помощью этого метода мы можем видеть данные API в MetaTrader 5 как полноценный график.
Запрос свечных данных из API
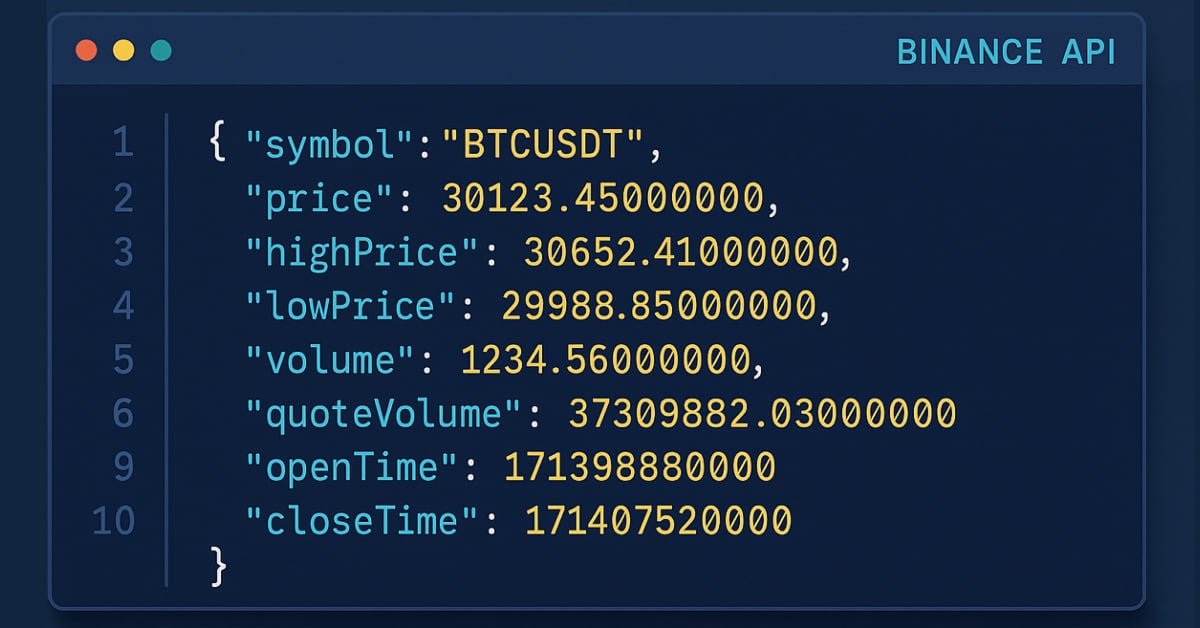
Чтобы получить свечные данные для нашего проекта, сначала нужно отправить GET-запрос к API Binance. Мы хотим получить цены открытия, максимума, минимума и закрытия – так же, как в предыдущей статье. Однако на этот раз мы сосредоточимся на предыдущих десяти 30-минутных свечах BTCUSDT. Мы будем использовать обработчик события OnTick в языке MQL5, чтобы повысить эффективность нашей программы. Это позволяет нашему коду выполняться каждый раз, когда приходит новый тик. Но поскольку это было бы избыточно и могло бы превысить лимиты API, мы не хотим отправлять запрос к API на каждом тике. Вместо этого мы будем отправлять запрос только один раз – для каждой новой 30-минутной свечи, которая формируется в MetaTrader 5.
Пример:
string method = "GET";
string url = "https://api.binance.com/api/v3/klines?symbol=BTCUSDT&interval=30m&limit=10";
string headers = "";
int time_out = 5000;
char   data[];
char   result[];
string result_headers;

datetime last_bar_time = 0;

//+------------------------------------------------------------------+
//| Expert initialization function                                   |
//+------------------------------------------------------------------+
int OnInit()
  {
//---

//---
   return(INIT_SUCCEEDED);
  }
//+------------------------------------------------------------------+
//| Expert deinitialization function                                 |
//+------------------------------------------------------------------+
void OnDeinit(const int reason)
  {
//---

  }
//+------------------------------------------------------------------+
//| Expert tick function                                             |
//+------------------------------------------------------------------+
void OnTick()
  {
//---
   datetime current_m30_time = iTime(_Symbol,PERIOD_M30,0);

   if(current_m30_time != last_bar_time)
     {

      WebRequest(method, url, headers, time_out, data, result, result_headers);
      string server_result = CharArrayToString(result);

      Print(server_result);

      last_bar_time =  current_m30_time;

     }

  }
Вывод:

Пояснение:
Чтобы сохранить наши данные и ответ сервера, сначала нужно задать метод, URL, заголовки, таймаут и переменные. Мы хотим запросить информацию у API Binance, поэтому методу нужно присвоить значение GET. В URL указана конечная точка для получения свечных данных по BTCUSDT; интервал задан как 30 минут и ограничен предыдущими десятью свечами. Поскольку Binance не требует дополнительных заголовков для этого публичного запроса, заголовки оставляем пустыми. Запрос будет ждать ответа от сервера до истечения таймаута в 5 секунд. Данные для передачи, ответ сервера и любые возвращенные заголовки хранятся в переменных. Дополнительно используется переменная для отслеживания времени последней 30-минутной свечи.
Функция инициализации подготавливает программу при запуске торгового советника. Этот этап гарантирует корректный запуск советника и готовность к обработке входящих данных, хотя в данном случае дополнительная подготовка не требуется. Аналогичным образом, функция деинициализации выполняется, когда советник удаляется, или график закрывается. Хотя здесь функция пустая, она предусмотрена на случай, если в будущем понадобится очистка.
Каждый раз, когда приходит новый ценовой тик, выполняется основная логика. Сначала советник определяет на графике время открытия текущей 30-минутной свечи. Затем, чтобы определить, началась ли новая свеча, он сравнивает это время с ранее зафиксированным временем свечи. Если это новая свеча, советник запрашивает самые свежие свечные данные из API Binance. После этого ответ сервера приводится к читаемому виду и выводится для проверки.
После того как данные получены, советник обновляет сохраненное время свечи до текущего. Это гарантирует, что запрос будет отправляться не на каждом тике, а только один раз для каждой новой 30-минутной свечи. Этот метод повышает эффективность советника, позволяя получать самые свежие свечные данные только при необходимости. Это удобно для разработки индикатора или советника, который зависит от данных внешнего API и при этом не делает лишних повторяющихся запросов.
Аналогия:
Представьте API Binance как обширную коллекцию книг. В каждой книге описаны самые свежие свечи, и каждая из них – это "снимок" рыночных цен. Наша цель – получить именно те книги, которые нам нужны. В нашем случае это предыдущие десять 30-минутных свечей BTCUSDT, и мы хотим упорядочить данные так, чтобы использовать их в будущем. Сначала мы подготавливаем наш "запрос" к библиотеке. Это похоже на то, как мы сообщаем библиотеке, какие именно книги нам нужны, а также символ (BTCUSDT), таймфрейм (30 минут) и количество томов (десять). Подобно тому как мы задаем таймаут для запроса, мы также выбираем, сколько времени готовы ждать, пока библиотека найдет книги.
Когда советник запускается, это похоже на то, как мы идем в библиотеку и готовимся делать заметки. Прежде чем мы начнем "забирать книги", нужен этап подготовки, чтобы убедиться, что все в порядке. Аналогичным образом, даже если на этот раз ничего делать не нужно, мы можем прибрать стол или вернуть ресурсы, когда покидаем библиотеку. Теперь представьте рынок как постоянно меняющиеся часы. Каждый тик – это как библиотекарь, который дает нам свежую страницу знаний. Мы не хотим запрашивать одни и те же книги снова и снова. Вместо этого мы смотрим на часы, чтобы понять, начался ли новый получасовой интервал. Если да, мы просим библиотекаря принести нам самые новые книги. Получив книги из библиотеки, мы записываем важную информацию в блокнот, чтобы использовать ее позже.
После того как данные записаны, мы используем стикер, чтобы отметить, когда в последний раз брали книги с полки. Это гарантирует, что мы не будем запрашивать те же самые книги снова до начала следующего получасового интервала.
Сортировка свечных данных для каждой свечи
Следующий шаг – разделить ответ сервера на отдельные свечи для каждого 30-минутного бара. Цены открытия, максимума, минимума и закрытия первой свечи объединяются. Аналогичный процесс выполняется для остальных свечей, чтобы гарантировать, что у каждого 30-минутного бара будет систематически собранный набор данных. Напомню, что в прошлой статье я говорил, что сначала нужно понять, как устроен формат JSON. Теперь, когда мы знаем, как это делает Binance, мы можем корректно упорядочить свечные данные. Binance возвращает свечные данные в виде массива массивов, например:
[
[array 1],
[array 2],
[array 3],
[array 4],
[array 5],
[array 6],
[array 7],
[array 8],
[array 9],
[array 10]
]
Каждый внутренний массив представляет одну 30-минутную свечу со всей информацией о ней. Следующий этап – отсортировать этот ответ сервера по отдельным свечам. Группируется вся информация для первой свечи, затем для второй и т.д., вплоть до последней. Формат ясно показывает, что лучший символ для разделения набора данных по каждой свече – закрывающая квадратная скобка, завершающая массив. Мы не можем использовать запятые, потому что они являются частью самих свечных данных, а это вызовет ошибки и перепутает числа.
Поэтому самый безопасный вариант – использовать закрывающую скобку. Следующий шаг – обрабатывать каждую свечу отдельно после того, как ответ сервера будет разделен на отдельные секции по свечам. Будут удалены и начальная квадратная скобка, и лишние символы, например, двойные кавычки. Такая очистка делает данные каждой свечи чище и проще, чтобы затем преобразовать их в точные значения, которые мы можем хранить в наших массивах.
Пример:string candle_data[]; string first_bar_data; string first_bar_data_array[]; string second_bar_data; string second_bar_data_array[]; string third_bar_data; string third_bar_data_array[]; string forth_bar_data; string fourth_bar_data_array[]; string fifth_bar_data; string fifth_bar_data_array[]; string sixth_bar_data; string sixth_bar_data_array[]; string senventh_bar_data; string seventh_bar_data_array[]; string eighth_bar_data; string eighth_bar_data_array[]; string nineth_bar_data; string nineth_bar_data_array[]; string tenth_bar_data; string tenth_bar_data_array[];
//+------------------------------------------------------------------+
//| Expert tick function                                             |
//+------------------------------------------------------------------+
void OnTick()
  {
//---
   datetime current_m30_time = iTime(_Symbol,PERIOD_M30,0);

   if(current_m30_time != last_bar_time)
     {

      WebRequest(method, url, headers, time_out, data, result, result_headers);
      server_result = CharArrayToString(result);

      Print(server_result);

      last_bar_time =  current_m30_time;


      int array_count = StringSplit(server_result,']', candle_data);

      //FIRST CANDLE
      first_bar_data = candle_data[0];
      StringReplace(first_bar_data,"[[","");
      StringReplace(first_bar_data,"\"","");

      StringSplit(first_bar_data,',',first_bar_data_array);

      //SECOND CANDLE
      second_bar_data = candle_data[1];
      StringReplace(second_bar_data,",[","");
      StringReplace(second_bar_data,"\"","");

      StringSplit(second_bar_data,',',second_bar_data_array);

      //THIRD CANDLE
      third_bar_data = candle_data[2];
      StringReplace(third_bar_data,",[","");
      StringReplace(third_bar_data,"\"","");

      StringSplit(third_bar_data,',',third_bar_data_array);

      //FORTH CANDLE
      forth_bar_data = candle_data[3];
      StringReplace(forth_bar_data,",[","");
      StringReplace(forth_bar_data,"\"","");

      StringSplit(forth_bar_data,',',fourth_bar_data_array);

      //FIFTH CANDLE
      fifth_bar_data = candle_data[4];
      StringReplace(fifth_bar_data,",[","");
      StringReplace(fifth_bar_data,"\"","");

      StringSplit(fifth_bar_data,',',fifth_bar_data_array);

      //SIXTH CANDLE
      sixth_bar_data = candle_data[5];
      StringReplace(sixth_bar_data,",[","");
      StringReplace(sixth_bar_data,"\"","");

      StringSplit(sixth_bar_data,',',sixth_bar_data_array);

      //SEVENTH CANDLE
      senventh_bar_data = candle_data[6];
      StringReplace(senventh_bar_data,",[","");
      StringReplace(senventh_bar_data,"\"","");

      StringSplit(senventh_bar_data,',',seventh_bar_data_array);

      //EIGHTH CANDLE
      eighth_bar_data = candle_data[7];
      StringReplace(eighth_bar_data,",[","");
      StringReplace(eighth_bar_data,"\"","");

      StringSplit(eighth_bar_data,',',eighth_bar_data_array);

      //NINETH CANDLE
      nineth_bar_data = candle_data[8];
      StringReplace(nineth_bar_data,",[","");
      StringReplace(nineth_bar_data,"\"","");

      StringSplit(nineth_bar_data,',',nineth_bar_data_array);

      //TENTH CANDLE
      tenth_bar_data = candle_data[9];
      StringReplace(tenth_bar_data,",[","");
      StringReplace(tenth_bar_data,"\"","");

      StringSplit(tenth_bar_data,',',tenth_bar_data_array);

     }
  }
Пояснение:
Мы начинаем с того, что просто принимаем все, что присылает сервер; зачастую это один огромный текстовый файл со всеми свечными данными. Чтобы разобраться в этом, сначала нужно определить границы между свечами. Мы используем инструмент разделения, чтобы разбивать этот длинный блок текста всякий раз, когда видим закрывающую квадратную скобку, которая выступает разделителем. Это сразу дает нам аккуратный список (массив), где каждый элемент представляет все сырые данные одной свечи. Теперь мы сосредотачиваемся на первой свече в обновленном списке. В сырых данных все еще есть лишние символы, например, кавычки и открывающие квадратные скобки из-за серверного форматирования. Поэтому мы берем данные этой первой свечи и удаляем все лишние символы. После этого у нас остается безупречно чистый текст, который содержит только ключевые числа.
Чтобы различать реальные ценовые точки, нам нужен такой четкий формат представления данных. Затем мы снова делим текст, но на этот раз используем запятую, и это важно, потому что она разделяет элементы свечных данных. Каждый элемент получившегося короткого списка, готового к использованию, – одно из этих значений. Мы повторяем тот же процесс для остальных свечей. Для каждой свечи мы удаляем ненужные кавычки и скобки, а затем разделяем оставшиеся данные запятыми. В итоге мы успешно создаем десять уникальных упорядоченных списков. Каждый из них относится только к одной свече и содержит аккуратно упорядоченные значения ее данных. Теперь данные чистые и хорошо организованные, поэтому они готовы для анализа или визуализации на графике.
Аналогия:
Представьте весь ответ сервера как одну длинную книжную полку, на которой плотно, почти без промежутков стоит множество томов. Каждая книга представляет собой одну 30-минутную свечу. Вы начинаете с того, что разделяете эту длинную полку на десять меньших "книг", то есть огромная строка со свечами делится на десять частей. Как десять книг стоят рядом на полке, так и десять отдельных свечных фрагментов теперь расположены в массиве.
Затем вы берете первую книгу с полки. Пластиковые и магазинные наклейки на обложке – это лишние символы формата JSON, например, ведущие двойные скобки и кавычки. Вы снимаете наклейки и пластик, чтобы очистить книгу перед чтением. Очистив обложку, вы открываете книгу и находите внутри нее главы. Эти главы (то есть, значения открытия, максимума, минимума и закрытия) разделены запятыми. В результате вы делите эти главы на меньшие части и аккуратно раскладываете их на другой, меньшей полке, предназначенной только для первой свечи.
Со второй книгой вы делаете то же самое: берете ее с полки, снимаете наклейки, открываете, делите главы и аккуратно раскладываете все в другом небольшом отделении. Третья, четвертая, пятая и десятая книги проходят тот же процесс. С каждой книги снимаются лишние "обертки", прежде чем ее содержимое будет разделено на удобные фрагменты. В конце вы получаете десять очень аккуратных секций, каждая из которых относится к одной свече, вместо одной большой и запутанной книжной полки. Значения внутри каждой свечи легко доступны и разнесены по сегментам. Благодаря этому легко работать по отдельности с каждой свечой, а не с одним огромным текстовым блоком.
Преобразование значений свечей в корректные типы данных
К этому моменту все детали по каждой свече в наших массивах уже разделены на отдельные текстовые элементы. Поскольку мы получили все данные из API в виде необработанных строк, все значения по-прежнему представлены в текстовом формате. Прежде чем использовать их в расчетах или отображать в индикаторе, нужно преобразовать их в подходящие типы данных, поскольку они представляют даты и числа.
Пример://DATETIME long bar1_time_s; datetime bar1_time; long bar2_time_s; datetime bar2_time; long bar3_time_s; datetime bar3_time; long bar4_time_s; datetime bar4_time; long bar5_time_s; datetime bar5_time; long bar6_time_s; datetime bar6_time; long bar7_time_s; datetime bar7_time; long bar8_time_s; datetime bar8_time; long bar9_time_s; datetime bar9_time; long bar10_time_s; datetime bar10_time; //OPEN double bar1_open; double bar2_open; double bar3_open; double bar4_open; double bar5_open; double bar6_open; double bar7_open; double bar8_open; double bar9_open; double bar10_open; //HIGH double bar1_high; double bar2_high; double bar3_high; double bar4_high; double bar5_high; double bar6_high; double bar7_high; double bar8_high; double bar9_high; double bar10_high; //LOW double bar1_low; double bar2_low; double bar3_low; double bar4_low; double bar5_low; double bar6_low; double bar7_low; double bar8_low; double bar9_low; double bar10_low; //CLOSE double bar1_close; double bar2_close; double bar3_close; double bar4_close; double bar5_close; double bar6_close; double bar7_close; double bar8_close; double bar9_close; double bar10_close;
//TIME
bar1_time_s = (long)StringToInteger(first_bar_data_array[0])/1000;
bar1_time = (datetime)bar1_time_s;

bar2_time_s = (long)StringToInteger(second_bar_data_array[0])/1000;
bar2_time = (datetime)bar2_time_s;

bar3_time_s = (long)StringToInteger(third_bar_data_array[0])/1000;
bar3_time = (datetime)bar3_time_s;

bar4_time_s = (long)StringToInteger(fourth_bar_data_array[0])/1000;
bar4_time = (datetime)bar4_time_s;

bar5_time_s = (long)StringToInteger(fifth_bar_data_array[0])/1000;
bar5_time = (datetime)bar5_time_s;

bar6_time_s = (long)StringToInteger(sixth_bar_data_array[0])/1000;
bar6_time = (datetime)bar6_time_s;

bar7_time_s = (long)StringToInteger(seventh_bar_data_array[0])/1000;
bar7_time = (datetime)bar7_time_s;

bar8_time_s = (long)StringToInteger(eighth_bar_data_array[0])/1000;
bar8_time = (datetime)bar8_time_s;

bar9_time_s = (long)StringToInteger(nineth_bar_data_array[0])/1000;
bar9_time = (datetime)bar9_time_s;

bar10_time_s = (long)StringToInteger(tenth_bar_data_array[0])/1000;
bar10_time = (datetime)bar10_time_s;

//OPEN
bar1_open = StringToDouble(first_bar_data_array[1]);
bar2_open = StringToDouble(second_bar_data_array[1]);
bar3_open = StringToDouble(third_bar_data_array[1]);
bar4_open = StringToDouble(fourth_bar_data_array[1]);
bar5_open = StringToDouble(fifth_bar_data_array[1]);
bar6_open = StringToDouble(sixth_bar_data_array[1]);
bar7_open = StringToDouble(seventh_bar_data_array[1]);
bar8_open = StringToDouble(eighth_bar_data_array[1]);
bar9_open = StringToDouble(nineth_bar_data_array[1]);
bar10_open = StringToDouble(tenth_bar_data_array[1]);

//HIGH
bar1_high = StringToDouble(first_bar_data_array[2]);
bar2_high = StringToDouble(second_bar_data_array[2]);
bar3_high = StringToDouble(third_bar_data_array[2]);
bar4_high = StringToDouble(fourth_bar_data_array[2]);
bar5_high = StringToDouble(fifth_bar_data_array[2]);
bar6_high = StringToDouble(sixth_bar_data_array[2]);
bar7_high = StringToDouble(seventh_bar_data_array[2]);
bar8_high = StringToDouble(eighth_bar_data_array[2]);
bar9_high = StringToDouble(nineth_bar_data_array[2]);
bar10_high = StringToDouble(tenth_bar_data_array[2]);

//LOW
bar1_low = StringToDouble(first_bar_data_array[3]);
bar2_low = StringToDouble(second_bar_data_array[3]);
bar3_low = StringToDouble(third_bar_data_array[3]);
bar4_low = StringToDouble(fourth_bar_data_array[3]);
bar5_low = StringToDouble(fifth_bar_data_array[3]);
bar6_low = StringToDouble(sixth_bar_data_array[3]);
bar7_low = StringToDouble(seventh_bar_data_array[3]);
bar8_low = StringToDouble(eighth_bar_data_array[3]);
bar9_low = StringToDouble(nineth_bar_data_array[3]);
bar10_low = StringToDouble(tenth_bar_data_array[3]);

//CLOSE
bar1_close = StringToDouble(first_bar_data_array[4]);
bar2_close = StringToDouble(second_bar_data_array[4]);
bar3_close = StringToDouble(third_bar_data_array[4]);
bar4_close = StringToDouble(fourth_bar_data_array[4]);
bar5_close = StringToDouble(fifth_bar_data_array[4]);
bar6_close = StringToDouble(sixth_bar_data_array[4]);
bar7_close = StringToDouble(seventh_bar_data_array[4]);
bar8_close = StringToDouble(eighth_bar_data_array[4]);
bar9_close = StringToDouble(nineth_bar_data_array[4]);
bar10_close = StringToDouble(tenth_bar_data_array[4]);
Пояснение:
Мы создаем переменные для значений каждой свечи. Чтобы получить корректное значение даты и времени в языке MQL5, значения времени сначала нужно преобразовать из текстовых чисел (миллисекунды) в числа типа long. Числовые значения цен нужно преобразовать из текста в числа типа double. Поэтому заранее объявляется ряд переменных. В дальнейшем для каждой из этих переменных будут получены преобразованные значения. Строковое значение сначала нужно преобразовать в число long, а затем разделить на 1000. Это связано с тем, что время каждой свечи приходит из API в миллисекундах. Затем результат преобразуется в корректное значение даты и времени, понятное MQL5, и сохраняется в переменной типа datetime. Так мы получаем корректное время свечи для графика. Та же процедура выполняется для каждой из десяти свечей.
Когда значения времени заданы, следующим шагом идет преобразование значений цены открытия. Каждая цена открытия извлекается из своей позиции в строке и с помощью функции преобразования переводится в число double. Чтобы у каждой свечи было реальное числовое значение цены открытия, этот процесс выполняется для каждой свечи. Затем тот же процесс применяется к значениям максимума. Каждое значение максимума передается из текстового элемента в функцию преобразования, а затем – в соответствующую переменную типа double. После этого процедура повторяется для значений минимума и, наконец, для значений закрытия. В каждом случае цель одна – убедиться, что каждая цена преобразована из обычного текста в подходящий числовой формат, чтобы ее можно было использовать для вычислений, отрисовки свечей и сравнения движения цены.
Аналогия:
Представьте каждую свечу как книгу, главы которой уже отсортированы и очищены. Единственная проблема в том, что книга написана на языке, который библиотека не понимает. Книга готова, но пока мы не переведем слова на язык, который понимает наша система, она бесполезна. Теперь нам нужно приступить к этому переводу. В каждой книге-свече есть пять ключевых страниц. Время открытия свечи указано на первой странице, затем цена открытия – на второй, максимум – на третьей, минимум – на четвертой, а цена закрытия – на пятой. Однако вместо корректных числовых значений на каждой из этих страниц все записано словами. Представьте, что при открытии книги число написано словами, а не цифрами. Вы должны переписать каждое из этих чисел в подходящий формат, прежде чем ваша библиотечная система сможет хранить их или выполнять с ними вычисления. Этап преобразования – это и есть процедура переписывания.
В каждой книге на первой странице указано время в миллисекундах; это похоже на печать даты с использованием календарной системы, которую ваша библиотека не понимает. Переписывание даты в секунды – это первый шаг; это похоже на перевод иностранного календаря на ваш местный язык. Затем, когда вы еще раз преобразуете результат в формат datetime, дата записывается в официальном формате вашей библиотеки. Для каждой книги-свечи вы повторяете этот процесс, вводя соответствующее значение datetime в вашу библиотечную систему для книг с первой по десятую.
После этого вы переходите к оставшимся страницам. Значения открытия, максимума, минимума и закрытия хранятся на каждой ценовой странице, но все они по-прежнему являются строками. Представьте их как рукописные страницы, которые сканер библиотеки не может прочитать. Чтобы алгоритм полностью понял каждую цену, вы переписываете ее, используя чистые цифры. После преобразования библиотечная система может сравнивать цены, сохранять значения и без труда выполнять вычисления. Для каждой страницы в каждой книге-свече вы делаете это. К концу этого процесса каждая книга-свеча перестает быть рукописным "иностранным" документом. Все преобразовано в точные даты и числа, которые понимает система индексации вашей библиотеки. Теперь вы можете создать индикатор, отрисовать свечи или выполнить любые необходимые вычисления, используя полностью читаемые книги на вашей полке со свечами.
Группировка значений свечей в отдельные массивы
На этом этапе значения каждой свечи уже корректно преобразованы в соответствующие типы данных: цены – в double, а временные метки – в datetime. Следующий этап – организовать эти значения так, чтобы все сопоставимые виды данных были сгруппированы вместе. Другими словами, мы помещаем цены открытия каждой из десяти свечей в единый массив, цены закрытия – в другой, и так далее для максимумов, минимумов и значений времени. При построении индикаторов или выполнении вычислений нам проще будет работать со структурой, которая создается при такой группировке переменных. Теперь мы можем работать с полным набором данных сразу, просто обращаясь к массиву цен открытия, массиву цен закрытия или массиву временных меток, а не к каждой свече по отдельности каждый раз.
Кроме того, этот подход повышает эффективность и делает структуру данных более понятной. Например, программа может отображать цены открытия, максимума, минимума и закрытия каждой свечи, последовательно считывая массивы при отрисовке свечей на графике. Поскольку все значения одного типа уже сгруппированы вместе, это также упрощает вычисления: скользящие средние, сравнение свечей и другие операции технического анализа.
Пример:datetime OpenTime[10] = {bar1_time, bar2_time, bar3_time, bar4_time, bar5_time,bar6_time, bar7_time, bar8_time, bar9_time, bar10_time}; double OpenPrice[10] = {bar1_open, bar2_open, bar3_open, bar4_open, bar5_open,bar6_open, bar7_open, bar8_open, bar9_open, bar10_open}; double ClosePrice[10] = {bar1_close, bar2_close, bar3_close, bar4_close, bar5_close,bar6_close, bar7_close, bar8_close, bar9_close, bar10_close}; double LowPrice[10] = {bar1_low, bar2_low, bar3_low, bar4_low, bar5_low,bar6_low, bar7_low, bar8_low, bar9_low, bar10_low}; double HighPrice[10] = {bar1_high, bar2_high, bar3_high, bar4_high, bar5_high,bar6_high, bar7_high, bar8_high, bar9_high, bar10_high};
Пояснение:
Этот шаг группирует все отдельные значения свечей в массивы, чтобы все однотипные данные хранились вместе. Теперь у нас есть единый массив для каждого из типов данных, а не отдельные переменные для каждой свечи. В результате в будущем работать со свечной информацией в программе становится значительно проще. Мы сохраняем времена открытия десяти свечей в том же порядке, в котором они были получены в исходном массиве. У каждого времени свечи есть свой слот. Вместо управления десятью разными переменными времени, такая конфигурация делает обращение ко времени любой свечи проще – достаточно указать индекс.
Для ценовых значений методика остается той же. С первой по десятую свечу значения открытия расположены в едином массиве. Тот же метод используется для хранения значений закрытия, максимума и минимума. Первая свеча всегда обозначается первым индексом, а остальные индексы идут в том же порядке. Это гарантирует, что элементы каждого ценового массива соответствуют одному и тому же номеру свечи. Используя массивы, мы можем обрабатывать свечные данные организованно и надежно. Мы можем обрабатывать каждую свечу автоматически, перебирая массивы в циклах, а не управляя каждой по отдельности. Таким образом, мы предотвращаем путаницу и сохраняем правильное соответствие, потому что каждое значение цены для одной и той же свечи имеет один и тот же индекс. При создании индикаторов, расчете значений или визуализации на графике такая организация критически важна.
Аналогия:
Представьте себе коллекцию книг, где каждая книга представляет собой свечу. Каждая книга содержит все детали свечи, включая время и диапазон цен. До сих пор вы просматривали информацию страница за страницей и книга за книгой. Это работает, но по мере роста коллекции обрабатывать все по отдельности становится сложнее, что приводит к замедлению. Поэтому вы делите данные по категориям, а не храните все в одной книге. Отдельная полка отводится под все времена открытия, другая – под цены открытия и еще по одной – под значения закрытия, максимумов и минимумов, соответственно. Каждая из строк представлен номер свечи на полках. Таким образом, первая свеча относится к первой строке на каждой полке, вторая – ко второй строке, и т.д.
Это устраняет необходимость открывать каждую книгу отдельно, чтобы сравнивать или читать однотипные данные. Просто "перейдите" к полке с ценами открытия, чтобы увидеть все доступные значения. Если вам нужны все времена закрытия, вы "переходите" к полке со временем. Такая схема облегчает эффективные вычисления, сравнение и отображение данных.
Хранение информации о свечах для визуализации
Следующий шаг – создать файл, чтобы хранить все связанные свечные данные, сгруппированные в массивы. Задача файла – упорядоченно сохранить все свечные данные, чтобы затем можно было отобразить свечи на графике. Если сохранить данные в файл, индикатор или программа смогут легко получать к ним доступ, и не придется снова и снова запрашивать их у сервера.
Файл оформляется как простая таблица. Time, Open, High, Low и Close – это заголовки в первой строке, которые ясно показывают, что означает каждый столбец. Под заголовками каждая строка содержит данные по одной свече. Все времена свечей хранятся в первом столбце, затем идут цены открытия во втором, максимумы в третьем и т.д. Первая свеча представлена первой строкой данных, вторая – следующей, и каждая последующая строка, соответственно, представляет следующую свечу. Благодаря такой табличной организации информация о свечах хранится упорядоченно и остается легко доступной. Считывая каждый столбец, индикатор может точно воспроизводить свечи на графике. В будущем задачи вроде добавления новых свечей или обновления данных тоже станут проще благодаря такой структуре.
Пример:
string filename;
int handle;
filename = "BTCUSDTM30_MQL5.csv";
handle = FileOpen(filename, FILE_WRITE|FILE_CSV|FILE_SHARE_READ|FILE_ANSI, ',');

if(handle != INVALID_HANDLE)
  {
// Write a header row
   FileWrite(handle, "Time", "Open", "High", "Low", "Close");

// Write the 5 days of data row by row
   for(int i = 0; i < 10; i++)
     {
      FileWrite(handle, OpenTime[i], OpenPrice[i], HighPrice[i], LowPrice[i], ClosePrice[i]);
     }

   FileClose(handle);
   Print("EA successfully wrote the data to " + filename);
  }
else
  {
   Print("Error opening file for writing. Error code: ", + GetLastError());
  }
Пояснение:
Выбор имени файла – первый шаг при сохранении свечных данных. Краткое имя файла упрощает работу с несколькими файлами, давая быстрый обзор того, какие данные в них содержатся, например символ и таймфрейм свечей. Затем программа пытается открыть файл для записи. Для корректной работы используются определенные настройки. Когда файл открывается в формате CSV (значения, разделенные запятыми), данные организуются в табличную структуру, понятную и программам, и людям. Кроме того, настраиваются параметры совместного доступа и кодирования, чтобы разные программы могли безопасно обращаться к файлу и корректно его интерпретировать. Затем, после открытия файла, программа записывает строку заголовков. Эта строка дает четкое представление о том, какие данные записаны в файле, и обозначает каждый столбец. Заголовок облегчает последующее чтение и поддерживает порядок в файле.
После заголовка программа заполняет файл свечными данными строка за строкой. При аккуратном размещении всех нужных значений по столбцам каждая строка представляет собой одну свечу. Чтобы записать все десять свечей в правильном порядке, программа проходит по массивам в том же порядке, что и график. Затем файл закрывается, как только все свечные данные добавлены, чтобы ресурсы не удерживались без необходимости, и все было сохранено. Приложение выводит сообщение об успешном завершении, показывая, что файл был обработан корректно.
После создания кода выполняются компиляция и запуск. Советник немедленно начнет процесс создания файла после того, как будет инициализирован на вашем графике. Все свечные данные будут сохранены в структурированном CSV-файле, созданном программой. На вашем компьютере файл будет сгенерирован в папке Files директории MQL5. MQL5 хранит файлы, сгенерированные программой, в этом каталоге по умолчанию, поэтому впоследствии их будет легко найти. Когда файл появится, вы сможете просмотреть его и убедиться, что все свечные данные сохранены корректно, прежде чем использовать их для создания индикатора или других видов анализа.
Аналогия:
Представьте себе десять книг на полке, каждая из которых содержит страницы с информацией по каждой свече. В зависимости от типа страницы были разделены на разные стопки. Представьте, что вы складываете все эти стопки в новый "переплет", чтобы легко получать доступ к данным, когда это понадобится. Чтобы было понятно, какую информацию папка содержит, например символ и таймфрейм свечей, вы сначала четко маркируете ее. После этого вы открываете переплет и готовите его к тому, чтобы упорядоченно разместить в нем страницы. В начале размещается титульная страница-подсказка, которая объясняет, что означает каждый столбец.
После этого вы размещаете страницы в переплете одну за другой, при этом каждая строка представляет собой свечу. Первая строка представляет первую свечу, вторая строка – вторую, и т.д. Такое расположение страниц обеспечивает порядок всей свечной информации и ее доступность в нужный момент. Чтобы убедиться, что все данные надежно сохранены, после сортировки вы закрываете переплет. Это похоже на то, как программа заполняет файл, чтобы информация постоянно хранилась на вашем компьютере.
Вам нужно скомпилировать и выполнить процедуру, чтобы библиотечная система могла использовать этот переплет. В терминах программирования это означает "скомпилировать советник и инициализировать его на графике". "Переплет", то есть файл со всеми свечными данными, создается на вашем компьютере сразу после того, как советник начинает работать. Он находится в папке Files вашего каталога MQL5. Теперь "переплет" можно открыть и использовать, предоставляя индикатору или программе доступ к упорядоченным свечным данным для анализа или визуализации.
Путь:C:\Users\Dell\AppData\Roaming\MetaQuotes\Terminal\D0E8209F77C8CF37AD8BF550E51FF075\MQL5\Files

Чтобы не перегружать вас информацией, на этом пока остановимся. В следующей статье мы сделаем следующий шаг и разработаем индикатор, который визуализирует свечи на графике в корректном свечном формате, используя данные из файла. Это позволит вам просматривать сохраненные и упорядоченные данные в виде настоящих свечей.
Заключение
Чтобы улучшить обработку данных API Binance, в этой статье мы получили последние десять 30-минутных свечей и разделили ответ сервера на отдельные свечи. Мы сгруппировали связанные значения в массивы и преобразовали их в соответствующие типы данных, чтобы упростить обработку данных. Чтобы сохранить свечные данные в упорядоченной таблице, к которой в будущем будет легко получить доступ, мы в итоге подготовили файл. Этот процесс подготавливает данные для визуализации и дает структурированную основу для создания индикаторов или торговых советников. В следующей статье мы используем этот файл, чтобы создать индикатор, который отображает свечи на графике в корректном формате, позволяя визуально и эффективно анализировать поведение рынка.
Перевод с английского произведен MetaQuotes Ltd.
Оригинальная статья: https://www.mql5.com/en/articles/20546
Предупреждение: все права на данные материалы принадлежат MetaQuotes Ltd. Полная или частичная перепечатка запрещена.
Данная статья написана пользователем сайта и отражает его личную точку зрения. Компания MetaQuotes Ltd не несет ответственности за достоверность представленной информации, а также за возможные последствия использования описанных решений, стратегий или рекомендаций.

- Бесплатные приложения для трейдинга
- 8 000+ сигналов для копирования
- Экономические новости для анализа финансовых рынков
Вы принимаете политику сайта и условия использования