FDP Strong Point new
- Indicadores
- Versão: 2.0
- Atualizado: 22 setembro 2022
- Ativações: 5
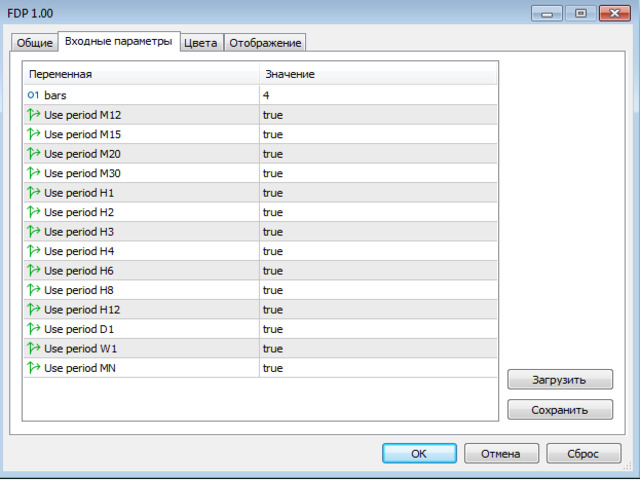
Este indicador mostra uma combinação de velas com base em dodge, Dodge e pin bar. A lógica do padrão é ficar do lado da força, depois da incerteza. O indicador é universal e útil para negociação de Opções Binárias, Forex, ETF, criptomoeda, ações. O indicador suporta prazos de M5 a MN, incluindo TF não padrão apresentado em MT5.(M5,M6,M10,M12, M15, M20, M30, H1, H2, H3, H4, H6, H8, H12, D1, W1, MN). A capacidade de ativar e desativar o TF foi implementada. Alertas sonoros e Push.
МТ4 https://www.mql5.com/ru/market/product/62791?source=Site+Profile+Seller
https://t.me/dnfad -grupo em telegrama
Mensagens privadas - @fadbof