Harmonic Patterns by ZZ MT4

Overview

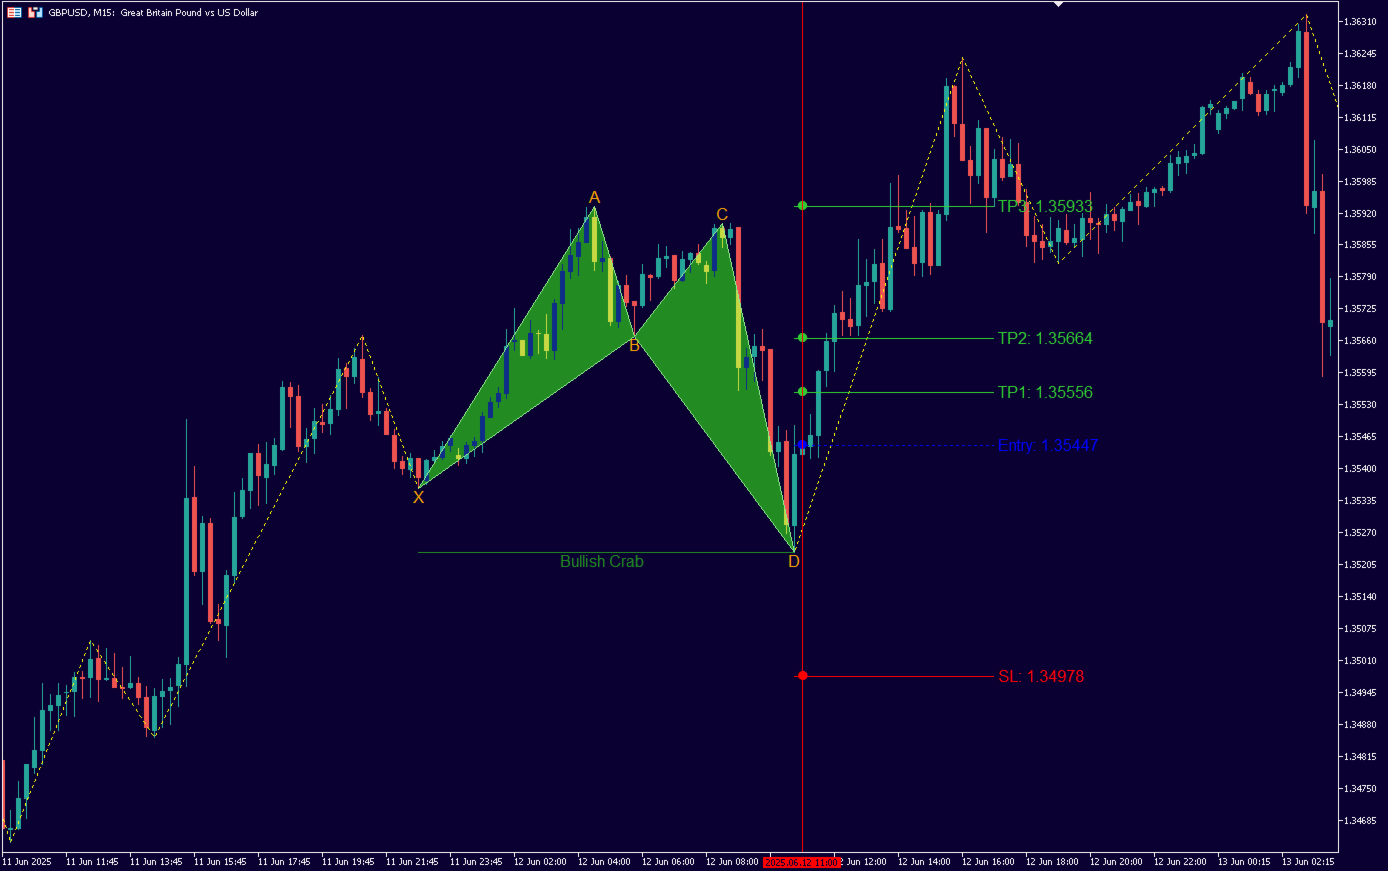
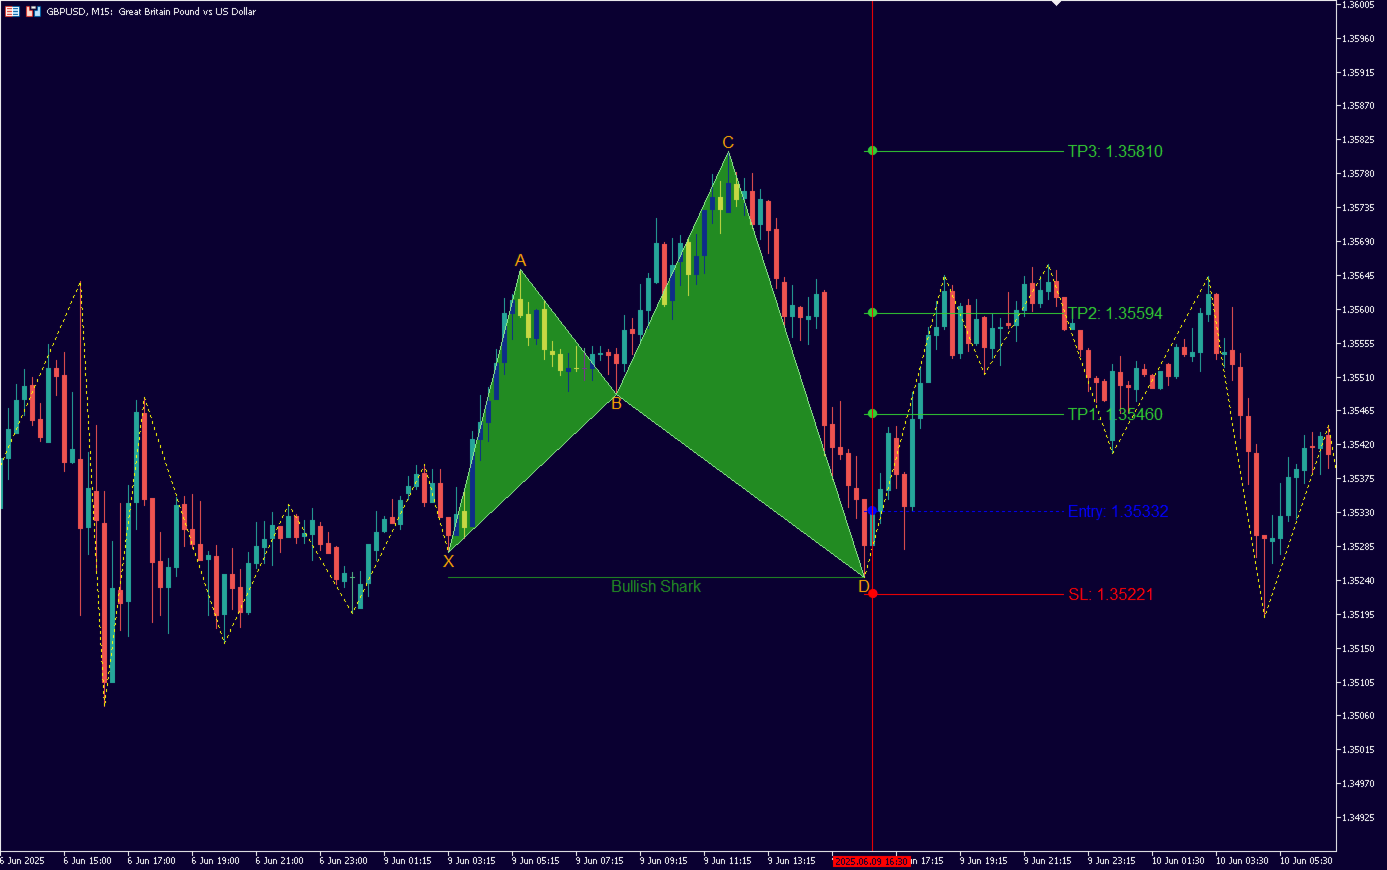
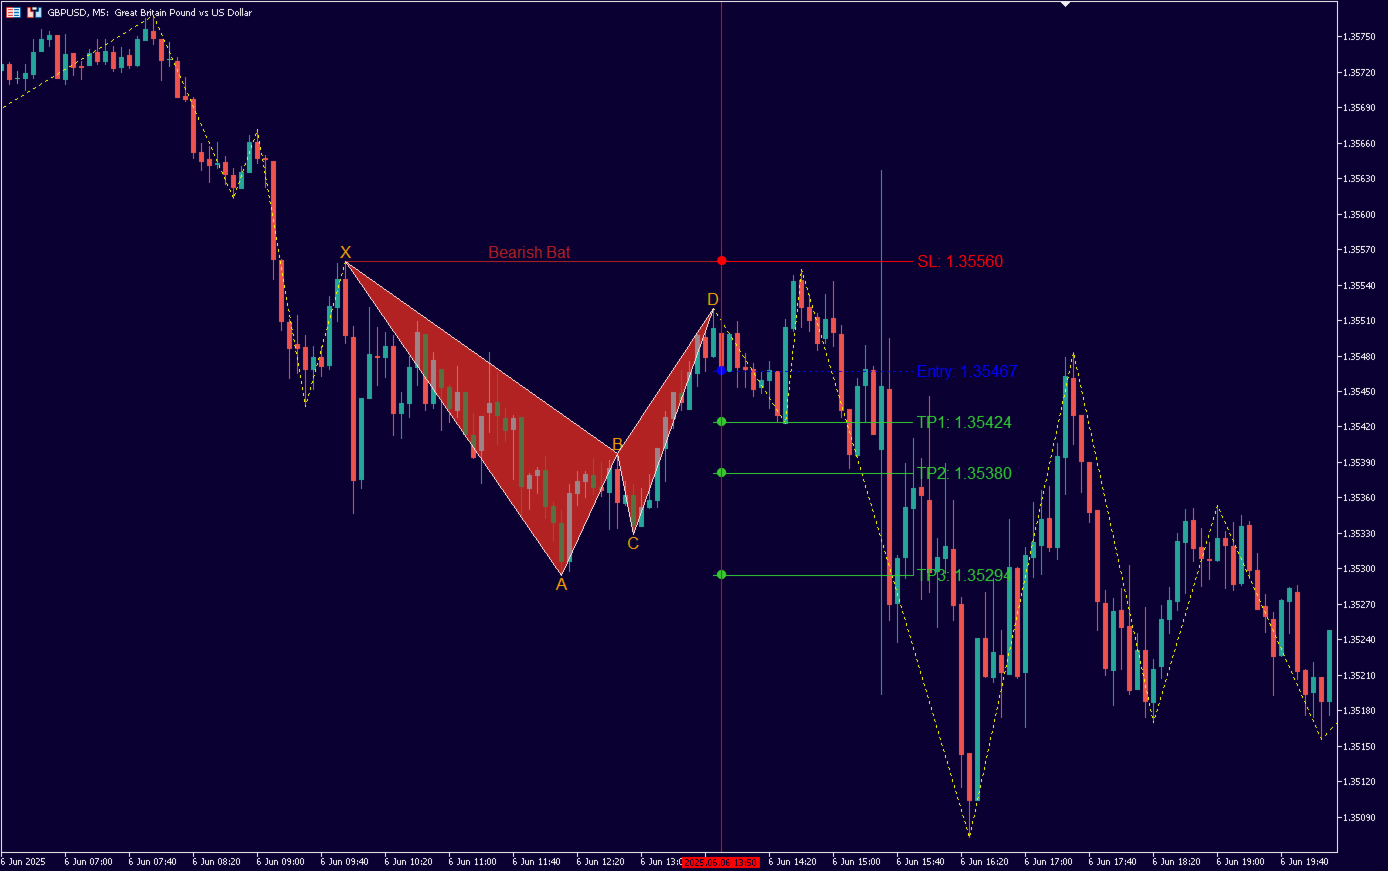
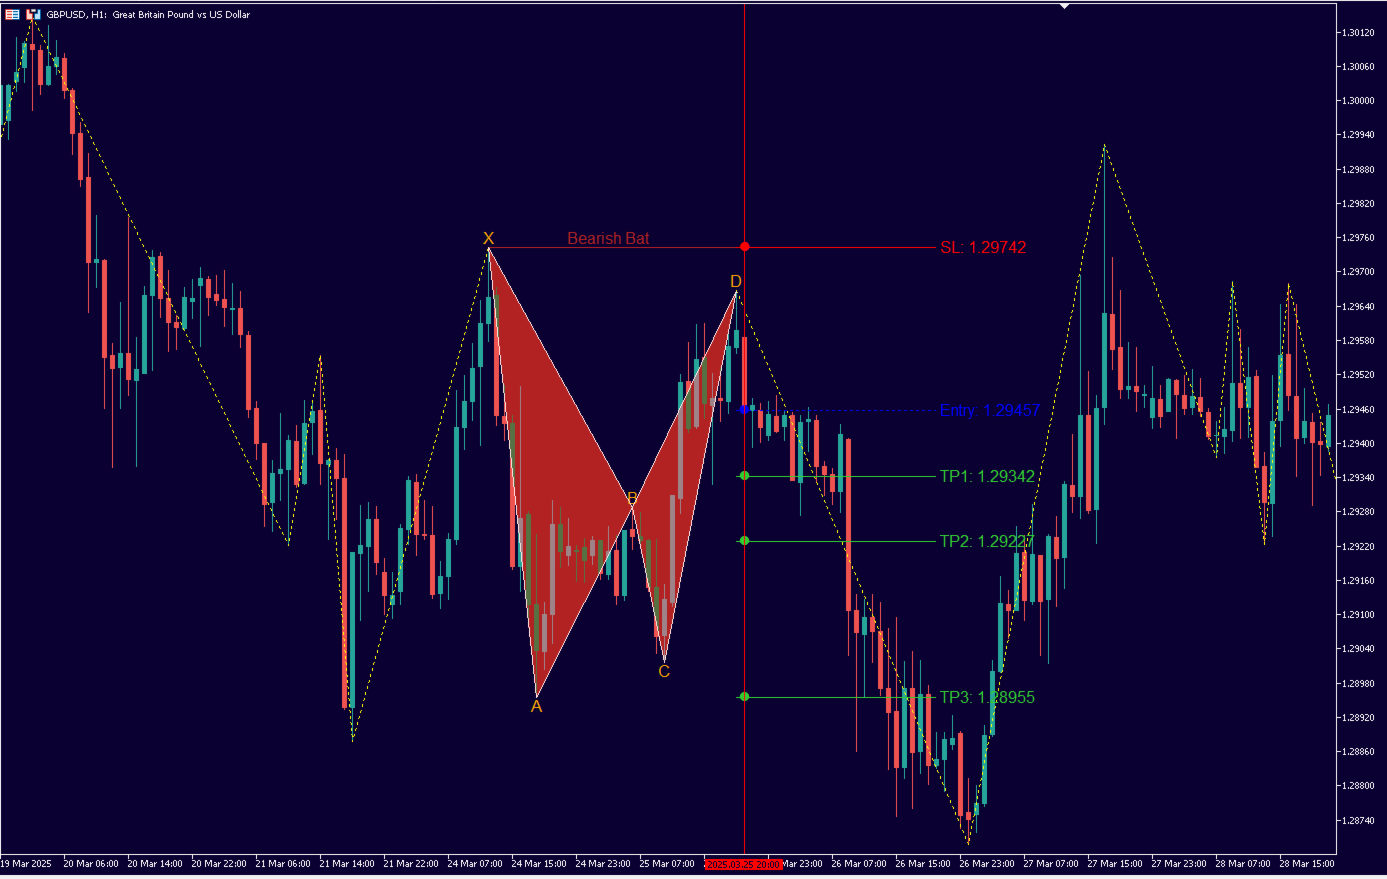
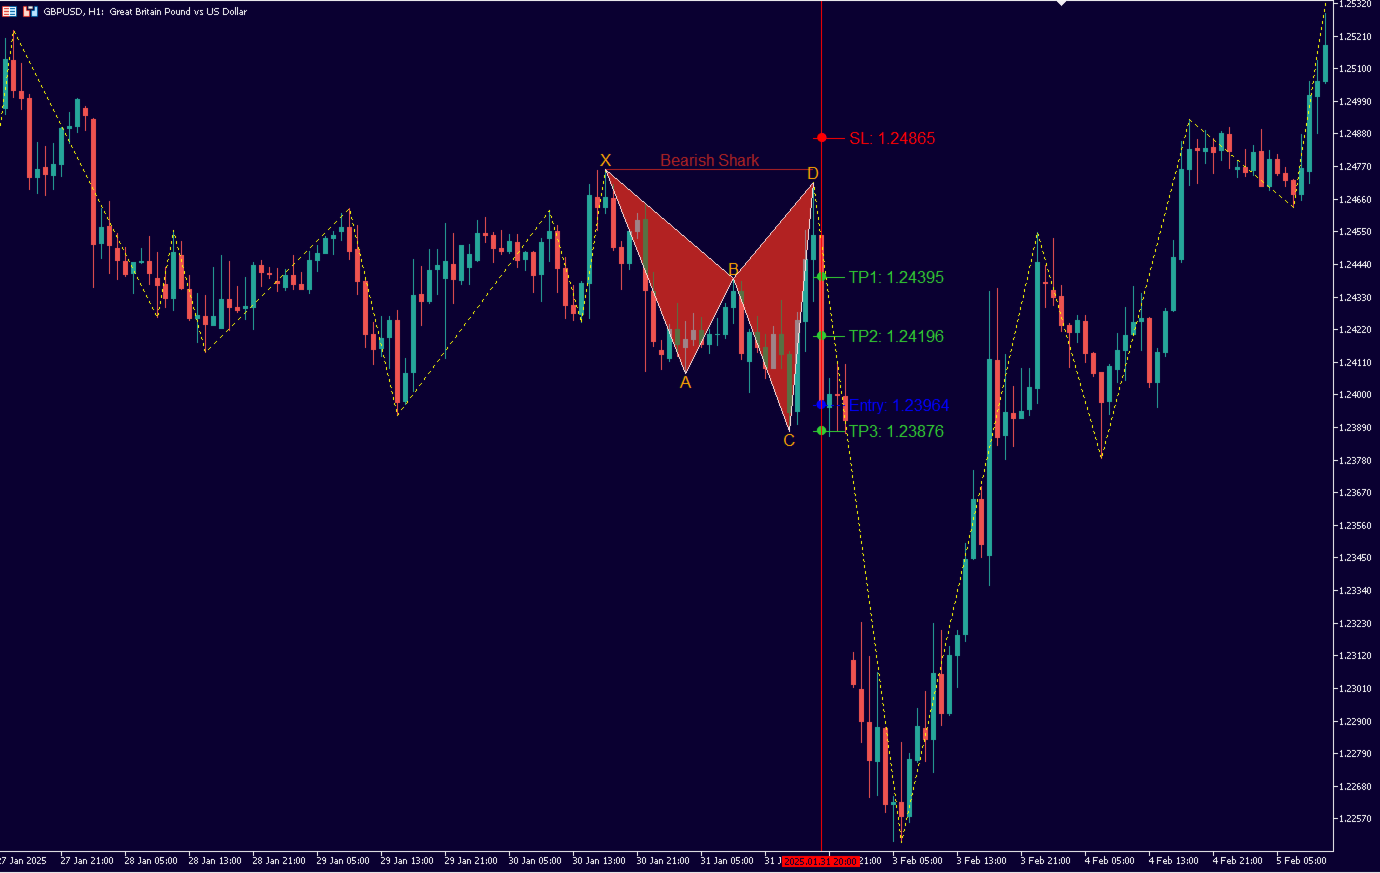
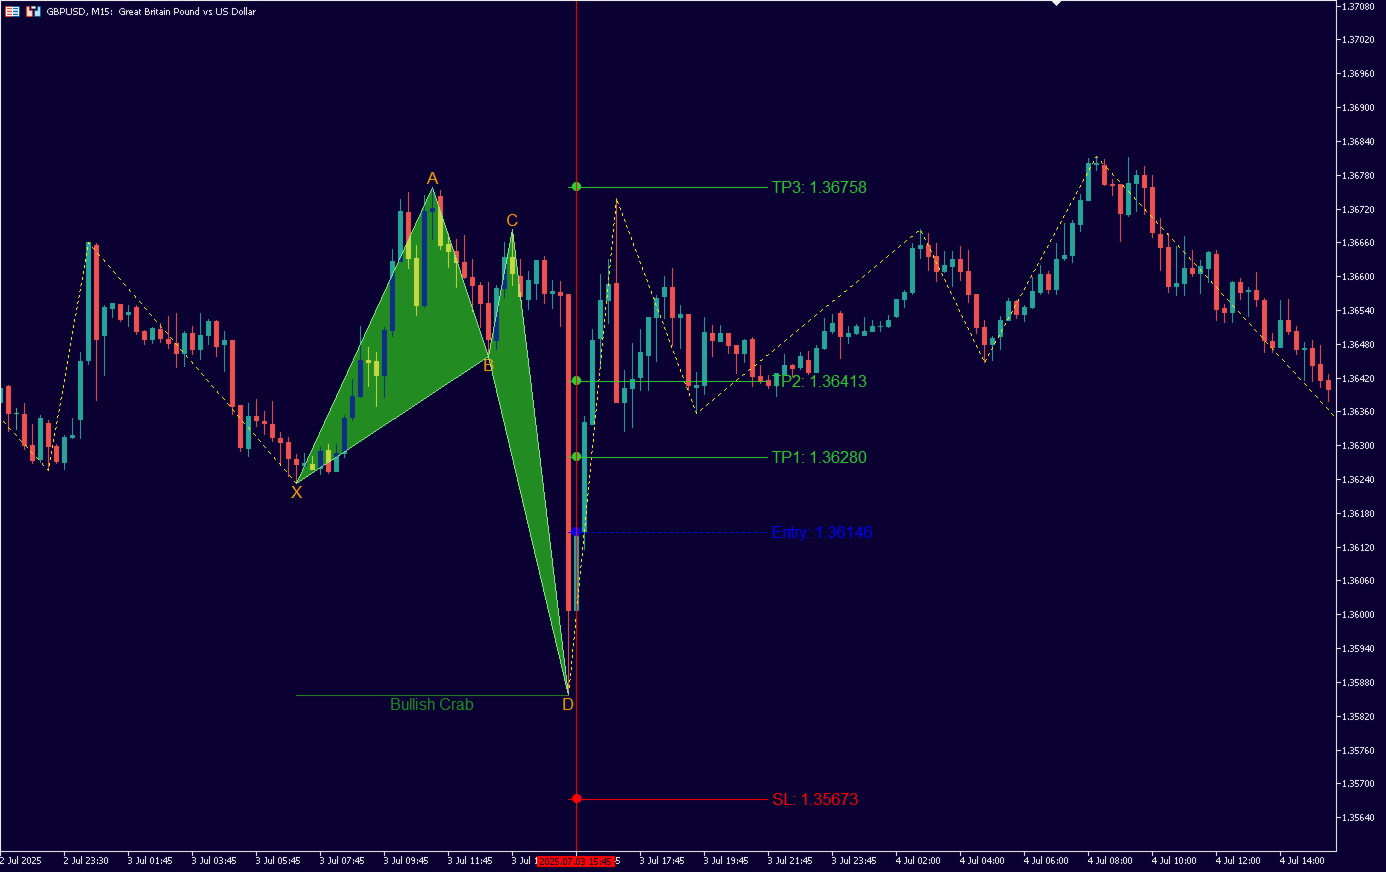
Harmonic Patterns MT4 is a technical analysis indicator designed for the MetaTrader 5 platform. It identifies and displays harmonic price patterns, such as Butterfly, Cypher, Crab, Bat, Shark, and Gartley, in both bullish and bearish directions. The indicator calculates key price levels, including entry, stop loss, and three take-profit levels, to assist traders in analyzing market movements. Visual elements and customizable alerts enhance usability on the chart.

Features

  • Detects six harmonic patterns: Butterfly, Cypher, Crab, Bat, Shark, and Gartley.

  • Supports bullish and bearish pattern directions.

  • Displays pattern points (X, A, B, C, D) with customizable visibility and color.

  • Plots entry, stop loss, and three take-profit levels with adjustable line styles and colors.

  • Provides alerts for each pattern type, configurable for bullish and bearish occurrences.

  • Uses a ZigZag algorithm to identify significant price points for pattern formation.

  • Allows customization of pattern detection parameters, such as Depth, Deviation, Back Step, and Error Percentage.
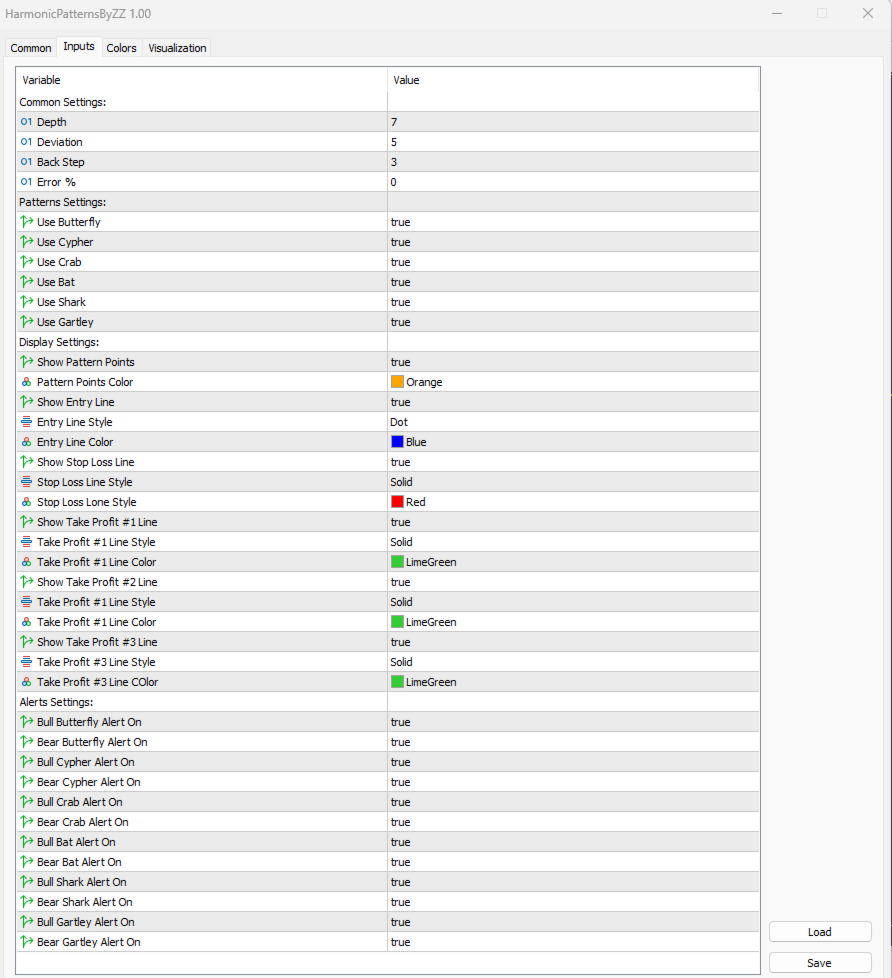
Input Parameters

Common Settings

  • Depth: Defines the minimum number of bars for ZigZag calculation (default: 7).

  • Deviation: Sets the minimum price movement for ZigZag points (default: 5).

  • Back Step: Controls the recalculation step for ZigZag (default: 3).

  • Error %: Specifies the acceptable error percentage for pattern detection (default: 0).

Patterns Settings

  • Use Butterfly: Enable/disable Butterfly pattern detection (default: true).

  • Use Cypher: Enable/disable Cypher pattern detection (default: true).

  • Use Crab: Enable/disable Crab pattern detection (default: true).

  • Use Bat: Enable/disable Bat pattern detection (default: true).

  • Use Shark: Enable/disable Shark pattern detection (default: true).

  • Use Gartley: Enable/disable Gartley pattern detection (default: true).

Display Settings

  • Show Pattern Points: Toggle visibility of pattern points (default: true).

  • Pattern Points Color: Set color for pattern point labels (default: Orange).

  • Show Entry Line: Toggle visibility of entry level line (default: true).

  • Entry Line Style: Set style for entry line (default: Dot).

  • Entry Line Color: Set color for entry line (default: Blue).

  • Show Stop Loss Line: Toggle visibility of stop loss line (default: true).

  • Stop Loss Line Style: Set style for stop loss line (default: Solid).

  • Stop Loss Line Color: Set color for stop loss line (default: Red).

  • Show Take Profit #1 Line: Toggle visibility of first take-profit line (default: true).

  • Take Profit #1 Line Style: Set style for first take-profit line (default: Solid).

  • Take Profit #1 Line Color: Set color for first take-profit line (default: LimeGreen).

  • Show Take Profit #2 Line: Toggle visibility of second take-profit line (default: true).

  • Take Profit #2 Line Style: Set style for second take-profit line (default: Solid).

  • Take Profit #2 Line Color: Set color for second take-profit line (default: LimeGreen).

  • Show Take Profit #3 Line: Toggle visibility of third take-profit line (default: true).

  • Take Profit #3 Line Style: Set style for third take-profit line (default: Solid).

  • Take Profit #3 Line Color: Set color for third take-profit line (default: LimeGreen).

Alerts Settings

  • Bull/Bear Butterfly Alert: Enable/disable alerts for bullish/bearish Butterfly patterns (default: true).

  • Bull/Bear Cypher Alert: Enable/disable alerts for bullish/bearish Cypher patterns (default: true).

  • Bull/Bear Crab Alert: Enable/disable alerts for bullish/bearish Crab patterns (default: true).

  • Bull/Bear Bat Alert: Enable/disable alerts for bullish/bearish Bat patterns (default: true).

  • Bull/Bear Shark Alert: Enable/disable alerts for bullish/bearish Shark patterns (default: true).

  • Bull/Bear Gartley Alert: Enable/disable alerts for bullish/bearish Gartley patterns (default: true).


If you liked the indicator, I will be glad to have a positive review. If you find any problems with the indicator, please contact me

If you want to see more high-quality products or order the development/conversion of your own products, visit my partners' website: 4xDev
Get 10% OFF on manual strategies automation services or indicator development/conversion services at 4xDev using my exclusive promo code: ENTEGRA10
Produtos recomendados
Monster Harmonic Indicator
Paul Geirnaerdt
4.59 (29)
Monster Harmonics Indicator is a harmonic pattern indicator. It recognizes Gartley, Bat, Crab, Butterfly, Cypher, White Swan, Black Swan, Shark and several other patterns. Projected patterns that are not yet completed are recognized, too. Monster even shows the PRZ (Potential Reversal Zone). Users can add their own user defined patterns to Monster. Besides the current pattern, Monster also shows all patterns in the symbols history. Monster will provide alerts for developing patterns. Introduced
PZ Harmonacci Patterns
PZ TRADING SLU
3.17 (6)
Este é sem dúvida o indicador de reconhecimento automático de formação de preço harmônico mais completo que você pode encontrar para a MetaTrader Platform. Ele detecta 19 padrões diferentes, leva as projeções de Fibonacci tão a sério quanto você, exibe a Zona de Reversão Potencial (PRZ) e encontra níveis adequados de stop loss e take-profit. [ Guia de instalação | Guia de atualização | Solução de problemas | FAQ | Todos os produtos ] Detecta 19 formações harmônicas de preços diferentes Traça
All Symbols   AND  All Time frames Scan                                                                                                                 Document Introduction   The ABCD is a basic harmonic pattern. The ABCD pattern is a visual, geometric chart pattern comprised of three consecutive price swings. It looks like a diagonal lightning bolt and can indicate an upcoming trading opportu
Trade with Gann on your side!! MASTER CIRCLE 360 CIRCLE CHART, originally created by Gann admitted that this is “The Mother of all charts”. It is one of the last studies that this great trader left for us. The numeric tab le is apparently quite simple like all the tables and is based on square numbers, the SQUARE OF 12 and is by evolution, one of the most important square numbers. Here we can find CYCLE, PRICE AND TIME thanks to angles and grades, to show past and future support and resistance.
Reversal Pattern Pro
Boonyapagorn Rodvattanajinda
Reversal Patterns Pro Reversal Patterns Pro is a Price Action (PA) analytical tool that scans the reversal patterns.  - Finds and marks the most dependable Japanese candlestick patterns in real-time. - Supports all time frames (Best for Scalping) - Doesn't repaint making it an exceptional indicator for Expert Advisors. Input parameters : - Support & Resistance Mode ( true or false ) for enabling advanced filtering - Donchian Period - RSI Period - RSI Oversold Level - RSI Overbought Level - Al
Este indicador irá detectar padrões harmônicos desenhados no gráfico através de métodos manuais e automáticos. Adicione a sua avaliação, por favor. Notas: O indicador possui um painel de controle e salvará cada configuração (gráfico e período de tempo). Você pode minimizá-lo para ter mais espaço no gráfico e pode pressionar o botão de fechar para ocultar todos os dados do indicador no gráfico, caso prefira trabalhar com outras ferramentas de análise. Quando você usar esse indicador e alterar as
RTrends
Nikolay Likhovid
The RTrends indicator does two things: first, it automatically draws the layout of the price chart by plotting trend lines and, secondly, it produces bearish and bullish signals. The layout reflects the fractal nature of the market. Trends from different time horizons are applied simultaneously on the chart. Thus, from a single chart a trader can see trend lines of higher timeframes. The lines, depending on the horizon, differ in color and width: the older the horizon, the thicker the line is. T
The indicator detects and displays М. Gartley's Butterfly pattern. The pattern is plotted by the extreme values of the ZigZag indicator (included in the resources, no need to install). After detecting the pattern, the indicator notifies of that by the pop-up window, a mobile notification and an email. The pattern and wave parameters are displayed on the screenshots. The default parameters are used for demonstration purposes only in order to increase the amount of detected patterns. Parameters z
The indicator provides a superior alternative to price action analysis. It enables the identification of normalized patterns, which are then transformed into a graphical representation to forecast future steps within a time series. In the top-left corner, you'll find information regarding the expected prediction accuracy, determined through a complex MSQE calculation. You have the flexibility to adjust the time window, making it easy to validate the indicator's performance. Additionally, you can
PZ 123 Pattern
PZ TRADING SLU
1 (1)
O 123 Pattern é um dos padrões de gráficos mais populares, poderosos e flexíveis. O padrão é composto por três pontos de preço: fundo, pico ou vale e retração de Fibonacci entre 38,2% e 71,8%. Um padrão é considerado válido quando as quebras de preços além do último pico ou vale, momento em que o indicador traça uma flecha, sobe um alerta, e o comércio pode ser colocado. [ Guia de instalação | Guia de atualização | Solução de problemas | FAQ | Todos os produtos ] Sinais de negociação claros C
FILH Index Pro MT4
Aiman Saeed Salem Dahbag
Indicator Description: The Advanced Force Index combines volume and price to determine the strength  of the trend. It has been developed to provide an accurate measurement of  seller and buyer power in the market, with multiple smoothing and display options. Key Features: Two display modes: Colored Histogram (bicolor) or Solid Line 4 Moving Average methods: SMA, EMA, SMMA, LWMA 7 Price types: Close, Open, High, Low, Median, Typical, Weighted Both volume types supported: Tick Volum
FREE
Key level wedge
Presley Annais Tatenda Meck
5 (5)
The Key level wedge indicator automatically draws rising wedge pattern and falling wedge pattern for you on the chart. This pattern is really good when used as a confirmation entry at key support & resistance, supply & demand and reversal zones. Advantages  The Key level wedge block DOES NOT RE-PAINT, giving you confidence when a signal appears and also helps when looking back.  The Key level wedge includes an on/off button on the chart to easily keep the charts clean after analysis by just o
Antes de tudo, vale ressaltar que esta Ferramenta de Negociação é um Indicador Não Repintante, Não Redesenhante e Não Atrasado, o que a torna ideal para negociação profissional. Curso online, manual do utilizador e demonstração. O Indicador de Conceitos de Ação de Preço Inteligente é uma ferramenta muito poderosa tanto para traders novos quanto experientes. Ele combina mais de 20 indicadores úteis em um único, combinando ideias avançadas de negociação como Análise do Trader do Círculo Interno e
The   Fibonacci Confluence Toolkit   is a technical analysis tool designed to help traders identify potential price reversal zones by combining key market signals and patterns. It highlights areas of interest where significant price action or reactions are anticipated, automatically applies Fibonacci retracement levels to outline potential pullback zones, and detects engulfing candle patterns. Its unique strength lies in its reliance solely on price patterns, eliminating the need for user-define
Daily Candle Predictor é um indicador que prevê o preço de fechamento de uma vela. O indicador destina-se principalmente ao uso em gráficos D1. Este indicador é adequado tanto para negociação forex tradicional quanto para negociação de opções binárias. O indicador pode ser usado como um sistema de negociação autônomo ou pode atuar como um complemento ao seu sistema de negociação existente. Este indicador analisa a vela atual, calculando certos fatores de força dentro do próprio corpo da vela, be
Gartley Projection D
Oleksandr Medviediev
3.71 (7)
The indicator identifies the harmonic patterns (XABCD) according to developments of H.M.Gartley ( "Profits in the Stock Market" , 1935г). It projects D-point as a point in the perspective projection (specify ProjectionD_Mode = true in the settings). Does not redraw. When a bar of the working timeframe closes, if the identified pattern point has not moved during Patterns_Fractal_Bars bars, an arrow appears on the chart (in the direction of the expected price movement). From this moment on, the ar
CyberZingFx Volume Plus
Afsal Meerankutty
4.94 (17)
Advanced version of CyberZingFx Volume Plus, the ultimate MT4 indicator for traders seeking highly accurate buy and sell signals. With an additional strategy and price action dot signals that enhances its effectiveness, this indicator offers a superior trading experience for professionals and beginners alike. The CyberZingFx Volume Plus Advanced version combines the power of volume analysis and historical price data with an additional strategy, resulting in even more precise and reliable signals
Professional Opening Range Breakout (ORB) indicator designed for precision session trading with automatic time handling, breakout alerts, and advanced target levels. This indicator automatically identifies the Opening Range for any configurable session, plots the High, Low, and Midpoint levels, and extends them across the trading day. Built-in breakout detection and alerts, range measurements, and extension targets provide traders with clear structure and actionable levels. Ideal for traders usi
This is an arrow indicator without a future function,developed based on the most advanced profit trading algorithms.It has the most innovative and advanced dual trend analysis module, as well as the latest and highly effective market trend prediction algorithm.Trends are your friends, and following larger trends can earn the maximum profit in foreign exchange. This indicator helps traders identify current trends and track them. Someone once made a profit of 10 times in a week by relying on it.No
The   RSI Divergence + FVG Signal   indicator combines   Relative Strength Index (RSI) Divergence   with   Fair Value Gap (FVG)   detection to generate high-probability buy and sell signals based on both momentum shifts and institutional imbalance zones. Core Features: RSI Divergence Detection : Identifies both regular and hidden bullish/bearish divergences between price and RSI. Divergences indicate potential trend reversals or continuation. FVG Zone Recognition : Detects Fair Value Gaps (imbal
Portuguese (Brazilian) Explicação das Vantagens (Sem mencionar o código) 1. Diferenciação Detalhada do Mercado (3 Dimensões) Esta ferramenta isola especificamente o movimento "Lateral" (Sideways) . O trader vê: Força de compra (Touros). Força de venda (Ursos). Importante: Quando o mercado está sem direção, evitando entradas falsas. 2. Oscilador de Força (0-100) Zonas Extremas: Define sobrecompra e sobrevenda. Preenchimento de Área: Colore as zonas críticas para fácil visualização. 3. Filtragem d
Voenix
Lorentzos Roussos
4.58 (12)
Padrões harmônicos , Scanner e comerciante Padrões incluídos: Padrão ABCD Padrão Gartley Padrão de morcego Padrão de cifra 3Padrão de acionamentos Padrão Cisne Negro Padrão de cisne branco Padrão Quasimodo ou padrão Over Under Padrão de morcego alternativo Padrão de borboleta Padrão de caranguejo profundo Padrão de caranguejo Padrão de tubarão Padrão de cinco O Padrão de cabeça e ombros Padrão de triângulo ascendente Padrão Um Dois Três E 8 padrões personalizados Voenix é um scanner de padrões
The main idea of this indicator is rates analysis and prediction by Fourier transform. Indicator decomposes exchange rates into main harmonics and calculates their product in future. You may use the indicator as a standalone product, but for better prediction accuracy there is another related indicator - FreqoMaster - which uses FreqoMeterForecast as a backend engine and combines several instances of FreqoMeterForecast for different frequency bands. Parameters: iPeriod - number of bars in the ma
Noize Absorption Index MT4
Ekaterina Saltykova
5 (1)
Noize Absorption Index - is the manual trading system that measures the difference of pressure between bears forces and bulls forces. Green line - is a noize free index that showing curent situation. Zero value of index shows totally choppy/flat market.Values above zero level shows how powerfull bullish wave is and values below zero measures bearish forces.Up arrow appears on bearish market when it's ready to reverse, dn arrow appears on weak bullish market, as a result of reverse expectation. S
TBP All in One
Dmitry Fedoseev
5 (2)
All patterns from Encyclopedia of Chart Patterns by Thomas N. Bulkowski in one indicator. It draws an up or down arrow whenever a pattern is identified. Patterns are selected in the drop-down list of the Pattern variable (located at the beginning of the properties window). The indicator has numerous external parameters, some of them apply to all patterns, while others are selective. To see more information on the parameters used for the selected pattern, enable the ShowHelp variable (located at
TradePilot
Hossein Khalil Alishir
TradePilot Expert Advisor (EA) for MetaTrader 4 TradePilot is a professional and user-friendly Expert Advisor (EA) for MetaTrader 4 (MT4) . It simplifies automated trading , risk management , and trade execution using a smart trading panel . Perfect for beginners and experienced traders looking for a reliable trade manager EA with automated lot size calculation . Key Advantages User-Friendly Trading Panel: Customizable panel with buttons and hotkeys. Smart Risk Management: Supports percen
"Impulses and Corrections 4" is created to help traders navigate the market situation. The indicator shows multi-time frame upward and downward "Impulses" of price movements. These impulses are the basis for determining the "Base" , which is composed of zones of corrections of price movements, as well as "Potential" zones for possible scenarios of price movement. Up and down impulses are determined based on a modified formula of Bill Williams' "Fractals" indicator. The last impulse is always "U
O indicador mostra padrões harmônicos no gráfico   sem repintar   com o mínimo de atraso possível. A busca por topos de indicadores é baseada no princípio de onda de análise de preços. As configurações avançadas permitem que você escolha parâmetros para seu estilo de negociação. Na abertura de uma vela (barra), quando um novo padrão é formado, uma seta da direção provável do movimento do preço é fixada, a qual permanece inalterada. O indicador reconhece os seguintes padrões e suas variedades: AB
This indicator is a must have tool that scans the active chart for candlestick patterns. It labels each bar according the candlestick pattern(s) that it finds enabling you to more easily analyze price action and be more informed about your trading decision. There are 103 common and uncommon possible patterns plus 6 new patterns based on research that the indicator can identify. If a candlestick(s) meets the requirements for multiple patterns, the bar will be labeled with up to 4 patterns names f
If you want to add a pattern indicator to confirm the market movement you are in the right place, this indicator permit to detect some famous candle patterns Hammer, Inverted Hammer, Shooting Star, Hanging Man and Engulfing patter that can be highlighted on your chart once the patters occurs. Up, Down arrows are traced at the beginning of the new bar each time a pattern is detected. Parameters Body to Bar Fraction (%) : the body size / the candle size (20% by default) Max Little Tail Fraction (
Os compradores deste produto também adquirem
Scalper Inside PRO
Alexey Minkov
4.74 (69)
Scalper Inside PRO – Since 2020. An exclusive indicator that utilizes an innovative algorithm to swiftly and accurately determine the market trend. The indicator automatically calculates opening, closing, and profit levels, providing detailed trading statistics. With these features, you can choose the most appropriate trading instrument for the current market conditions. Additionally, you can easily integrate your own arrow indicators into Scalper Inside Pro to quickly evaluate their statistics
Gann Made Easy
Oleg Rodin
4.83 (162)
Gann Made Easy é um sistema de negociação Forex profissional e fácil de usar, baseado nos melhores princípios de negociação usando a teoria do sr. W. D. Gann. O indicador fornece sinais precisos de COMPRA e VENDA, incluindo níveis de Stop Loss e Take Profit. Você pode negociar mesmo em movimento usando notificações PUSH. Entre em contato comigo após a compra para receber instruções de negociação e ótimos indicadores extras gratuitamente! Provavelmente você já ouviu muitas vezes sobre os métodos
M1 Sniper
Oleg Rodin
5 (22)
O M1 SNIPER é um sistema indicador de negociação fácil de usar. É um indicador de seta projetado para o período M1. O indicador pode ser usado como um sistema independente para scalping no período M1 e pode ser usado como parte do seu sistema de negociação existente. Embora este sistema de negociação tenha sido projetado especificamente para negociação no M1, ele também pode ser usado em outros períodos. Originalmente, desenvolvi este método para negociar XAUUSD e BTCUSD. Mas considero-o útil ta
Sinal de tendência GoldRush Arrow O indicador Sinal de tendência GoldRush Arrow fornece uma análise precisa e em tempo real das tendências, adaptada para scalpers de alta velocidade e curto prazo em XAU/USD. Criada especificamente para o intervalo de tempo de 1 minuto, esta ferramenta exibe setas direcionais para pontos de entrada claros, permitindo que os scalpers naveguem em condições de mercado voláteis com confiança. O indicador consiste em setas de alerta PRIMÁRIAS e SECUNDÁRIAS. Os sin
O sistema PRO Renko é um sistema de negociação altamente preciso especialmente concebido para a negociação de gráficos RENKO. Trata-se de um sistema universal que pode ser aplicado a vários instrumentos de negociação. O sistema neutraliza eficazmente o chamado ruído de mercado, dando-lhe acesso a sinais de inversão precisos. O indicador é muito fácil de usar e tem apenas um parâmetro responsável pela geração de sinal. Você pode facilmente adaptar a ferramenta a qualquer instrumento de negocia
Market Makers
Mohamed Hassan
5 (4)
After purchase, contact me privately to receive 1 month of free testing with EA Forex Proton! This advanced MT4 trading robot automatically executes signals from any MT4 indicator, including Market Makers. The latest version also includes AI integration, allowing each trade signal to be analyzed using Artificial Intelligence. Live Signal with EA Forex Proton: Click here Market Makers is a powerful price action trading system designed to identify high-probability Buy and Sell opportunities based
KuKl
IGOR KIRIANEN
The indicator is built on a non-standard Zig Zag, it draws accumulations after which if the price leaves this zone and a test of this zone occurs, then a sound signal is given and an arrow appears - after the test candle closes.The indicator does not redraw its signals, it is very easy to use, there are only three settings 1- this is the zig zag parameter 2- this is the minimum price exit from the zone 3- this is the maximum price exit from the zone. The lower the parameter for Zig Zag, the more
Advanced Supply Demand
Bernhard Schweigert
4.91 (300)
Atualmente com 40% de desconto! A melhor solução para qualquer Trader Novato ou especialista! Este indicador é uma ferramenta de negociação exclusiva, de alta qualidade e acessível porque incorporamos uma série de recursos proprietários e uma nova fórmula. Com esta atualização, você poderá mostrar fusos horários duplos. Você não só será capaz de mostrar um TF mais alto, mas também mostrar ambos, o TF do gráfico, MAIS o TF mais alto: MOSTRANDO ZONAS ANINHADAS. Todos os traders de Oferta e Demanda
Um indicador técnico que estrutura gráficos e identifica movimentos cíclicos de preços. Pode funcionar em qualquer gráfico. Vários tipos de notificações. Existem setas adicionais no próprio gráfico. Sem redesenhar a história, trabalha no fecho da vela. TF recomendado a partir de M5 e superior. Parâmetros fáceis de utilizar e configurar. Ao utilizar 2 indicadores com parâmetros diferentes, pode utilizá-los sem outros indicadores. Tem 2 parâmetros de entrada Ciclicidade e duração do sinal Estes
NAM Divergences
NAM TECH GROUP, CORP.
5 (1)
Indicador de detecção MT4 Multi-timeframe Divergence e Overbougt / Oversold. Características - Totalmente personalizável no painel de controle do gráfico, fornece interação completa. - Oculte e mostre o painel de controle onde quiser. - Informação em tempo real sobre divergências não capitalizadas. - Informações em tempo real sobre situações de sobrecompra / sobrevenda. - Informações em tempo real sobre divergências regulares. - Informações em tempo real sobre divergências ocultas. -
ACTUALMENTE 40% DE DESCONTO!! A melhor solução para qualquer novato ou comerciante especializado! Este indicador é uma ferramenta comercial única, de alta qualidade e acessível, porque incorporámos uma série de características proprietárias e uma fórmula secreta. Com apenas UM gráfico, dá alertas para todos os 28 pares de moedas. Imagine como a sua negociação irá melhorar porque é capaz de identificar o ponto exacto de desencadeamento de uma nova tendência ou oportunidade de escalada! Constr
Auto Optimized Parabolic RSI: Avançado Motor de Momentum 3D A maioria dos indicadores de varejo falha porque depende de parâmetros estáticos que quebram no momento em que a volatilidade do mercado muda. O Auto Optimized Parabolic RSI resolve o problema de "obsolescência do indicador" recalculando continuamente a sua própria vantagem matemática, trazendo uma adaptação quantitativa de nível institucional diretamente para o seu terminal MT5. A Vantagem Principal: Otimização 3D em Memória Personaliz
ACTUALMENTE COM 40% DE DESCONTO A melhor solução para qualquer novato ou comerciante especializado! Este Indicador é uma ferramenta comercial única, de alta qualidade e acessível, porque incorporámos uma série de características proprietárias e uma nova fórmula. Com apenas UM gráfico, pode ler a força da moeda para 28 pares de Forex! Imagine como a sua negociação irá melhorar porque é capaz de apontar o ponto exacto do gatilho de uma nova tendência ou oportunidade de escalada? Manual do util
RFI levels PRO
Roman Podpora
5 (1)
O indicador mostra com precisão os pontos de reversão e as zonas de retorno de preço onde o   Principais players . Você identifica onde novas tendências estão se formando e toma decisões com máxima precisão, mantendo o controle sobre cada negociação. VERSION MT5     -     Revela seu potencial máximo quando combinado com o indicador   TREND LINES PRO. O que o indicador mostra: Estruturas de reversão e níveis de reversão com ativação no início de uma nova tendência. Exibição dos níveis de   TAKE
O indicador " Dynamic Scalper System " foi desenvolvido para o método de scalping, operando dentro de ondas de tendência. Testado nos principais pares de moedas e ouro, é possível a compatibilidade com outros instrumentos de negociação. Fornece sinais para a abertura de posições de curto prazo ao longo da tendência, com suporte adicional para o movimento dos preços. O princípio do indicador: As setas grandes determinam a direção da tendência. Um algoritmo para gerar sinais de scalping sob a fo
O Apollo SR Master é um indicador de Suporte/Resistência com recursos especiais que tornam a negociação com zonas de Suporte/Resistência mais fácil e confiável. O indicador calcula as zonas de Suporte/Resistência em tempo real, sem qualquer atraso, detectando topos e fundos de preço locais. Em seguida, para confirmar a área de Suporte/Resistência recém-formada, o indicador exibe um sinal especial que indica que a zona pode ser considerada e usada como um sinal de VENDA ou COMPRA. Nesse caso, a f
Scalping Lines System -  é um sistema de scalping concebido especificamente para negociar o ativo Ouro (XAUUSD) em timeframes de M1 a H1. Combina indicadores de tendência, volatilidade e análise de mercado de sobrecompra/sobrevenda, reunidos num único oscilador para identificar sinais de curto prazo. Os principais parâmetros internos das linhas de sinal estão pré-configurados. Alguns parâmetros permanecem para ajuste manual: "Duração da Onda de Tendência", que regula a duração de uma série de
O Detetor de Terremoto do Mercado  Sismógrafo. Description in English : https://www.mql5.com/en/market/product/113869?source=Site+Market+Product+Page#description How to use the Seismograph : https://www.mql5.com/en/market/product/113869#!tab=comments&page=2&comment=52806941 Create an EA : https://www.mql5.com/en/market/product/113869#!tab=comments&page=3&comment=52816509 Seja qual for a maneira como você negocia, você definitivamente quer evitar a entrada no mercado de baixa liquidez.- O
Trend Screener
STE S.S.COMPANY
4.79 (95)
Indicador de tendência, solução única inovadora para negociação e filtragem de tendências com todos os recursos de tendências importantes construídos dentro de uma ferramenta! É um indicador multi-timeframe e multi-moedas 100% sem repintura que pode ser usado em todos os símbolos/instrumentos: forex, commodities, criptomoedas, índices e ações. OFERTA POR TEMPO LIMITADO: O indicador Support and Resistance Screener está disponível por apenas US$ 65 vitalício. (Preço original US$ 250) (oferta esten
Atomic Analyst
Issam Kassas
5 (5)
Primeiramente, vale ressaltar que este Indicador de Negociação não repinta, não redesenha e não apresenta atrasos, tornando-o ideal tanto para negociação manual quanto automatizada. Manual do utilizador: configurações, entradas e estratégia. O Analista Atômico é um Indicador de Ação de Preço PA que utiliza a força e o momentum do preço para encontrar uma vantagem melhor no mercado. Equipado com filtros avançados que ajudam a remover ruídos e sinais falsos, e aumentam o potencial de negociação.
Supply and Demand Dashboard PRO
Bernhard Schweigert
4.8 (20)
Actualmente 40% OFF ! Este painel é uma peça de software muito poderosa que trabalha em múltiplos símbolos e até 9 prazos. Baseia-se no nosso principal indicador (Melhores críticas: Advanced Supply Demand ).   O tablier dá uma óptima visão geral. Mostra:   Valores filtrados da Oferta e da Procura, incluindo a classificação da força da zona, Distâncias de/para as zonas e dentro das zonas, Destaca as zonas aninhadas, Dá 4 tipos de alertas para os símbolos escolhidos em todos os (9) períodos de
Super Signal – Skyblade Edition Sistema profissional de sinais de tendência sem repintar / sem atraso com taxa de acerto excepcional | Para MT4 / MT5 Funciona melhor em timeframes mais curtos, como 1 minuto, 5 minutos e 15 minutos. Principais características: Super Signal – Skyblade Edition é um sistema inteligente de sinais desenvolvido especificamente para operações com tendência. Utiliza uma lógica de filtragem em múltiplas camadas para detectar apenas movimentos direcionais fortes sustenta
Legacy of Gann
Pavel Zamoshnikov
4.83 (12)
The indicator very accurately determines the levels of the possible end of the trend and profit fixing. The method of determining levels is based on the ideas of W.D.Gann, using an algorithm developed by his follower Kirill Borovsky. Extremely high reliability of reaching levels (according to K. Borovsky  - 80-90%) Indispensable for any trading strategy – every trader needs to determine the exit point from the market! Precisely determines targets on any timeframes and any instruments (forex, met
CRYSTAL HEIKIN ASHI SIGNALS MT4 Professional Trend Detection Indicator with Smart Entry Signals See the Trend. Catch the Move. Trade with Confidence. The professional Heikin Ashi indicator built for traders who want clarity, precision, and EA-ready signal automation. WHAT IS CRYSTAL HEIKIN ASHI SIGNALS? Crystal Heikin Ashi Signals is a professional-grade MetaTrader 4 indicator that combines pure Heikin Ashi candle visualization with an advanced momentum-shift detection system. Designed for both
Documentation for connecting Metatrader 4 with Python with a simple drag and drop EA.   A full end-to-end solution ,fully tested ,fast and efficient! The Pytrader ecosystem consists of a python script and a MT4 EA. (  MT5  version ) Further for the licensing an indicator is used.  The communication between the python script and the EA is based on sockets. EA is the  Server   and the python script the  Client .  It is always query(function / python script) and output(data / server). The EA doe
Indicador NextCandlePredictor NextCandlePredictor, um indicador de sinal com alerta que não repinta, não muda de cor, não se move, não desaparece e não tem lag. Ele ajudará a identificar a direção da próxima ou próximas velas em qualquer período de tempo. Altamente recomendado para mercados de alta volatilidade, como Nova York, Londres ou até mesmo a sobreposição de ambos. Principais Características: Versatilidade em Timeframes: Fornece sinais rápidos e precisos em qualquer timeframe, de M1 a H1
KURAMA GOLD SIGNAL PRO (MT4) — Sistema completo XAUUSD com filtro de 7 camadas SEM REPAINT SEM REDESENHO SEM ATRASO Cada sinal é permanente. BÔNUS: Compre a licença vitalícia e receba AI Zone Radar ($59) + manual PDF GRÁTIS. Envie mensagem após a compra. AI Zone Radar: https://www.mql5.com/en/market/product/175834 7 FILTERS 7 filtros independentes: Volatilidade, Estrutura MA, Direção tendência, Ângulo MA, Timeframe H4, RSI, Bloqueio penetração. A maioria usa 1-2 filtros. Es
Full Scalping Signal
Leandro Bernardez Camero
FullScalping é um indicador não repintante e não retroativo , especialmente projetado para gerar entradas de scalping CONSTANTES em qualquer mercado. Perfeito para traders agressivos que buscam ação ininterrupta! Junte-se ao canal para ficar atualizado com informações exclusivas e atualizações: https://www.mql5.com/en/channels/forexnewadvisor Você notará que ele dá sinais em quase toda vela , seja confirmando a tendência ou sinalizando retrações-chave. É como ter um radar constantemente guiand
Pare de adivinhar. Comece a operar com vantagem estatística. Os índices de ações não são negociados como forex. Eles têm sessões definidas, gaps noturnos e seguem padrões estatísticos previsíveis. Este indicador fornece os dados de probabilidade que você precisa para operar índices como DAX, S&P 500 e Dow Jones com confiança. O que o torna diferente A maioria dos indicadores mostra o que aconteceu. Este mostra o que provavelmente acontecerá em seguida. Todos os dias de negociação, o indicador an
Volatility Trend System - um sistema de negociação que dá sinais para entradas. O sistema de volatilidade fornece sinais lineares e pontuais na direção da tendência, bem como sinais para sair dela, sem redesenho e atrasos. O indicador de tendência monitora a direção da tendência de médio prazo, mostra a direção e sua mudança. O indicador de sinal é baseado em mudanças na volatilidade e mostra entradas no mercado. O indicador está equipado com vários tipos de alertas. Pode ser aplicado a vários i
Mais do autor
Candle Perspective Structure Indicator MT5 is a simple indicator that defines and displays the candlestick structure of the market. This indicator will suit both experienced traders and beginners who find it difficult to follow the structure visually. If you want to see more high-quality products or order the development/conversion of your own products, visit my partners' website: 4xDev Get 10% OFF on manual strategies automation services or indicator development/conversion services at 4xDev
FREE
Overview The Market Perspective Structure Indicator is a comprehensive MetaTrader indicator designed to provide traders with a detailed analysis of market structure across multiple timeframes. It identifies and visualizes key price action elements, including swing highs and lows, Break of Structure (BOS), Change of Character (CHOCH), internal structures, equal highs/lows, premium/discount levels, previous levels from higher timeframes, and trading session zones. With extensive customization opt
Zero Lags SMA MT5
Mykola Khandus
5 (1)
Zero Lag SMA for MT5 The Zero Lag SMA (ZLSMA) indicator for MT5 provides a variation of the Simple Moving Average (SMA) designed to minimize lag, offering traders a more responsive moving average that adjusts more quickly to price changes. This makes it useful for identifying potential trend reversals and key price levels in a timely manner. If you want to see more high-quality products or order the development/conversion of your own products, visit my partners' website: 4xDev Get 10% OFF on m
FREE
Overview The Market Perspective Structure Indicator is an indicator designed to provide traders with a detailed analysis of market structure across multiple timeframes. It identifies and visualizes key price action elements, including swing highs and lows, Break of Structure (BOS), Change of Character (CHOCH), internal structures, equal highs/lows, premium/discount levels, previous levels from higher timeframes, and trading session zones. With extensive customization options, this indicator is
Overview The Williams VIX Fix Indicator is a MetaTrader 5 tool designed to help traders identify potential market tops and bottoms. By analyzing price extremes relative to recent highs and lows, it highlights overbought and oversold conditions using two histograms displayed in a separate window. The indicator combines the Williams VIX Fix calculation with Bollinger Bands and percentile-based thresholds to provide clear signals for potential reversals.  Key Features Market Tops and Bottoms Market
ATR Bands with Take-Profit Zones for MT5 Optimize your risk management and trading strategy with the ATR Bands indicator for MT5 – a powerful tool designed to help you navigate market volatility, identify key price levels, and set realistic stop-loss and take-profit targets. Key Features: ATR-Based Bands : The core of this indicator relies on the Average True Range (ATR) to calculate dynamic upper and lower bands that adapt to market volatility. The bands provide a clear indication of potential
FREE
ATR Bands with Take-Profit Zones for MT4 The ATR Bands indicator for MT4 is designed to assist traders in managing risk and navigating market volatility. By using the Average True Range (ATR), it helps identify key price levels and set realistic stop-loss and take-profit zones. Key Features: ATR-Based Bands : The indicator calculates dynamic upper and lower bands using ATR. These bands adjust based on price volatility, helping to indicate potential support and resistance levels. Customizable Par
FREE
Overview The %R Trend Exhaustion Indicator is a powerful technical analysis tool adapted from TradingView for MetaTrader 4. It helps traders identify trend exhaustion points, potential reversals, and trend continuation signals across various market conditions. With multiple display modes, customizable settings, and enhanced features, this indicator is suitable for diverse trading strategies. If you want to see more high-quality products or order the development/conversion of your own products,
Overview The Williams VIX Fix Indicator is a MetaTrader 4 tool designed to help traders identify potential market tops and bottoms. By analyzing price extremes relative to recent highs and lows, it highlights overbought and oversold conditions using two histograms displayed in a separate window. The indicator combines the Williams VIX Fix calculation with Bollinger Bands and percentile-based thresholds to provide clear signals for potential reversals.  Key Features Market Tops and Bottoms Market
Market Structure Oscillator Overview The Market Structure Oscillator is a technical indicator designed for MetaTrader platforms to analyze market trends across multiple timeframes. It provides a clear visualization of short-term, intermediate-term, and long-term market structures through an oscillator and histogram display in a separate window. The indicator also supports optional chart objects to highlight key market structure points. Features Displays a composite oscillator combining short-ter
MACD ADX Oscillator – a powerful indicator that combines the best of the Moving Average Convergence Divergence (MACD) and the Average Directional Index (ADX) to provide unparalleled insights into market momentum and trend strength. Key Features: Dual Momentum Analysis: This indicator merges MACD's ability to detect changes in market momentum with ADX's strength measurement, giving you a comprehensive view of the market's direction and power. Customizable Settings: Tailor the indicator to your t
Percentage Price Oscillator (PPO) for MT5 – a dynamic tool designed to measure price momentum and trend direction with precision. Core Features: Flexible Configuration : Customize the PPO to match your trading approach by adjusting the Fast Length, Slow Length, and Signal Length. The indicator is also versatile enough to adapt to any market condition with various source inputs. Intuitive Histogram Display : Choose to visualize the difference between the PPO and Signal lines with a histogram, pro
Chandelier Exit for MT5 The Chandelier Exit indicator is designed to dynamically set stop-loss levels based on market volatility, measured through the Average True Range (ATR). Key Features: ATR-Based Stops : The indicator calculates stop-loss levels for long and short positions using a moving average of the True Range (ATR), adapting to market volatility changes. Customizable Parameters : Users can set the ATR period, ATR multiplier, and choose whether to use the closing price to determine pric
Overview Heiken Ashi CE Filtered MT5 is a technical indicator for the MetaTrader 5 platform. It integrates smoothed candlestick charting with a dynamic exit strategy and a customizable trend filter to deliver clear buy and sell signals. The indicator is designed to improve trend detection and signal reliability by reducing market noise. If you want to see more high-quality products or order the development/conversion of your own products, visit my partners' website: 4xDev Get 10% OFF on manual
Triple EMA Trend Following + Signals indicator is a tool for traders who are looking for accurate trend identification and buy/sell signals! Key Features: Triple EMA Trend Analysis: This indicator uses two Triple Exponential Moving Averages (TEMA1 and TEMA2) to capture short-term and long-term trends effectively. TEMA1 reacts to rapid price changes, while TEMA2 filters out market noise, helping you stay on the right side of the trend. RSI and ATR Filters: It incorporates the RSI (Relative Streng
Trend Lines Supports and Resistances is an indicator that analyses the market structure, identifies Pivot Points, displays active Support/Resistance zones and trend levels. Main Features: Defining and displaying Pivot Points. Analyse Pivot Points to build and display trend lines. Setting up visual display of trend lines. Setting up trend lines broken notifications. Analyse Pivot Points to define and display support and resistance levels. Setting up visual display of support and resistance leve
Trend Levels Indicator Elevate your trading strategy with the Trend Levels Indicator , a sophisticated tool designed to detect market trends and highlight critical price levels. This cutting-edge indicator is packed with features to simplify trend analysis and empower your decision-making process. Key Features: Dynamic Trend Levels : Accurately plots high, mid, and low levels based on market dynamics. Custom Alerts & Notifications : Get real-time alerts and notifications when trends change, ensu
Overview The %R Trend Exhaustion Indicator is a versatile technical analysis tool for MetaTrader 5, adapted from a popular TradingView indicator. It is designed to help traders identify trend exhaustion points, potential reversals, and trend continuation signals across various market conditions. The indicator offers multiple display modes and customizable settings to suit different trading strategies, enhanced with additional features to improve its functionality in the MetaTrader 5 environment.
Overview Harmonic Patterns MT5 is a technical analysis indicator designed for the MetaTrader 5 platform. It identifies and displays harmonic price patterns, such as Butterfly, Cypher, Crab, Bat, Shark, and Gartley, in both bullish and bearish directions. The indicator calculates key price levels, including entry, stop loss, and three take-profit levels, to assist traders in analyzing market movements. Visual elements and customizable alerts enhance usability on the chart. Features Detects six ha
Overview Short-Term Basket EA MT5 is an Expert Advisor for the MetaTrader 5 platform, designed to manage a sequence of trades with a basket trading strategy, aiming to achieve a specified profit target. Features Opens an initial trade in a user-specified direction. Reopens a trade in the same direction with the same lot size and target if the previous trade closes in profit. Opens a hedge trade in the opposite direction with the same lot size and target, plus an additional trade in the opposite
The Koncorde Plus Indicator is a sophisticated and versatile technical analysis tool for MetaTrader 5 (MT5), meticulously converted and enhanced from the acclaimed Koncorde [+] indicator on TradingView. Optimized for Forex volume analysis while preserving the original algorithm for all volume-based markets, it integrates six core components—four trend-based (RSI, MFI, Bollinger Bands, Stochastic) and two volume-based (Positive Volume Index (PVI) and Negative Volume Index (NVI))—to deliver a comp
Market Structure Oscillator Overview The Market Structure Oscillator is a technical indicator designed for MetaTrader platforms to analyze market trends across multiple timeframes. It provides a clear visualization of short-term, intermediate-term, and long-term market structures through an oscillator and histogram display in a separate window. The indicator also supports optional chart objects to highlight key market structure points. Features Displays a composite oscillator combining short-ter
Filtro:
Sem comentários
Responder ao comentário