Clusters Chart MT5
- 지표
-
Evgeny Shevtsov
 Indicators for volume trading :
Volume profile,
Classic profile,
Clusters chart,
Demand and supply levels,
Demand and supply diagram,
Cumulative delta.
Indicators for probabilistic analysis :
Monte Carlo predictor,
Neural predictor. - 버전: 3.4
- 업데이트됨: 30 4월 2026
- 활성화: 10
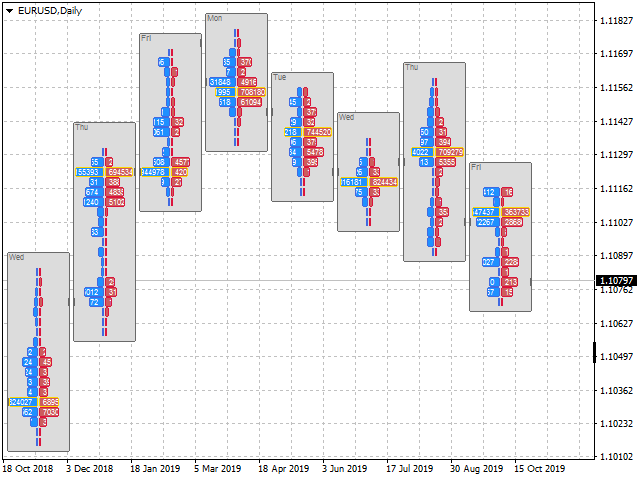
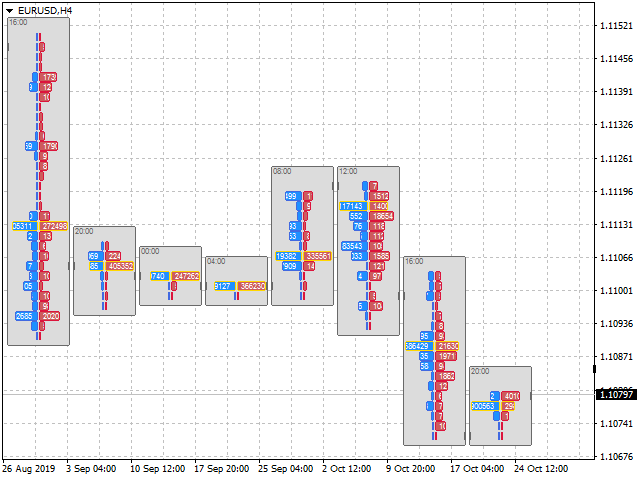
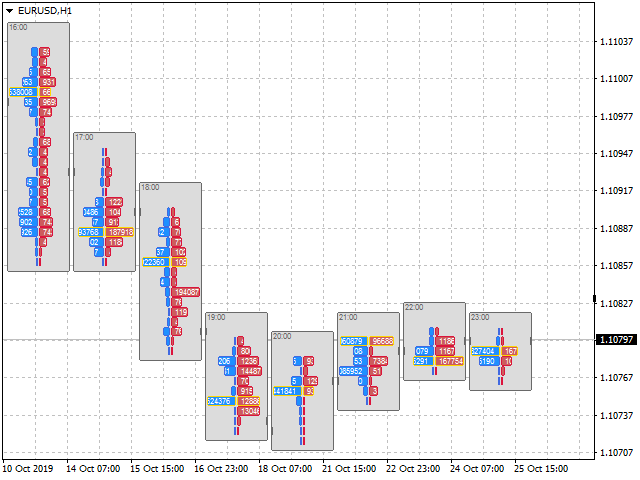
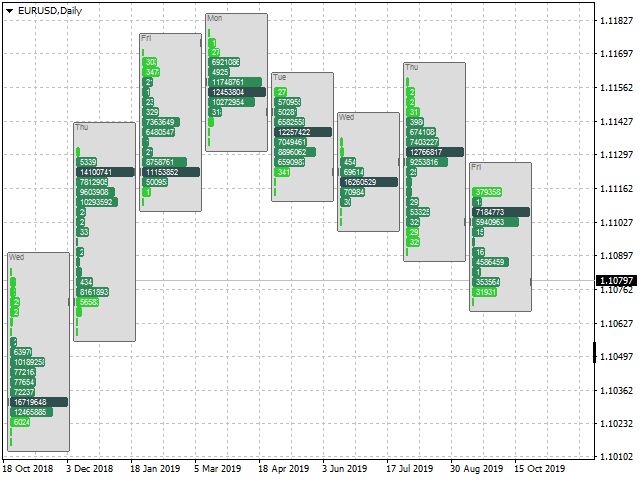
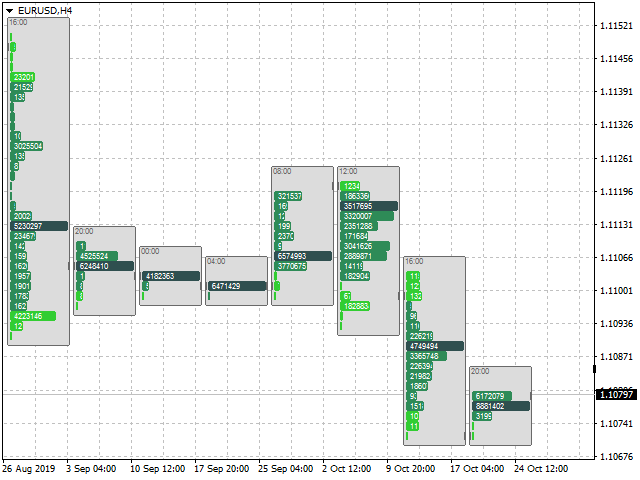
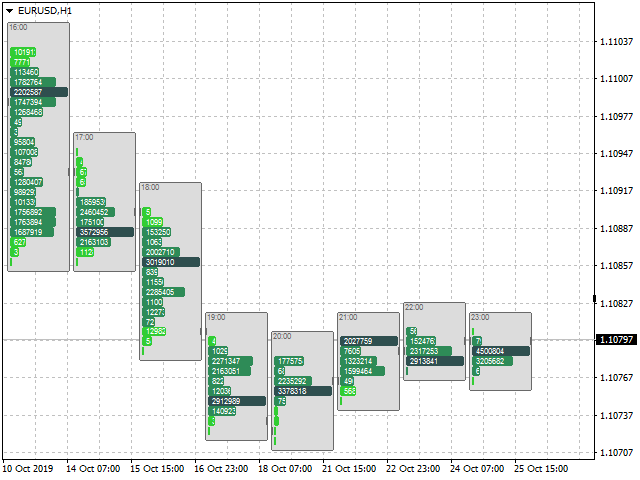
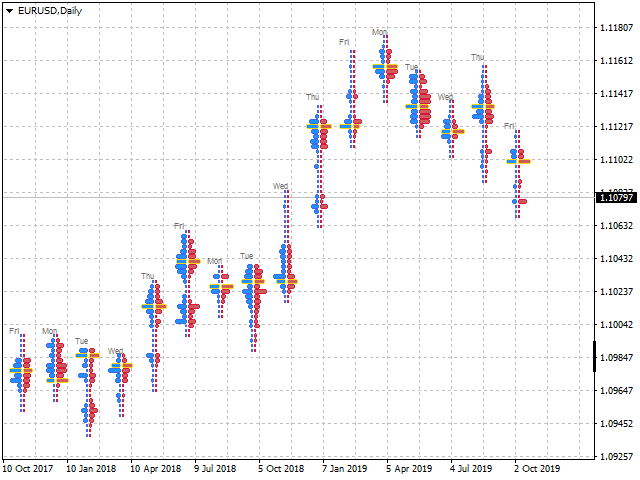
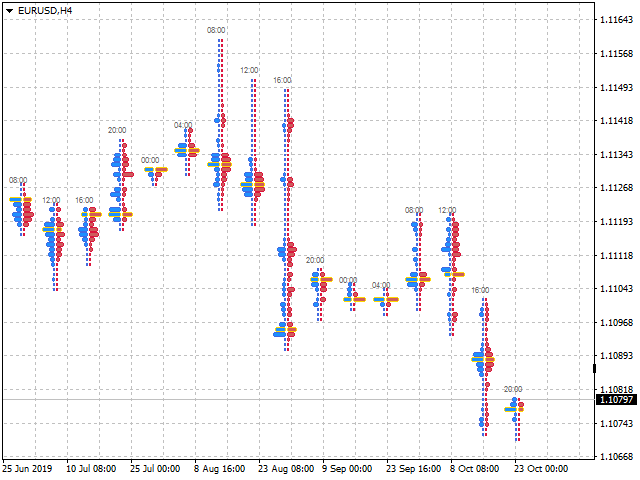
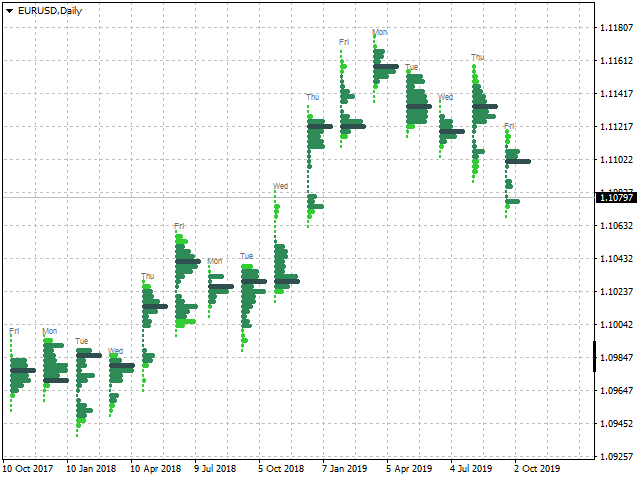
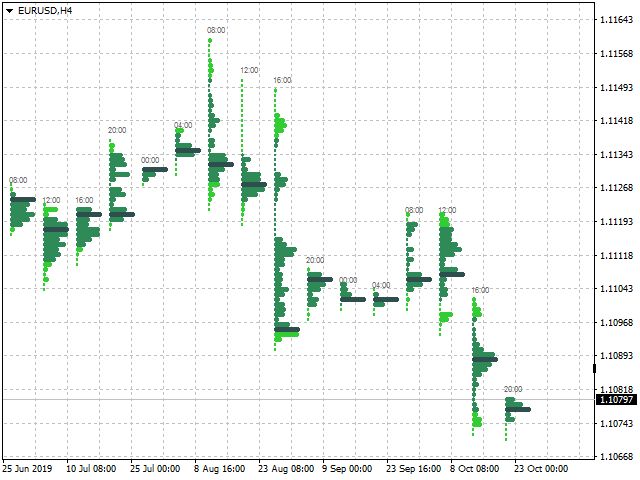
The indicator displays volume clusters or volume profiles to choose from.
For trading symbols which contain the tape of deals, the indicator can perform calculations based on the tape of deals.
Input variables
StepPoint - cluster step in points, if the value is zero, the step is assigned automatically.
HistoryTicks - size of tick history (for VolumeType in the mode TimeAndSales).
AssociatedTimeframe - binding the indicator to the specified timeframe of the chart, if the value is equal to Current, the indicator works on all timeframes.
ClustersVolume - volume in clusters:
- All - all volume.
- Active - active volume (which produced the price movement).
ClustersAsDelta - difference between the volume of buyers and sellers.
ProfilesVolume - volume in profile clusters:
- All - all volume.
- Active - active volume (which produced the price movement).
ProfilesAsDelta - difference between the volume of buyers and sellers.
ProfilesValueArea - size of profile value area.
ProfilesValueAreaType - value area calculation mode:
- OfPocND - distribution relative to POC level.
- OfTotalVolume - distribution relative to the volume traded in the profile.
FramesDelta - display of aggregate delta for each clusters frame.
FramesCompare - normalize the visual length of clusters relative to the maximum volume cluster in the chart window.
SignReverse - reverse of the volume of clusters (buyers as sellers, and sellers as buyers).
VolumeType - type of volumes used for calculations:
- Tick - tick volumes.
- Real - real volumes (if it broadcast from a broker).
- Without - alternative mode, without the volumes.
- TimeAndSales - tape of deals.
The rest of the variables are related to color settings, and their purpose is clear from their name.
Indicator features
During operation, the indicator changes the scale of the chart on the price axis, and also replaces the image of the chart, as a result, the operation of some other indicators in the chart window may be incorrect.
For trading symbols that have the tick history without the content of the tape of deals, an interpretation algorithm is
automatically applied:
- Each positive Ask tick is interpreted as the unit of volume to buy.
- Each negative Bid tick is interpreted as the unit of volume to sell.
This algorithm works only in the mode VolumeType=TimeAndSales and is relevant mainly for currency pairs.
In the modes Tick, Real and Without the indicator does not work on the timeframe M1.


Very well thought and contructed Foot Print Chart for MT5.