MetaTrader 5용 Expert Advisor 및 지표 - 162

Congratulations — this is your first description today not written by ChatGPT. My goal was to design something straightforward and reliable: a stock manager that’s honest, and easy to use. Live signal! Price will increase to $699 once the live signal achieves +75% gain.
Choose your stocks, set your risk, and let Atlas Advisor do the rest. It finds high-quality entries, scales into trades with controlled stop losses, and secures profits when market conditions weaken. Backtests show equity

Introducing Golduxe EA . It is a Fully Automatic System trading Gold on US Open. No Martingale, No Grid , No Averaging, No AI Current Price: $149--> (Next price $249) Live Signal - https://www.mql5.com/en/signals/2327717
******* FEATURES ******* Buy only and Sell only Settings Individual TSL and SL settings for Buy and Sell Orders Trading on XAUUSD Pair This is a Daily Breakout Strategy during the Early US Open Session.
Each order is always protected by Stop-Loss and Trailing SL.
Easy to
EZ Trends 는 실시간으로 시장 구조 변화를 쉽게 식별할 수 있도록 설계된 정밀 트렌드 탐지 지표입니다.
독창적인 EMA–HMA 하이브리드 밴드 시스템을 사용하여 캔들 색상을 자동으로 변경해 추세 방향을 강조하고, 새로운 추세 시작 시 반응 레벨을 표시합니다.
그 결과, 트레이더가 모멘텀에 맞추어 시장 잡음을 걸러낼 수 있도록 돕는 실용적인 도구가 됩니다. 주요 기능 추세 탐지 로직: EMA와 HMA 평균을 기반으로 한 3라인 채널. 캔들의 평균 범위를 이용해 상/하단을 동적으로 확장. 변동성에 즉각 대응하며, 압축/확장 및 돌파 가능성을 보여줌. 상승 추세: 종가가 상단 밴드 위에서 마감. 하락 추세: 종가가 하단 밴드 아래에서 마감. 캔들이 자동 색상 변경 (라임 = 상승, 파랑 = 하락). 추세 시작 레벨: 새 추세 시작 시 극단적인 고점/저점 고정. 점선 수평선으로 표시해 재테스트/검증 구역 제공. 시각적 레이아웃: 중앙선: EMA + HMA 평균 (점선). 상단/하단:

PrimeTrader EA – Intelligence Refined PrimeTrader EA is a sophisticated automated trading system built to deliver structured performance across changing market conditions. By blending multiple analytical engines into a single decision framework, it focuses on precision, adaptability, and disciplined execution. The system manages trades intelligently from entry to exit, applying protective logic and session-based control while keeping you informed through a clean, real-time information panel. De

Master Breakout Basic Trading EA -> Try upgrade version Professional Master Breakout EA | Upgrade to Unlimited Master Breakout EA Smart breakout trading system with advanced money management and broker auto-detection Key Features Multiple Trading Strategies Trend continuation signals Range breakout detection Momentum-based entries Support/resistance breaks Advanced Money Management Fixed lots, risk percentage, or balance-based sizing Risk-reward ratio calculations Partial take profit func

Please note: This Expert Advisor (EA) is provided as a framework. It is not pre-optimized. It has been created for you, the trader, to have a powerful and flexible tool to test, refine, and optimize according to your own trading style and risk tolerance. Unleash the power of trend trading with the TrendMaster Pro EA, available for just $30. This Expert Advisor is a sophisticated, fully customizable trend-following system designed to give you a robust foundation for building your own automated st
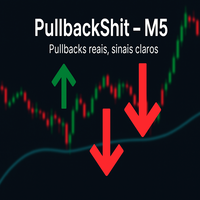
PullbackShit은 5분 타임프레임에서 객관적인 풀백 진입점을 찾는 트레이더를 위해 설계된 지표입니다.
가격과 이동 평균의 상호 작용을 기반으로 차트에 잠재적인 매수 및 매도 지점을 명확한 시각적 화살표로 표시합니다. 주요 기능: 검증된 풀백: 가격이 평균으로 돌아가고 움직임을 확인할 때만 신호 생성. 명확한 시각적 신호: 차트에 녹색(매수) 및 빨간색(매도) 화살표 표시. 노이즈 필터: 연속적인 신호를 피해 신뢰성 향상. M5 전용: 5분 타임프레임에 최적화. 권장 사항: 자산의 추세에 반대되는 신호는 거래하지 않는 것이 좋습니다. 중요한 경고! PullbackShit은 매우 복잡하고 정밀하며 민감한 분석 코드를 기반으로 MetaTrader 5 플랫폼용으로 개발되었으며, 5분 차트에서만 작동합니다. 사용 방법: M5 차트에서만 사용하세요. 인디케이터를 추가한 후에는 시간 프레임을 변경하지 마세요. “신호 설정 수정 허용” 박스는 체크하지 마세요.

UltraScalper – Precision Scalping, Maximum Control Unlock the power of fast, intelligent, and risk-managed trading with the Ultra Scalper – a professional MT5 scalping Expert Advisor designed for traders who demand precision, adaptability, and consistent opportunities in the market. Write me in personal messages to get .set files Key Features: Smart Entry Logic – Combines EMA crossover, RSI filtering, and fractals for accurate high-probability scalping signals. Dynamic Risk Management –

AurumX Trend — Ride the Gold Wave with Precision
“AurumX Trend — Institutional Gold Trading on H4. Proven since 2018.”
What Makes AurumX Trend Different? Built for Gold Only – not a “one size fits all” EA. Engineered for XAUUSD. Trend-Focused on H4 – no scalping, no grid, no martingale. Pure directional trading. Institutional Risk/Reward – average win more than twice the average loss. 7+ Years of Proven Results – tested across bull, bear, and ranging markets since 2018. High Statistical Confi

TrendMaster Pro Price: $30 Please note at the beginning that this indicator is not optimized . It is a powerful and fully customizable tool created for you to adjust and optimize according to your specific trading style, preferred financial instruments, and timeframes . Discover the core of market trends with TrendMaster Pro, a sophisticated indicator designed to provide a clear and visually intuitive representation of trend direction and strength. This tool is meticulously engineered to help yo
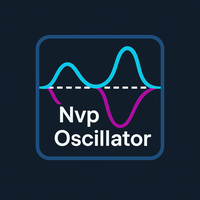
NVP Oscillateur
is a professional trading indicator designed to help traders identify overbought and oversold conditions in the market with high precision. Using optimized calculation algorithms, it provides a clear and easy-to-read oscillator that highlights potential market turning points. Key Features: Fast detection of possible reversal zones. Effective in both trending and ranging markets. Clean and user-friendly visual display. Works on all instruments: Forex, indices, stocks, cryptocurr

Cycle RSI Adaptive – 스마트 인디케이터로 트레이딩 향상 1. 개요 Cycle RSI Adaptive는 전통적인 RSI의 업그레이드 버전으로, 트렌드, 반전, 트레이딩 기회를 더 높은 정확도로 식별하도록 설계되었습니다. 스마트 노이즈 필터링, 시장 적응형 조정, 명확한 신호를 갖추고 있어 초보자와 전문 트레이더 모두에게 이상적인 인디케이터입니다. 주요 이점: 사용이 간편하며, 저자로부터 자세한 안내를 받을 수 있습니다. 수동 트레이딩 또는 자동 시스템(EA/백테스팅)에 최적화. 잘못된 신호를 최소화하여 트레이딩 자신감을 높입니다. 2. 가격 및 조기 구매자 제안 런칭 기간(2025년 8월 17일 – 2025년 9월 30일): 30달러 / 6개월 50달러 / 연간 2025년 9월 30일 이후: 35달러 / 6개월 59달러 / 연간 특별 제안 : 조기 구매자는 할인된 가격으로 풀 버전에 액세스하고 저자의 직접 지원을 받을 수 있습니다. 3. Cycle RSI Adapti
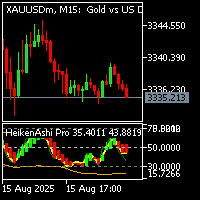
The Heiken Ashi Pro indicator is a combination of many indicators to give signals to help traders choose the appropriate entry point. Indicator has feature to send signal to telegram when there is buy/sell signal
The indicator outputs convenient indicators for EA developers to integrate into their automated strategies.
Input indicators to calculate the indicator:
InpRSIPeriod: fill in the calculated value for RSI
InpAppliedPrice: configure to take according to price (close, open, high, low ...

1분만 멈춰서 확인해보세요… 분명 마음에 드실 거예요! "Ninja Hedging Trend EMA RSI" EA 는 스마트 헤징 으로 자본을 보호하고, EMA 200 으로 트렌드를 따라가며, RSI 14 로 진입 시점을 확인하는 로봇입니다!
모든 것을 통제된 마틴게일 로 리스크를 관리하면서! 왜 마음에 드실까요? 어떤 마켓에서도 작동 (EURUSD, GBPUSD, XAUUSD 등) 이익/손실 자동 종료 (스트레스 없이!) 당신의 스타일에 맞춤 : 고정 로트 or 마틴게일? 선택은 당신에게! ※ 실계좌에서 사용하기 전에 꼭 테스트하세요! (SET 파일 포함 + 백테스트 필수) 지금 다운로드하고 놀라움을 경험하세요! MQL5 마켓플레이스 등록 설명 - "Ninja Hedging Trend EMA RSI" "Ninja Hedging Trend EMA RSI" EA로 트레이딩을 업그레이드하세요!

WHOOSH – 스마트 하이켄 아시 그리드 EA
MT4 버전: https://www.mql5.com/en/market/product/142798 MT5 버전: https://www.mql5.com/en/market/product/142799
WHOOSH는 시장 모멘텀을 신속하게 포착하고, 포지션을 동적으로 관리하며, 포괄적인 위험 관리를 통해 계정을 보호하도록 설계된 스마트한 다중 시간대 하이켄 아시 기반 전문가 자문(EA)입니다.
이 EA는 추세 필터링, 제어된 그리드 평균화, 유연한 자금 관리 기능을 결합하여 외환, 금(XAUUSD), 지수 등 다양한 상품에 대한 스캘핑 및 스윙 트레이딩을 지원합니다.
주요 기능 다중 시간대 하이켄 아시 확인 세 개의 서로 다른 시간대에서 추세가 확인된 경우에만 입력을 처리하여 잘못된 신호를 줄입니다. 스마트 그리드 및 헤징 맞춤형 PipStep 및 Multiplier를 통한 평균화 옵션 양방향 헤지(매수/매도 동시) 또는 배타적 모드(

KIOBI VISION KIOBI VISION is a multi-factor analysis indicator designed for professional traders who want a clear and structured view of the market across multiple time frames.
Objective
The indicator offers a unique summary table that combines several technical tools (RSI, MACD, Stochastics, Vortex, Momentum, PSAR, DMI, MFI, Fisher, and general trend) to provide reliable and quick-to-interpret buy and sell signals.
Key Features Multi-timeframe analysis (M1 → MN): a consolidated view of the

MERGER EA: The Fusion of Precision and Profit Unlock the full potential of your trading with Merger. Highly optimized for GBPJPY on the M5 timeframe, use default settings adjusted timezone settings to avoid one hour before and after New York market close. The advanced MQL5 Expert Advisor built for intelligent and fast price action trading. Designed to excel especially on the GBPJPY currency pair, with proven performance on others like USDCHF, and other JPY pairs. MERGER is the definitive tool

Hello community, on this occasion I'm here to introduce you to
Universal Professional Trading System
MAIN PURPOSE This is an advanced and universal technical indicator designed to work in any market (Forex, Metals, Cryptocurrencies, etc.) and any timeframe. It's not an EA that trades automatically, but rather a comprehensive analysis and signals system. KEY FEATURES 1. AUTOMATIC SYMBOL DETECTION
Automatically identifies asset types (Forex, Gold, Silver, Crypto, JPY pairs) Automatically
Introduction: The Basic Automatic Swing Detector MT4 is designed exclusively for the MetaTrader 5 platform. It displays three different market levels, helping traders identify critical price zones and pinpoint the most optimal entry and exit points for their chosen symbols.
Our Team Services: If you are want to see our products click the link: LINK If you have an idea you'd like to develop into an application, click the link: LINK
Category: Platform: MetaTrader 5 Type: Indicator Level: Interme

GEN TrendPivot Hunter Developer: Gede Egi Overview GEN TrendPivot Hunter is a multifunctional indicator for MetaTrader 5. It combines Pivot-based Support & Resistance, Fair Value Gaps (FVG), and Trendlines into one analytical tool. The indicator helps visualize possible price reaction areas and market structures directly on the chart. All drawing styles, alerts, and notifications can be customized through the input parameters. The tool does not generate trading signals automatically; it is inte

과도한 거래, 감정적인 주문 또는 과도한 계좌 손실로 고민한 적이 있습니까?
Risk Guardian EA MT5는 당신만의 전용 위험 관리 도우미입니다 — 자동으로 거래를 열지 않으며, 대신 다음을 도와줍니다: 일일 리스크 엄격히 관리
연속 손실 후 복수 거래 방지
거래 규율 강화
장기적으로 안정적인 자산 곡선 유지 이 EA는 거래 전략이 아니며, 수동 거래 또는 다른 EA를 위한 포괄적인 자본 위험 관리 보호를 제공합니다. 주요 기능
일일 손익 보호 당일 청산된 주문의 총 손익을 실시간 계산 일일 손실 한도 도달 시 거래 금지 제한 기간 동안 열린 신규 포지션은 강제로 청산 연속 손실 관리 연속 손실 자동 감지 한도 도달 시 냉각 기간(예: 2시간) 시작 냉각 기간 동안 열린 신규 포지션은 즉시 청산 포지션 보유 시간 제한 최대 보유 시간을 초과하면 자동으로 포지션 청산 다중 시간대 EMA 추세 필터 진입 시 M5와 M15 EMA 추세가 모두

The Gold Pulverizer – Professional Gold Trading Robot The Gold Pulverizer is a fully automated Expert Advisor designed exclusively for trading Gold (XAUUSD) .
Unlike generic EAs, it has been fine-tuned to capture the unique volatility and behavior of the Gold market, providing high-precision entries and strict risk management. ️ Key Features Specialized in Gold (XAUUSD) – optimized for the unique movement of Gold. Smart Buy & Sell signals based on Fair Value Gaps (FVG) . Daily Loss Protec

Bitcoin Manager Panel is designed for traders to take advantage of automated trading and catch in a fast mode strategy positions which reach to fibonacci levels. It is mostly created for crypto currency trading because of high volatility and fibonacci retracement respecting levels. All in all it has a module Fibo as it can be seen on the panel which if clicked it will plot fibonacci indicator automatically and trade only when an important level of fibo is found and broken.

The Adaptive Trend EA is engineered to address a common trading challenge: using the right tool for the right market condition. Instead of relying on a fixed method, this EA dynamically adapts its core logic based on the strength of the current trend. The goal is to improve signal accuracy and reduce trades taken in unfavorable market environments. Core Feature: The Adaptive Moving Average This is the heart of the system. The EA constantly monitors the ADX indicator to gauge trend strength:

MSS_Pro_MTF is a professional multi-timeframe swing trading Expert Advisor designed for MetaTrader 5 platform. This system combines advanced swing identification techniques with Fibonacci trading strategies to accurately capture market trends while maintaining strict risk control. Key Features: Multi-Timeframe Analysis
Monitors high/low timeframes (customizable) simultaneously - identifies trend direction on higher timeframe and precise entries on lower timeframe Intelligent Swing Detection
Pr
Screens realtime- https://t.me/ +rEuJQo8zHLllMzgy in Signals.Metals.etc
VI Calculator is a professional MetaTrader 5 indicator that analyzing volume at the moment. This synergy allows traders to evaluate both the strength of market movements and overbought/oversold conditions at the same time. The indicator automatically processes market data and provides clear trading signals directly on the chart in the form of arrows and text recommendations. It is ideal for identifying entry and exit p

Volatility Bar Colorizer: See Spikes & Squeezes Instantly Stop guessing if a market move is significant. The Volatility Bar Colorizer is a professional-grade indicator that instantly reveals the hidden strength behind every candlestick, allowing you to trade with greater clarity and confidence. By intelligently coloring bars based on their size relative to the Average True Range (ATR), this powerful tool cleans up your chart and lets you see high-momentum spikes and low-volatility squeezes at a

The Trend Confirmation Dashboard is a powerful MetaTrader 5 indicator designed to provide an at-a-glance overview of the market trend across multiple timeframes. By consolidating trend information into one convenient on-chart panel, traders can quickly assess the strength and alignment of trends without switching between charts. This tool is perfect for traders who use multi-timeframe analysis to confirm trade entries, identify the dominant market direction, and avoid trading against stronger u

EA DOCUMENTATION
#property copyright "ISP Trading System" #property link "" #property version "1.00" #property strict #include <Trade/Trade.mqh> #include <Trade/SymbolInfo.mqh> #include <Trade/PositionInfo.mqh> input double InpLotSize = 0.1; input int InpStopLoss = 200; input int InpTakeProfit = 400; input ulong InpMagicNumber = 2024; input bool InpCloseOnOpposite = true; input string InpSignalPrefix = "I

Ninja Moving Average Crossover + Martingale (Alternate Lots) Ninja Moving Average Crossover 는 이동평균선(MA) 크로스 신호 와 교대 로트 마팅게일 전략 을 결합하여 매매를 자동으로 실행하고 관리하는 전문가 자문( EA ) 입니다. 적절히 최적화하면 모든 통화쌍과 시간 프레임 에서 사용할 수 있습니다. 가장 좋은 결과:
EURUSD – H1 하지만 올바른 설정으로 모든 심볼과 시간 프레임 에서 사용 가능합니다. SET 파일 은 댓글 섹션 에 제공됩니다.
중요: 실제 계좌 사용 전에 반드시 백테스트 또는 데모 계좌 에서 먼저 테스트하세요. 권장 조건: 최소 예치금: 1000달러 이상 레버리지: 유동적 (브로커와 위험 허용도에 따라 다름) 전략 논리 빠른 이동평균선 이 느린 이동평균선 을 교차할 때 진입. 거짓 신호를 줄이기 위한 핍 거리 필터 . 교대 로트 마팅게일 을 사

Arbitrage Triad Pro – 외환 시장을 위한 고급 삼각 차익거래 인텔리전스 Arbitrage Triad Pro 는 지능형 삼각 차익거래 시스템 을 활용하여 여러 통화쌍 간의 수익 기회를 신속하게 식별하고 자동으로 활용하는 최첨단 전문가 자문(EA)입니다. 정확성, 일관성, 효율성 을 추구하는 트레이더를 위해 설계되었으며, EA는 고급 통계 분석, 실시간 가격 모니터링 , 그리고 즉시 주문 실행 을 결합하여 수익을 극대화하고 리스크를 최소화합니다. 주요 기능: 삼각 차익거래 전략: 세 개의 상관 통화쌍 간 가격 차이를 활용 초고속 지연 분석: 시장 조정 전에 미세한 가격 변동 포착 자동 주문 실행: 수동 개입 없이 즉시 매수/매도 슬리피지 보호: 지연으로 인한 손실 방지를 위한 스마트 조정 통합 리스크 관리: 설정 가능한 손절매(Stop Loss), 이익실현(Take Profit), 포지션 한도 MetaTrader 4 및 5 호환 모든 브로커 및 계좌 유형에서 사용

Advanced Session Boxes with World Clock This indicator provides a comprehensive solution for visualizing the major forex trading sessions directly on your chart. It is designed to help traders identify the market's most active periods by highlighting the price action during the Sydney, Tokyo, London, and New York sessions. In addition to session boxes, the indicator includes a sleek, on-screen dashboard that acts as a world clock and session status panel, ensuring you're always in sync with glob

Crash300 Centurion Pro — Smart Spike-Zone Engine for MT5 (Crash 300) Crash300 Centurion Pro is a precision spike-zone indicator built for the Crash 300 Index on MT5. It detects the classic 3-bar spike pattern , draws a supply/demand zone for it, projects a precise entry line , and alerts you only when it matters—on the last closed bar and from now on (no historical spam). A slim, transparent panel shows Zones and a live Hit-Rate % from your chosen TP/SL assumptions. Centurion Pro does not trade

**제품 설명: Hunter Trend Mode Grid - 메타트레이더 5 자동매매 EA**
**이동평균 크로스오버 + 헤징 + 그리드 전략으로 트레이딩의 차원을 높이세요!**
Hunter Trend Mode Grid는 지수이동평균(EMA) 크로스오버 신호를 기반으로 헤징과 그리드 전략을 결합한 스마트 외환 트레이딩 EA입니다. 이 EA는 **모든 통화쌍과 시간대**에 적용 가능하며, 특히 **EURUSD 1시간(H1) 차트**에서 최적의 성능을 발휘합니다.
### **주요 기능** **이중 EMA 크로스오버 전략** (기본값 20/50 기간) **지능형 헤징 모드** - 동시 매수/매수 포지션 관리 **선택형 그리드 전략** - 횡보장에서 수익 기회 확대 **완전한 매개변수 조정** - 사용자 정의 TP/SL 및 그리드 간격 지원 **모든 시간대 & 통화쌍 호환**
### **중요 사용 안내** **실거래 전략 테

MP TPO Heatmap — Market Profile (TPO) with VAH/VAL/POC/IB Market Profile is a way to visualize how price accepts or rejects value within a session. Instead of averaging, it counts how often price traded at each level during equal-time “brackets.” The result is a distribution you can read at a glance: thick areas = acceptance; thin edges = rejection. This indicator implements a TPO-based Market Profile with clean session lines (POC, VAH, VAL, IBH, IBL) and a fast, two-tone heatmap cloud that high

PowerGain – O Robô de Day Trade que Une Precisão e Segurança Está operando o seu trade sem lucros constantes? Como seria operar na bolsa Forex com disciplina de um profissional e o foco de um sniper ?
O PowerGain foi criado para trades experientes e profissionais que buscam resultados consistentes , baixo risco e total automação no mercado Forex. Precisando de mais informações falar com o vendedor pelo WhatsApp +55 (85) 99276 - 1423
Por que o PowerGain é diferente? Controle total d

Product Description Silver Trend Signal EA Pro is a repainting-safe Expert Advisor built around the Silver Trend Signal indicator. The EA automatically identifies trade signals and executes orders without manual intervention, saving time and emotion-based trading errors. The EA prioritizes reliability by executing trades only after a confirmed closed bar , minimizing false signals. It includes comprehensive risk management features like stop loss, take profit, trailing stops, and break-

GoldEdge – Turn Gold’s Volatility Into Your Edge GoldEdge is a professional, fully automated Expert Advisor built exclusively for trading XAU/USD (Gold) .
It merges multi-timeframe market structure analysis , precise price action setups , and trend confirmation filters to deliver high-probability trades with built-in risk management . Whether you prefer aggressive scalping or conservative swing trading , GoldEdge adapts to your style while protecting your capital. Key Advantages Engineered

ProTrader Command Professional Trading Analytics & Risk Management System Transform your MetaTrader 5 into a professional trading platform with real-time analytics, automated risk management, and performance tracking. Core Features Real-Time Trading Dashboard Professional MT5 Interface Enhancement Live account metrics displayed directly on your chart Performance indicators with color-coded status alerts Position overview showing all trades at a glance Risk status monitoring with visual war

https://medium.com/@camille.tronel/a-quantum-inspired-model-for-market-levels-in-trading-bdfaaaee6501 " Quantum Mechanics, the cornerstone of modern physics, has proven incredibly effective at modeling uncertainty, probability, and state transitions at microscopic scales. While applying it to financial markets remains controversial, there are striking conceptual parallels — especially around the probabilistic nature of price movement. This article presents a simple yet smart trading model in

MT5 Alert Telegram Notifier PRO VERSION is a specialized toolsdesigned for the MetaTrader 4 (MT4) platform. One of its key features is its ability to operate concurrently with Expert Advisors (EAs) on a single MT4 chart, combining the power of automated analysis with communication convenience. Sending Order Notifications to Telegram Groups or Channels: This indicator has the capability to send real-time order notifications directly to the Telegram group or channel of your choice using the B

Uses support and resistance to open trades and is also able to analysis using news event data the Ea is very good on EURUSD and its configuration include EurUsd be the first and EurGbp being second and GbpUsd being last, using any time frame.
This Ea can be used on any pair where its able to look at the other two pairs movement and find correlation around this pairs and know exactly which one is moving by look at their correlation

XAUUSD Advanced Strike System x100 - Premium MT5 Expert Advisor GOLD Trading Specialist - M15 Timeframe Professionally designed Expert Advisor exclusively optimized for XAUUSD (Gold) trading on M15 timeframe. Laser-focused specialization delivers superior performance through dedicated market analysis. Outstanding Backtesting Performance Total Return : 4,913.38% over 6 years Gross Profit : $10,026,760.49 Profit Factor : 5.82 Sharpe Ratio : 2.02 (Excellent risk-adjusted return

### FTBP 텔레그램 패널 - 차트 위 알림 센터
**FTBP 텔레그램 패널**은 단순한 익스퍼트 어드바이저가 아니라, 텔레그램으로 거래에 대한 즉각적인 알림을 받고 터미널의 시각적 스타일을 관리하고자 하는 트레이더를 위한 모든 기능을 갖춘 도구입니다. 이 제품은 완전히 무료입니다!
### 주요 기능
* **즉각적인 텔레그램 알림:** 티커, 볼륨 및 재정 결과를 포함하여 모든 개설 및 마감 거래에 대한 알림을 받습니다. * **대화형 제어판:** 표준 `F7` 설정 창은 잊어버리십시오. 모든 기능은 차트에서 직접 편리하고 직관적인 패널로 관리됩니다. * **유연한 인터페이스:** 패널을 단일 버튼으로 최소화하고 차트 전체에서 자유롭게 이동할 수 있어 분석에 방해가 되지 않습니다. * **차트 사용자 정의:** "색상" 탭에서 세 가지 전문적인 색 구성표(어둡게, 밝게, 파란색) 사이를 즉시 전환하여 눈의 피로를 줄일 수 있습니다. * **수동 보고서:** 언제든지 지난
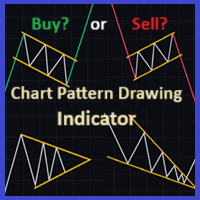
Description of the "GraphicPatternsBuilder" Indicator Principle of Operation and Advantages: The indicator automatically plots support (green) and resistance (red) lines on the chart, identifying key price levels. Works on any asset (cryptocurrency, stocks, Forex) and all timeframes.
Key Advantages: 1. Automation of Routine Work – The indicator independently identifies significant extrema and draws lines. 2. Two Construction Algorithms : - Type 1 : Line is built using two

Mario Order Block Indicator Overview
The Professional Order Block Indicator is an advanced technical analysis tool that automatically identifies and displays institutional order blocks on your chart. Based on smart money concepts, this indicator helps traders identify high-probability support and resistance zones where institutional traders have placed significant orders. Key FeaturesAutomatic Order Block Detection Identifies bullish and bearish order blocks based on pivot point analysis Uses so

Dear trader, I am Aurum AI Quantum Core - the AI expert for gold trading created by the Quantitative Team. Conquer the XAUUSD market with deep neural networks. By integrating the LSTM-Attention model prediction engine with the reinforcement learning execution system, and combining the breakthrough fusion of artificial intelligence and hedge fund strategies through DeepSeek API, a new era of gold trading is initiated. Aurum AI Quantum Core - Quantum-driven gold algorithmic trading system real-t

Overview
Market Session & Bar Counter displays bar numbers on your chart while highlighting major trading sessions with semi-transparent overlays. Perfect for traders who need to track bar progression and monitor session activity simultaneously.
Key Features Bar Counting Numbers each bar from the start of the trading day Customizable display intervals (show every bar or every Nth bar) Milestone highlighting for important bar numbers Real-time countdown timer showing time until next bar Weeken

RwTPro – Transforme sua operação em Day Trade com precisão absoluta Chega de depender do feeling ou do acaso! O RwTPro foi desenvolvido para traders que querem operar com disciplina profissional, confiabilidade e segurança, sem precisar monitorar o mercado o tempo todo. Suporte e dúvidas: WhatsApp +55 (85) 99276-1423 O que torna o RwTPro único Gestão de metas inteligente Defina sua Meta de Lucro e Meta de Perda e o robô se adapta automaticamente. Quer operar sem limites? Basta colocar

JJ Gold · XAUUSD Expert Advisor Clear rules. Consistent execution. Risk-first management. Description JJ Gold is a professional MT5 EA for XAUUSD (Gold) . It focuses on disciplined entries, balance-based position sizing, and hands-off management. The EA runs a predefined trading session aligned with your broker’s server time (no GMT input required) and manages trades with partial profits, trailing protection, and an end-of-week safety close. Key features Consistent execution — rule-based
“세 가지 스크립트, 하나의 목표: 거래를 더 빠르고, 더 안전하고, 더 수익성 있게”
MT5에서 수익을 극대화하고 투자를 한 번에 보호하는 세 가지 도구: 1️⃣ Breakeven Command — 손절가를 즉시 손익분기점으로 이동해 수익 중인 거래를 무위험으로 전환.
2️⃣ MultiTakeProfit — 여러 레벨에서 부분 익절, 트렌드를 살려 더 큰 이익을 노리기.
3️⃣ SetStopLossAllTicket — 모든 오픈 포지션에 수초 만에 손절 지정, 개별 수정 불필요. 주요 장점: 초고속, 간편한 실행 거래 전 과정의 완전한 통제 데이/스윙/스캘핑 트레이더에 적합 MetaTrader 5 100% 호환 시간을 절약하고, 수익을 지키며, 자신 있게 거래하세요. 1. Breakeven Command
원클릭으로 수익 중인 거래를 안전하게. 복잡함 없이 이익을 보호하고 싶은 트레이더에게 최적: 손절가를 즉시 브레이크이븐으로 이동해 리스크를 제거합니다.
즉시
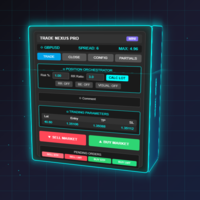
Transform Your Trading with Advanced Automation Management EA TRADE NEXUS PRO is a sophisticated MetaTrader 5 Expert Advisor designed specifically for every trading pair. This EA combines intelligent position management with precise risk control.
Key Features That Set Us Apart Position Orchestrator System
Risk Calculation Based on Stop Loss in Pips/Points. Orders : You can set pending orders such as limit orders, market orders and stop orders Dynamic Risk Control : Customizable risk p

“세 가지 스크립트, 하나의 목표: 거래를 더 빠르고, 더 안전하고, 더 수익성 있게”
MT5에서 수익을 극대화하고 투자를 한 번에 보호하는 세 가지 도구: 1️⃣ Breakeven Command — 손절가를 즉시 손익분기점으로 이동해 수익 중인 거래를 무위험으로 전환.
2️⃣ MultiTakeProfit — 여러 레벨에서 부분 익절, 트렌드를 살려 더 큰 이익을 노리기.
3️⃣ SetStopLossAllTicket — 모든 오픈 포지션에 수초 만에 손절 지정, 개별 수정 불필요. 주요 장점: 초고속, 간편한 실행 거래 전 과정의 완전한 통제 데이/스윙/스캘핑 트레이더에 적합 MetaTrader 5 100% 호환 시간을 절약하고, 수익을 지키며, 자신 있게 거래하세요. 1. Breakeven Command
원클릭으로 수익 중인 거래를 안전하게. 복잡함 없이 이익을 보호하고 싶은 트레이더에게 최적: 손절가를 즉시 브레이크이븐으로 이동해 리스크를 제거합니다.
즉시

This Expert Advisor (EA) generates trading signals by combining popular technical indicators such as Chandelier Exit (CE) , RSI , WaveTrend , and Heikin Ashi . The strategy opens positions based on the confirmation of specific indicator filters and closes an existing position when the color of the Heikin Ashi candlestick changes. This is interpreted as a signal that the trend may be reversing. The main purpose of this EA is to find more reliable entry points by filtering signals from var

A Note to the Trader: This Expert Advisor is a powerful, unoptimized tool. It was created to provide a robust strategic framework, giving you the complete freedom to test, refine, and discover the optimal settings that align with your personal trading style and risk tolerance. Unlock a new level of precision in your trading with the FiboTrend Confluence EA , an advanced automated strategy for MetaTrader 5. This is not just another trading robot; it is a sophisticated tool designed to identify h

트레이딩 로봇 설명: Forex Expert Pro USDJPY Forex Expert Pro USDJPY 는 외환(Forex) 시장을 위한 자동 매매 로봇으로, **하루의 첫 번째 1시간봉(H1)**을 기준으로 형성된 지지 및 저항 레벨 을 기반으로 돌파(breakout) 또는 반등(rebound) 전략을 실행합니다. 로봇은 시장 개장 후 첫 번째 캔들을 분석하고, 해당 캔들의 고가(High) 및 **저가(Low)**를 기준으로 핵심 가격 수준을 설정합니다. USD/JPY에서만 작동합니다. 시작하려면 USD/JPY 차트를 열고 전문가 어드바이저를 설치하세요. 아래 입력 매개변수를 입력하세요. 어드바이저가 작동 준비가 되었습니다.
입력 변수 변수명 값 설명 Chose risk in a trade /1 - 낮음
/2 - 보통
/5 - 높음 거래 위험 수준 선택: 1, 2, 또는 5 MagicNumber 숫자 고유한 로봇 식별 번호를 입력하세요 (Magic Number)

What It Does Scans Multiple Symbols Simultaneously From all pairs for the signal in real time. Detects Overbought/Oversold Conditions C ustomizable inputs and Instant Alerts . Send you Notifications to MT5 in your PHONE Using MetaQuotes ID Pop-up Alerts Telegram Push Messages Whether you're at your desk or on the move, you’ll know the moment a signal hits.

What It Does Scans Multiple Symbols Simultaneously From all pairs for the signal in real time. Detects Overbought/Oversold Conditions Using MACD with customizable inputs and Alerts You Instantly . Send you Notifications to MT5 in your PHONE Using MetaQuotes ID Pop-up Alerts Telegram Push Messages Whether you're at your desk or on the move, you’ll know the moment a signal hits.

What It Does Scans Multiple Symbols Simultaneously From all pairs for the signal in real time. Detects Overbought/Oversold Conditions Using Two MA with customizable inputs and Alerts You Instantly . Send you Notifications to MT5 in your PHONE Using MetaQuotes ID Pop-up Alerts Telegram Push Messages Whether you're at your desk or on the move, you’ll know the moment a signal hits.

XAUUSD Supertrend Orderblock (MT5 EA) Built specifically for Gold (XAUUSD) and the way it moves.
This EA blends a Supertrend-style momentum filter with Order Block + Break of Structure (BOS) logic to catch impulsive continuation and clean mean-reversions on gold’s volatility. KINDLY LEAVE A REVIEW AND GET ONE OF MY PAID EAs for free It doesn’t chase candles. It waits for structure to break, confirms with impulse/ATR , optionally checks for Fair Value Gaps , then places a rules-based entry with S

Screens realtime- https://t.me/ +rEuJQo8zHLllMzgy Signals.Metals.etc
This tool is designed to detect anomalies in market trading activity. It analyzes price movements and volumes to identify moments of unusually strong buying or selling pressure. Such periods are often followed by a cooling phase or consolidation, providing traders with valuable reference points for decision-making.
The indicator requires no complex setup and is suitable for both experienced traders and beginners.
Screensho

LIMITED TIME OFFER: Top 10 downloads FREE. After that, the price increases by 99 f ore v ery 5 a dd i t i o na l d o w n l o a d s . M a x im u m p r i ce : 1999 USD. Gold Trader's Redemption: Capture 90% of opportunities with only 1% risk. To test the demo, use ASK PRICE ONLY mode. In live trading (M5 timeframe), this system also ONLY uses the OPENING price. This ensures your test results perfectly match live trading performance. Five years of sleepless nights, three accounts blown

Fer Scalphunter Bot is an advanced Expert Advisor (EA) designed for MetaTrader 5 that combines a volatility breakout entry strategy with an intelligent recovery system using Grid and Martingale. Its goal is to capture strong market movements and manage adverse trades through controlled averaging. The bot stands out for its robust risk management system, including news filters, daily loss limits, and an exclusive Support and Resistance (S/R) filter to avoid entries in dangerous zones.
SPECIAL O

Phoenix Flip MT5 Discounted Price. Price increases $25 every 10 purchases.
Phoenix Flip Algorithm Experience the power of Phoenix Flip Algorithm - a proprietary grid trading system engineered with sophisticated position management, intelligent session filtering, and four distinct lot progression methodologies. This advanced EA automatically manages alternating grid positions with dual profit targeting systems. The Phoenix Flip system seamlessly handles pending order automation, state trackin

Supertrend Catcher (MT5 Indicator) A clean, visual “smart structure” indicator that helps you spot momentum shifts fast.
It draws recent Order Blocks (OB) with Break of Structure (BOS) , a dynamic baseline (support/resistance), entry/SL/TP suggestions , and a compact info panel . It now includes real-time alerts (terminal/push/sound) when a fresh signal appears. Why traders like it Clear structure at a glance: BOS lines + filled OB zones show where price imbalanced and where it may return. Act
Smart Volume Flow (스마트 볼륨 플로우) Smart Volume Flow 는 주문 흐름의 해석을 한 단계 더 끌어올리는 전문적인 거래량 분석 도구입니다. 단순히 캔들의 수를 세는 것을 넘어, 하이브리드 거래량 , 추세 컨텍스트 , 다중 시간 프레임 필터 , 그리고 방향성 강도(ADX 및 +DI/-DI)를 이용한 검증 을 결합하여 설계되었습니다. 이 도구의 목표는 시장 활동을 분해하고, 가중치를 부여하며, 컨텍스트화 하여 원시 데이터를 보다 정확한 의사결정을 위한 전술적 정보로 변환하는 것입니다. 무엇이 다른가? MetaTrader 5의 기본 거래량 지표는 각 캔들의 총 거래량만을 보여주는 반면, Smart Volume Flow 는 거래량이 어떻게, 그리고 어디서 발생하는지 를 분석합니다. 이를 통해 축적, 분산, 클라이맥스, 흡수와 같은 기관의 패턴을 식별하고, 추세의 방향 및 강도를 통해 이를 확인합니다. 주요 특징 가중 하이브리드 거래량 실제 거래량과 틱 거래량을

Headline: Stop Guessing, Start Winning. Unleash the Power of the Heiken Ashi Supertrend Indicator. Body: Are you tired of market noise, confusing charts, and missed opportunities? The Heiken Ashi Supertrend Indicator is the ultimate tool designed to bring clarity and confidence to your trading, once and for all. We've combined two of the most powerful concepts in technical analysis into one seamless, easy-to-use indicator: Crystal-Clear Trends with Heiken Ashi: Say goodbye to choppy price action
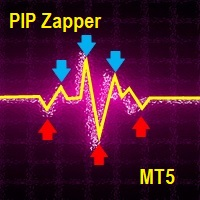
The pip Zapper is a light scalping indicator that generates alternate signals to help you close, gaining or losing trades quickly. This helps you capture trending and ranging scenarios.
When an arrow is generated enter trade after the candle closes. The indicator works with all instruments that are available on mt4 and mt5, including synthetic indices(Volatility, Range Break, Boom, Crash, etc.). Works in both ranging and trending phases. The default settings are already optimized.
MT4 Version

Introduction = 유니버설 트렌드라인 브레이크아웃 MT5 = 이 MT5 인디케이터는 Meta Trader 5용 전문 트렌드라인 돌파 전략 도구입니다. 시장 구조를 분석하여 트렌드라인을 자동으로 감지하고 확인된 돌파에서 BUY SELL 신호를 제공합니다. 주관적인 판단을 줄이고 구조적 분석을 지원합니다.
Why use this Tool - 수동 트렌드라인 오류 제거 - 구조 기반 BUY SELL 신호 제공 - 종가 확인으로 가짜 돌파 필터링 - 시장 흐름 이해 향상 - 규칙 기반 분석 지원
Key Features of this tool + 자동 트렌드라인 감지 + 돌파 시 BUY SELL 신호 + 종가 기준 확인 + 방향 필터 + 리테스트 옵션 + 명확한 차트 표시 + 비리페인트 구조 + 다양한 시장 지원
How use this Tool - Meta Trader 5 차트에 적용 - 자동 감지 활성화 - 확인된 BUY SELL 관찰 - 개인 리스크 관리 적용
Where
MetaTrader 마켓은 MetaTrader 플랫폼용 애플리케이션을 구입할 수 있는 편리하고 안전한 환경을 제공합니다. Strategy Tester의 테스트를 위해 터미널에서 Expert Advisor 및 인디케이터의 무료 데모 버전을 다운로드하십시오.
MQL5.community 결제 시스템을 이용해 성능을 모니터링하고 원하는 제품에 대해 결제할 수 있도록 다양한 모드로 애플리케이션을 테스트할 수 있습니다.
트레이딩 기회를 놓치고 있어요:
- 무료 트레이딩 앱
- 복사용 8,000 이상의 시그널
- 금융 시장 개척을 위한 경제 뉴스
등록
로그인
계정이 없으시면, 가입하십시오
MQL5.com 웹사이트에 로그인을 하기 위해 쿠키를 허용하십시오.
브라우저에서 필요한 설정을 활성화하시지 않으면, 로그인할 수 없습니다.