Volatility Master MT5

Volatility Master for MetaTrader is a real-time dashboard tool that scans up to 56 symbols using up to 2 flexible dashboards on different charts to identify high-volatility, trending markets instantly. With clear bullish/bearish signals, customizable alerts, and a user-friendly interface, it helps you avoid range-bound conditions and focus on high-probability trades. Clarity leads to confidence. Trade confidently and protect your capital effectively with this powerful dashboard.

Setup & Guide: 

Download MT4 Version here.

To learn how to use the Indicator: Indicator Manual & Guide - Read Here

Follow our MQL5 channel for daily market insights, chart, indicator updates and offers! Join here.

Read the product description carefully before purchasing the product.

Disclaimer:

  • Due to regulatory restrictions, our service is unavailable in certain countries such as India, Pakistan, and Bangladesh.
  • Our products are available only on mql5.com.
  • We do not sell any of the Intraquotes products on Telegram or any other platform or website.
  • We never contact anyone or sell our products privately, or provide any personal trading advice.
Main Features
  • Indicator Dashboards – Get live signals of 28 trading assets' volatility for the selected timeframe at a glance.
  • Customizable Symbols – Easily switch between assets in the dashboard by dragging and adjusting symbols in the Market Watch list.
  • Multiple Timeframes – Analyze market trends of M15, H1 (default), H4, and D1 timeframes to suit scalping, intraday, or swing strategies.
  • Enhanced Volatility Calculations – Improved methods provide accurate and reliable volatility readings for more confident trading decisions.
  • Customizable Volatility Highlight – Select a volatility threshold of 20% or 30% (default is 30%) to match your trading style.
  • Dark & Light Theme with Full Color Customization – Switch between dark and light modes and customize signal, volatility, text, and trend colors for a personalized experience.
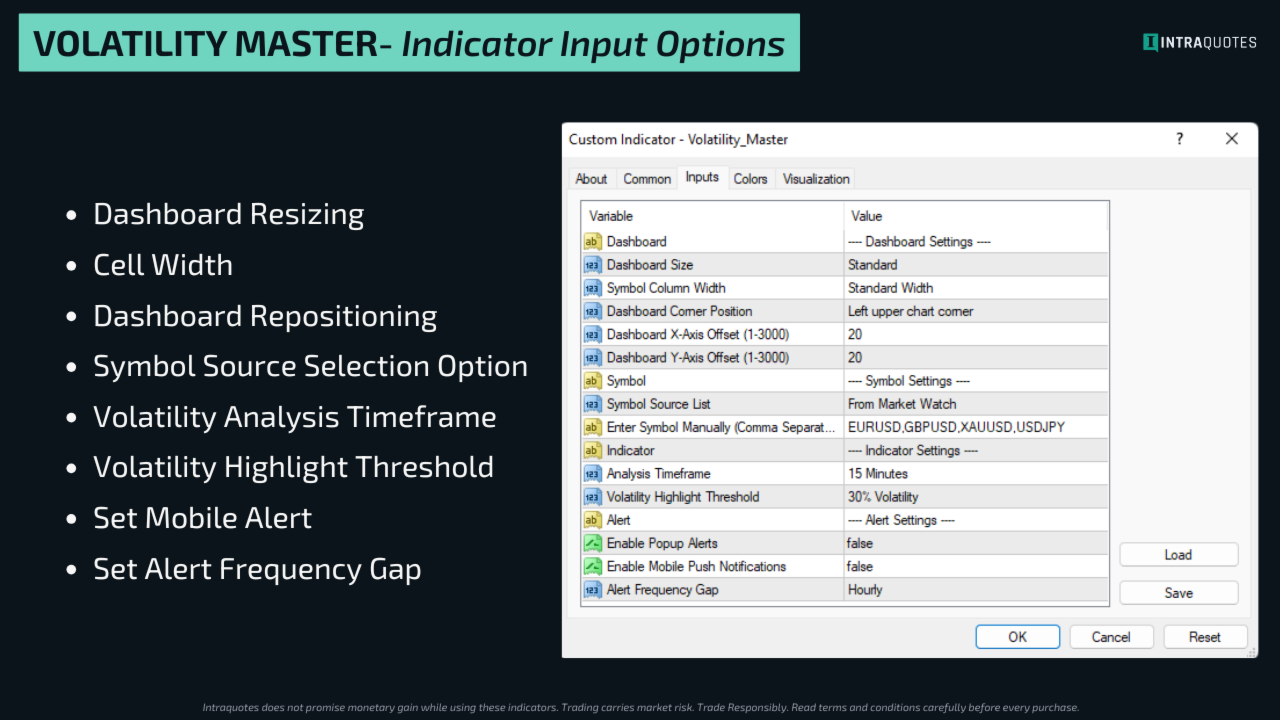
  • Adjustable Cell Width – Increase cell width for better readability, especially for symbols with longer names.
  • Manual Symbol Input – Enter up to 28 preferred symbols manually for display in the dashboard.
  • Dashboard Resizing and Repositioning – Optimized for SD, HD, Full HD, and 4K screens, and can be placed at any of the 4 corners of the chart.
  • User-Friendly Design – Highlighted symbols for quick analysis with a one-click chart open option.
  • Hover-to-Open Chart – Hover over a symbol name and click to instantly open the chart for faster navigation.
  • 5 PC Activation – Use the indicator across 5 PCs with multiple brokers for a seamless trading experience.

Recommendation: Use this indicator on a separate chart (not where you are placing trades) for optimal performance.

1. Why Volatility Master?
  • Identifies High Volatility Markets: Avoid range-bound trading and enter only strong trending markets.
  • Instant Trade Decision Support: Get real-time signals indicating whether the market is bullish, bearish, or ranging—not just whether it is volatile.
  • Saves Time and Effort: The dashboard consolidates crucial volatility data, reducing analysis time.
2. Who is this indicator for?

Volatility Master is ideal for traders who want to avoid low-volatile markets and focus on trending assets. Whether you are a scalper, intraday trader, or swing trader, this tool helps identify high-probability trade opportunities in a single glance.

3. Supported Symbols & Timeframes

The dashboard displays any symbol available in the Market Watch list. It supports all major trading assets including forex (major and minor pairs), metals, indices, cryptocurrencies, and oil. Timeframes include M15, H1, H4, and D1, selectable in the input settings.

4. Secret Dashboard Usage Tips

You can use up to 2 indicator dashboards across 2 separate charts at a time to monitor up to 56 symbols simultaneously.

5. How to Get Started with Volatility Master
  1. After purchasing, open MetaTrader Software, log in to your account, and open Toolbox - Market - Purchased.
  2. Install the indicator.
  3. Open Navigator - Market - Drag and drop the indicator to the chart.
  4. Follow the volatility dashboard for live market signals for confident trading.
6. How It Works

  • Monitors Market Volatility: Analyzes symbols in real time to detect strong trends.
  • Auto-adjustable Dashboard: Switch between assets by dragging and adjusting them in the Market Watch list (top 28 symbols) for instant display.
  • Provides Actionable Signals: Clearly indicates whether a market is trending or ranging.
  • Shows Bullish or Bearish Trends: Helps you enter trades with confidence.
  • One-Click Chart Navigation: Instantly switch to high-volatility assets.
  • Customizable Alerts: Get notified when market conditions meet your strategy.

7. Indicator Settings
  • Manual Symbol Selection – Enter preferred symbols manually to track their volatility quickly.
  • Timeframe Selection – Switch between M15, H1, H4, and D1 based on your trading strategy.
  • Volatility Highlight Level – Choose between 20% or 30% threshold.
  • Theme & Colors – Select Dark or Light theme and customize signal, volatility, text, and trend colors.
  • Dashboard Positioning – Set default X/Y coordinates for a consistent layout.
  • Adjustable Cell Width – Resize cells for better readability on any screen.
  • Resizable Dashboard – Adjust size for any screen resolution (Default and Large options).
  • Mobile Alerts – Enable or disable mobile alerts (True/False) for instant trade notifications.
  • Alert Frequency - Choose how often you want to receive an alert for symbols showing volatility percentage (option from the volatility threshold that you select). Indicator checks volatility of the symbols at this particular time interval.
    For example: If the alert frequency is set to 4 hours, and user select >=30% volatility, then every 4 hours, the indicator will check all the symbols from the dashboard showing volatility above 30% and send alert for the condition satisfying symbols.
  • Move & Minimize Option – Customize display preferences for an optimized chart experience.

Note: Indicator does not have buffer output for EA integration.

8. Mobile Alert Setup

To receive mobile alerts, enable push notifications in MetaTrader 4 by pressing Ctrl + O (or accessing Options) and navigating to the Notifications tab. Enter your MetaQuotes ID from the MetaTrader app on your mobile device to link it with your platform. Once connected, test the setup to ensure alerts are working. If you face any issues, contact our support team through MQL5 inbox.

9. Indicator Troubleshooting

The user guide covers all topics comprehensively. Inbox us on MQL5 after you purchase the indicator for assistance.

10. Learn More at intraquotes MQL5 Channel

Learn how our powerful indicators help you analyze charts, set targets, and take profitable trades with daily market updates and analysis. Build confidence and trade without fear. Join now.

11. Support & Updates
  • For assistance, send us a direct message on MQL5.
  • Follow our new channel for updates and market insights.
  • If you encounter any technical issues with the indicator, contact us directly on MQL5.

Stop wasting time in low-volatile markets and start trading with confidence in trending markets. Volatility Master is the ultimate tool for identifying high-probability opportunities, saving you from frustrating range-bound conditions. With real-time signals, customizable settings, and a user-friendly dashboard, this indicator gives you the edge to trade smarter and more efficiently. Upgrade your trading game today—get Volatility Master now.Risk Disclosure:

Trading financial markets carries inherent risks and may not be suitable for every investor. This indicator is designed as a tool to assist in trading decisions but does not guarantee profits or prevent losses, which could exceed your initial investment. Past performance is not a reliable indicator of future outcomes. Users are encouraged to fully understand the risks and seek independent financial advice if needed. Any trading decisions made using this indicator are at the user's discretion and responsibility.

Related Topics: Trend analysis, Average True Range strategy, volatility trading, trend following, forex, multi-currency analysis, volatility dashboard, volatility scanner, trending symbols, bullish bearish signals, volatility percentage, market volatility tracking.

추천 제품
Maximum Trend Arrows OT MT5
Mulweli Valdaz Makulana
STRICTLY FOR BOOM INDEX ONLY!!!!! Here I bring the Maximum Trend Arrows OT1.0 MT5 indicator. This indicator is made up of a combination of different trend indicators for entries and exits, for entries an orange arrow will paint on the chart below the current market and a red flag for closing of trades and it produces buy arrows only. When the orange arrow appears, it will appear along with it's sound to notify you. The 1H timeframe is recommended, don't use it anywhere else than on the 1H timefr
Owl Smart Levels MT5
Sergey Ermolov
4.03 (32)
MT4 버전  |  FAQ Owl Smart Levels Indicator 는 Bill Williams 의 고급 프랙탈, 시장의 올바른 파동 구조를 구축하는 Valable ZigZag, 정확한 진입 수준을 표시하는 피보나치 수준과 같은 인기 있는 시장 분석 도구를 포함하는 하나의 지표 내에서 완전한 거래 시스템입니다. 시장과 이익을 취하는 장소로. 전략에 대한 자세한 설명 표시기 작업에 대한 지침 고문-거래 올빼미 도우미의 조수 개인 사용자 채팅 ->구입 후 나에게 쓰기,나는 개인 채팅에 당신을 추가하고 거기에 모든 보너스를 다운로드 할 수 있습니다 힘은 단순함에 있습니다! Owl Smart Levels 거래 시스템은 사용하기 매우 쉽기 때문에 전문가와 이제 막 시장을 연구하고 스스로 거래 전략을 선택하기 시작한 사람들 모두에게 적합합니다. 전략 및 지표에는 눈에 보이지 않는 비밀 공식 및 계산 방법이 없으며 모든 전략 지표는 공개되어 있습니다. Owl Smart Levels를 사
PipFinite Trend PRO MT5
Karlo Wilson Vendiola
4.84 (558)
Breakthrough Solution For Trend Trading And Filtering With All Important Features Built Inside One Tool! Trend PRO's smart algorithm detects the trend, filters out market noise and gives entry signals with exit levels. The new features with enhanced rules for statistical calculation improved the overall performance of this indicator. Important Information Revealed Maximize the potential of Trend Pro, please visit www.mql5.com/en/blogs/post/713938 The Powerful Expert Advisor Version Automatin
"Impulses and Corrections 5" is created to help traders navigate the market situation. The indicator shows multi-time frame upward and downward "Impulses" of price movements. These impulses are the basis for determining the "Base" , which is composed of zones of corrections of price movements, as well as "Potential" zones for possible scenarios of price movement. Up and down impulses are determined based on a modified formula of Bill Williams' "Fractals" indicator. The last impulse is always "U
KT Renko Patterns MT5
KEENBASE SOFTWARE SOLUTIONS
KT Renko Patterns는 렌코 차트를 벽돌 하나하나 분석하여, 전 세계 다양한 금융 시장에서 트레이더들이 자주 사용하는 유명한 차트 패턴들을 찾아냅니다. 시간 기반 차트와 비교하면, 렌코 차트는 시각적으로 단순하고 깔끔하여 패턴 중심의 트레이딩이 훨씬 쉽게 가능합니다. KT Renko Patterns에는 다양한 렌코 패턴이 포함되어 있으며, 이 중 상당수는 Prashant Shah의 저서 『Profitable Trading with Renko Charts』에서 자세히 설명되어 있습니다. KT Renko Patterns 인디케이터를 기반으로 한 100% 자동화된 EA는 여기에서 이용할 수 있습니다 - KT Renko Patterns EA . 기능 소개 최대 8개의 명확한 렌코 패턴을 거래할 수 있어, 혼동 없이 신뢰도 높은 트레이딩이 가능합니다. 객관성을 제공하기 위해 각 패턴에는 손절선과 피보나치 목표가 함께 제공됩니다. KT Renko Patterns는 각 패턴의 정
ProEngulfing For MT5
Ashkan Hazegh Nikrou
ProEngulfing 무료 버전은 QualifiedEngulfing으로, 하루에 하나의 신호로 제한되며 기능이 적습니다. 모든 Koala 제품에 대한 최신 정보를 확인하려면 mql5 커뮤니티에서 Koala Trading Solution 채널에 가입하세요. 가입 링크는 아래와 같습니다: https ://www .mql5 .com /en /channels /koalatradingsolution 이 제품의 MT4 버전은 아래 링크에서 다운로드 가능합니다: https ://www .mql5 .com /en /market /product /52023 ProEngulfing 소개 – MT4용 전문가 수준의 Engulf 패턴 지표 정확성을 극대화한 ProEngulfing을 소개합니다. 이 최신 지표는 포렉스 시장에서 신뢰할 수 있는 Engulf 패턴을 식별하고 강조하는 데 중점을 둔 제품입니다. MetaTrader 4에 맞게 개발된 ProEngulfing은 신뢰도 높은 신호를 제공하기 위해
# DRAWDOWN INDICATOR V4.0 - The Essential Tool to Master Your Trading ## Transform Your Trading with a Complete Real-Time Performance Overview In the demanding world of Forex and CFD trading, **knowing your real-time performance** isn't a luxury—it's an **absolute necessity**. The **Drawdown Indicator V4.0** is much more than a simple indicator: it's your **professional dashboard** that gives you a clear, precise, and instant view of your trading account status. --- ## Why This Indicator
PZ Support Resistance MT5
PZ TRADING SLU
3.71 (7)
Unlock key market insights with automated support and resistance lines Tired of plotting support and resistance lines? This is a multi-timeframe indicator that detects and plots supports and resistance lines in the chart with the same precision as a human eye would. As price levels are tested over time and its importance increases, the lines become thicker and darker, making price leves easy to glance and evaluate. [ Installation Guide | Update Guide | Troubleshooting | FAQ | All Products ] Boos
Are you tired of drawing Support & Resistance levels for all charts of the same Symbol while doing Multi-Timeframe analysis? Well, if you are Price Action trader then this indicator will solve your problem.  Draw on 1 Timeframe and it will auto-sync with other charts of the same Symbol. You can draw rectangles, lines, arrows, and eclipse. It will give an alert when touched/break on line and arrow. It work's on all Timeframe. Major Update Added:: 1}Triangle 2}Fibonacci Retracement 3}Text Lab
Your Trend Friend
Luigi Nunes Labigalini
5 (1)
The trend is your friend! Look at the color of the indicator and trade on that direction. It does not  repaint. After each candle is closed, that's the color of the trend. You can focus on shorter faster trends or major trends, just test what's most suitable for the symbol and timeframe you trade. Simply change the "Length" parameter and the indicator will automatically adapt. You can also change the color, thickness and style of the lines. Download and give it a try! There are big movements w
Magic Finger can help you identify trends and trading opportunities clearly. The finger points to the open position signal, and the discoloration line is confirmed by the trend. If you are a day trader, you can choose to trade during a period of active trading, referring to the discoloration line as the basis for the next order, finger signal as a filter. If you are a trend trader, you can choose a period above H1, wait for the appearance of the finger signal in the key price area, and enter th
SUPERTREND;   It is a trend following indicator based on the SuperTrend ATR created by Nav. It can be used to detect changes in trend direction and locate stops. When the price falls below the indicator curve, it turns red and indicates a downtrend. Conversely, when the price moves above the curve, the indicator turns green, indicating an uptrend. BUY/SELL Signals; Method 1; A standard strategy using a single SuperTrend is   While ST Period 1=10, ST Multiplier 1=3, - SELL signal when the bars f
This trading indicator is non-repainting, non-redrawing, and non-lagging, making it an ideal choice for both manual and automated trading. It is a Price Action–based system that leverages price strength and momentum to give traders a real edge in the market. With advanced filtering techniques to eliminate noise and false signals, it enhances trading accuracy and potential. By combining multiple layers of sophisticated algorithms, the indicator scans the chart in real-time and translates comple
Mine Farm
Maryna Kauzova
Mine Farm is one of the most classic and time-tested scalping strategies based on the breakdown of strong price levels. Mine Farm is the author's modification of the system for determining entry and exit points into the market... Mine Farm - is the combination of great potential with reliability and safety. Why Mine Farm?! - each order has a short dynamic Stop Loss - the advisor does not use any risky methods (averaging, martingale, grid, locking, etc.) - the advisor tries to get the most
Integrated Dashboard Scanner
Krzysztof Janusz Stankiewic
5 (1)
Integrated Dashboard Scanner – Version 4.00 The Ultimate Market Command Center just got smarter. Now with Programmable Logic Presets. The Integrated Dashboard Scanner (IDS) monitors multiple symbols and timeframes from a single, DPI-aware panel. Version 4.00 introduces a revolutionary Preset Editor , allowing you to combine signals from different modules into complex, custom strategies without writing a single line of code. NEW IN VERSION 4.00: Filter Presets & Logic Editor Stop scanning for
Trend Master Chart MT5
Frederic Jacques Collomb
Trend Master Chart는 귀하에게 필요한 추세 지표입니다. 차트를 오버레이하고 색상 코딩을 사용하여 다양한 시장 동향/움직임을 정의합니다. 두 개의 이동 평균과 서로 다른 오실레이터를 결합하는 알고리즘을 사용합니다. 이 세 가지 요소의 기간은 수정 가능합니다. 모든 시간대와 모든 쌍에서 작동합니다. 한 눈에 상승 또는 하락 추세와 이 추세의 다양한 진입점을 식별할 수 있습니다. 예를 들어 뚜렷한 상승 추세(밝은 녹색) 동안 이 추세 내의 다양한 시장 충동은 짙은 녹색 양초로 표시됩니다. 구성 가능한 경고를 사용하면 이러한 충동 중 하나를 놓치지 않을 수 있습니다. MT4 버전. 입력 매개변수: Period 1: 빠른 기간 이동 평균. Period 2: 느린 기간 이동 평균. Oscillator period: 오실레이터 기간. Sell/Buy alert: 시장 충동 경고, 추세 진입점. Bullish/Bearish alert: 추세 변화가 있을 경우
MercariaPattern1-2-3 відстежує рух ціни, знаходить трьоххвильові структури 1-2-3 та підсвічує момент, коли сценарій підтверджується пробоєм ключового рівня. MercariaPattern1-2-3 tracks price movement, detects three-leg 1-2-3 structures and highlights the moment when the scenario is confirmed by a key level breakout. Індикатор збирає локальні свінги в компактну фігуру 0–1–2–3 , чекає підтвердженого пробою та будує стрілку входу з готовими рівнями SL/TP. The indicator combines local swings into a
Trend Forecaster
Alexey Minkov
5 (7)
The Trend Forecaster indicator utilizes a unique proprietary algorithm to determine entry points for a breakout trading strategy. The indicator identifies price clusters, analyzes price movement near levels, and provides a signal when the price breaks through a level. The Trend Forecaster indicator is suitable for all financial assets, including currencies (Forex), metals, stocks, indices, and cryptocurrencies. You can also adjust the indicator to work on any time frames, although it is recommen
Key level analysis : The indicator tracks the nearest annual high and low to the current price over a chosen number of years. Proximity alerts : It triggers an alert when the price reaches a specified number of pips from the nearest high or low. Customizable notification intervals : You can set how often alerts repeat, for example, every 30 minutes. Historical perspective : Enables long-term tracking of market levels and effective planning of trading strategies. Multi-currency support : This ind
Noize Absorption Index
Ekaterina Saltykova
Noize Absorption Index - is the manual trading system that measures the difference of pressure between bears forces and bulls forces. Green line - is a noize free index that showing curent situation. Zero value of index shows totally choppy/flat market.Values above zero level shows how powerfull bullish wave is and values below zero measures bearish forces.Up arrow appears on bearish market when it's ready to reverse, dn arrow appears on weak bullish market, as a result of reverse expectation.
Delta Profile Volume
Teresinha Moraes Correia
기술 설명 – MetaTrader 5용 Delta Profile Delta Profile 은 MetaTrader 5에서 정의된 캔들 범위 내의 거래량 흐름을 세부적으로 분석하기 위해 설계된 지표입니다. 이 도구는 각 가격 수준에서 양의 거래량(상승과 관련) 과 음의 거래량(하락과 관련) 간의 불균형을 구조화하고 시각화합니다. 이를 통해 사용자는 실제로 거래가 집중되는 가격 영역과 시장 불균형이 형성되는 구간을 명확하게 파악할 수 있습니다. 핵심 개념 지표는 가격 레벨 을 인식하고 이를 양의 거래량, 음의 거래량 및 순 델타(양-음 차이)로 분류합니다. 각 가격 레벨은 수평 막대 로 차트에 표시되며, 거래가 집중되는 구간을 직관적으로 보여줍니다. 사용자는 분석할 캔들의 개수 , 가격 반올림 정밀도 , 최대 표시 레벨 수 , 표시 옵션 등을 직접 설정할 수 있습니다. 주요 기능 가격 레벨 매핑 : 사용자가 지정한 자릿수에 맞게 가격을 반올림하여 거래량을 집계합니다. 순 델타 계산 : 양
Blahtech Market Profile MT5
Blahtech Limited
5 (10)
Was: $249  Now: $99   Market Profile defines a number of day types that can help the trader to determine market behaviour. A key feature is the Value Area, representing the range of price action where 70% of trading took place. Understanding the Value Area can give traders valuable insight into market direction and establish the higher odds trade. It is an excellent addition to any system you may be using. Inspired by Jim Dalton’s book “Mind Over Markets”, this indicator is designed to suit the
Naturu
Ivan Stefanov
5 (1)
“Naturu”는 자연의 대칭성을 알고리즘으로 활용하는 수동 인디케이터입니다. 간단한 전략과 숨겨진 지혜로 시장을 제패하세요! 인디케이터를 로드하면 위(Top)와 아래(Bottom) 두 개의 라인이 표시됩니다. 라인을 한 번 클릭해 활성화한 후, 이동하고 싶은 캔들 위를 클릭하면 그 위치로 이동합니다. 사용자가 고점과 저점을 지정하면, 인디케이터가 자동으로 계산합니다: 마젠타 색 영역: 상승(불) 세력과 하락(곰) 세력의 관심이 가장 가까워져서 지지/저항이 될 가능성이 큰 구간 회색 영역: 다음 관심 구간 아쿠아 색 실선: 상승 세력의 목표가 골드 색 실선: 하락 세력의 목표가 수동 인디케이터는 실시간 시장 상황과 개인의 직관에 따라 레벨을 자유롭게 조정할 수 있는 완전한 제어력과 유연성을 제공합니다. 직접 가격 움직임을 분석함으로써 지지·저항과 패턴 형성을 본질적으로 이해할 수 있습니다. 인간의 판단을 통해 자동 시스템이 놓치거나 오해하기 쉬운 ‘노이즈’를 걸러내어 잘못된 신호를
Volality Index Scalper
Lesedi Oliver Seilane
5 (1)
Volality Index scalper indicator  Meant for Volality pairs such as Volality 10, 25, 50, 75 and 100 The indicator works on all timeframes from the 1 minute to the monthly timeframe the indicator is non repaint the indicator has 3 entry settings 1 color change on zero cross 2 color change on slope change 3 color change on signal line cross Orange line is your sell signal Blue line is your buy signal.
SMC Venom Model BPR 지표는 Smart Money(SMC) 개념 내에서 일하는 트레이더를 위한 전문 도구입니다. 가격 차트에서 두 가지 주요 패턴을 자동으로 식별합니다. FVG (공정 가치 갭)는 3개의 캔들의 조합으로, 첫 번째와 세 번째 캔들 사이에 갭이 있습니다. 이는 볼륨 지원이 없는 레벨 사이에 구역을 형성하여 종종 가격 수정으로 이어집니다. BPR (균형 가격 범위)은 두 개의 FVG 패턴의 조합으로, "브리지"를 형성합니다. 이는 가격이 낮은 볼륨 활동으로 움직일 때 브레이크아웃과 레벨로의 복귀 구역으로, 캔들 사이에 갭을 생성합니다. 이러한 패턴은 거래자가 차트에서 거래량과 가격 역학을 분석하여 주요 지지/저항 수준, 돌파 구역 및 진입 지점을 식별하는 데 도움이 되며, 여기서 대형 시장 참여자와 일반 참여자 간의 상호 작용이 발생합니다. 이 지표는 사각형과 화살표 형태로 패턴을 시각화하며 유연한 경고 설정도 지원합니다. 주요 특징: 패턴 표시 모드
Volume Profile V6
Andrey Kolesnik
4.67 (3)
시장 매물대 지표(Volume Profile) + 스마트 오실레이터. 통화 쌍, 주식, 선물, 암호화폐 등 거의 모든 종목에서 작동하며, 실제 거래량(Real Volume)과 틱 거래량(Tick Volume)을 모두 지원합니다. 프로파일 생성 범위를 일주일이나 한 달 등으로 자동 설정할 수 있을 뿐만 아니라, 두 개의 수직선(빨간색과 파란색)을 이동하여 수동으로 범위를 설정할 수도 있습니다. 히스트그램 형태로 표시되며, 특정 가격 수준의 히스토그램 너비는 해당 가격대에서 발생한 거래량을 의미합니다. Mode level line color 파라미터를 사용하면 가격이 반등할 가능성이 높은 주요 매물대 수준을 자동으로 표시할 수 있으며, Maximum color 파라미터는 설정된 전체 범위에서 거래가장 많이 발생한 최대 거래량 수준을 별도로 보여줍니다. 스마트 오실레이터는 과매수 및 과매도 구간을 표시합니다. 여러 지표로부터 오는 정보를 분석하고, 처리된 데이터를 바탕으로 과매수 및 과매
Indicator iPump MT5
Sergey Batudayev
iPump 표시기는 세 가지 범주의 표시기의 장점을 결합한 다목적 표시기입니다. 여러 TF에서 동시 추세 감지 저항 및 지원 영역 정의 과매수 및 과매도 구역 결정 표시기 기능: 추세 정의 이 기능은 현재 시장 방향을 객관적으로 평가하고 주관성을 피하려는 모든 거래자에게 필요합니다. 순식간에 가장 중요한 시간대의 추세 방향을 비교할 수 있으며 이는 명확하고 직관적입니다. 지지 및 저항 수준 결정 iPump 표시기를 사용하여 몇 초 이내에 자산에 대한 잠재적인 가격 장벽을 평가할 수 있습니다. 또한 표시기는 앞에 있는 레벨 유형을 알려줍니다. 테스트 레벨(저항/지지) 반전 수준 약한 수준 테스트되지 않은 수준 과매수 및 과매도 구역 결정 이 작업의 경우 표시기에는 자산의 현재 상태를 표시하는 지연되지 않고 다시 그리지 않는 신호 발진기가 있으며 이 데이터를 기반으로 다음을 수행할 수 있습니다. 구매가 흥미로울 때 영역을 정확히 알고 있습니다. 자산을 판매하는 것이 흥미로울
The Super Arrow Indicator provides non-repainting buy and sell signals with exceptional accuracy. Key Features No repainting – confirmed signals remain fixed Clear visual arrows: green for buy, red for sell Real-time alerts via pop-up, sound, and optional email Clean chart view with no unnecessary clutter Works on all markets: Forex, gold, oil, indices, crypto Adjustable Parameters TimeFrame Default:   "current time frame" Function:   Sets the time frame for indicator calculation Options:   Can
Overview The Market Perspective Structure Indicator is a comprehensive MetaTrader indicator designed to provide traders with a detailed analysis of market structure across multiple timeframes. It identifies and visualizes key price action elements, including swing highs and lows, Break of Structure (BOS), Change of Character (CHOCH), internal structures, equal highs/lows, premium/discount levels, previous levels from higher timeframes, and trading session zones. With extensive customization opt
Cumulative Delta NG
Anton Polkovnikov
Cumulative delta indicator As most traders believe, the price moves under the pressure of market buying or selling. When someone redeems an offer standing in the cup, the deal is a "buy". If someone pours into the bid standing in the cup - the deal goes with the direction of "sale". The delta is the difference between purchases and sales. A cumulative delta - the difference between the cumulative sum of purchases and sales for a certain period of time. It allows you to see who is currently contr
이 제품의 구매자들이 또한 구매함
Divergence Bomber
Ihor Otkydach
4.89 (83)
이 지표를 구매하신 분께는 다음과 같은 혜택이 무료로 제공됩니다: 각 거래를 자동으로 관리하고, 손절/익절 수준을 설정하며, 전략 규칙에 따라 거래를 종료하는 전용 도우미 툴 "Bomber Utility" 다양한 자산에 맞게 지표를 설정할 수 있는 셋업 파일(Set Files) "최소 위험", "균형 잡힌 위험", "관망 전략" 모드로 설정 가능한 Bomber Utility의 셋업 파일 이 전략을 빠르게 설치, 설정, 시작할 수 있도록 돕는 단계별 영상 매뉴얼 주의: 위의 모든 보너스를 받기 위해서는 MQL5 개인 메시지 시스템을 통해 판매자에게 연락해 주세요. 독창적인 커스텀 지표인 “Divergence Bomber(다이버전스 봄버)”를 소개합니다. 이 지표는 MACD 다이버전스(괴리) 전략을 기반으로 한 올인원(All-in-One) 거래 시스템입니다. 이 기술 지표의 주요 목적은 가격과 MACD 지표 간의 다이버전스를 감지하고, **향후 가격이 어느 방향으로 움직일지를 알려주는
이 지표를 구매하면 제 프로페셔널 트레이드 매니저를 무료로 드립니다. 우선 이 거래 시스템이 리페인팅, 리드로잉 및 레이그 인디케이터가 아니라는 점을 강조하는 것이 중요합니다. 이는 수동 및 로봇 거래 모두에 이상적인 것으로 만듭니다. 온라인 강좌, 설명서 및 프리셋 다운로드. "스마트 트렌드 트레이딩 시스템 MT5"은 새로운 및 경험이 풍부한 트레이더를 위해 맞춤형으로 제작된 종합적인 거래 솔루션입니다. 10개 이상의 프리미엄 인디케이터를 결합하고 7개 이상의 견고한 거래 전략을 특징으로 하여 다양한 시장 조건에 대한 다목적 선택이 가능합니다. 트렌드 추종 전략: 효과적인 트렌드 추이를 타기 위한 정확한 진입 및 손절 관리를 제공합니다. 반전 전략: 잠재적인 트렌드 반전을 식별하여 트레이더가 범위 시장을 활용할 수 있게 합니다. 스캘핑 전략: 빠르고 정확한 데이 트레이딩 및 단기 거래를 위해 설계되었습니다. 안정성: 모든 인디케이터가 리페인팅, 리드로잉 및 레이그가 아니므로 신뢰
ARICoins
Temirlan Kdyrkhan
ARICoin is a powerful trading companion designed to generate high-probability entry signals with dynamic TP/SL/DP levels based on volatility. Built-in performance tracking shows win/loss stats, PP1/PP2 hits, and success rates all updated live. Key Features: Buy/Sell signals with adaptive volatility bands Real-time TP/SL/DP levels based on ATR Built-in MA Filter with optional ATR/StdDev volatility Performance stats panel (Success, Profit/Loss, PP1/PP2) Alerts via popup, sound, push, or email Cust
Grabber System MT5
Ihor Otkydach
4.82 (22)
탁월한 기술적 지표인 Grabber를 소개합니다. 이 도구는 즉시 사용 가능한 “올인원(All-Inclusive)” 트레이딩 전략으로 작동합니다. 하나의 코드 안에 강력한 시장 기술 분석 도구, 매매 신호(화살표), 알림 기능, 푸시 알림이 통합되어 있습니다. 이 인디케이터를 구매하신 모든 분들께는 다음의 항목이 무료로 제공됩니다: Grabber 유틸리티: 오픈 포지션을 자동으로 관리하는 도구 단계별 영상 매뉴얼: 설치, 설정, 그리고 실제 거래 방법을 안내 맞춤형 세트 파일: 인디케이터를 빠르게 자동 설정하여 최고의 성과를 낼 수 있도록 도와줍니다 다른 전략은 이제 잊어버리세요! Grabber만이 여러분을 새로운 트레이딩의 정점으로 이끌어 줄 수 있습니다. Grabber 전략의 주요 특징: 거래 시간 프레임: M5부터 H4까지 거래 가능한 자산: 어떤 자산이든 사용 가능하지만, 제가 직접 테스트한 종목들을 추천드립니다 (GBPUSD, GBPCAD, GBPCHF, AUDCAD, AU
Trend Screener Pro MT5
STE S.S.COMPANY
4.84 (101)
트렌드 표시기, 트렌드 트레이딩 및 필터링을 위한 획기적인 고유 솔루션, 하나의 도구 안에 내장된 모든 중요한 트렌드 기능! Forex, 상품, 암호 화폐, 지수 및 주식과 같은 모든 기호/도구에 사용할 수 있는 100% 다시 칠하지 않는 다중 시간 프레임 및 다중 통화 표시기입니다. Trend Screener는 차트에 점이 있는 화살표 추세 신호를 제공하는 효율적인 지표 추세 추종 지표입니다. 추세 분석기 표시기에서 사용할 수 있는 기능: 1. 트렌드 스캐너. 2. 최대 이익 분석이 있는 추세선. 3. 추세 통화 강도 측정기. 4. 경고가 있는 추세 반전 점. 5. 경고가 있는 강력한 추세 점. 6. 추세 화살표 Trend Screener Indicator가 있는 일일 분석 예, 일일 신호 성능...등은 여기에서 찾을 수 있습니다. 여기를 클릭하십시오. LIMITED TIME OFFER : Trend Screener Indicator는 50$ 및 평생 동안만 사용할 수 있습니다.
AriX
Temirlan Kdyrkhan
1 (4)
AriX Indicator for MT5 A powerful trend-following and signal-evaluation tool AriX is a custom MT5 indicator that combines Moving Averages and ATR-based risk/reward logic to generate clear buy/sell signals. It visualizes dynamic SL/TP levels, evaluates past trade outcomes, and displays win/loss statistics in a clean on-chart panel. Key features include: Buy/Sell signals based on MA crossovers ATR-based SL/TP1/TP2/TP3 levels with visual lines and labels Signal outcome tracking with real-time stat
Atomic Analyst MT5
Issam Kassas
4.03 (30)
우선적으로 언급할 점은이 거래 지표가 다시 그리지 않고 지연되지 않으며 이를 통해 수동 및 로봇 거래 모두에 이상적이라는 점입니다. 사용자 매뉴얼: 설정, 입력 및 전략. Atomic Analyst는 가격의 강도와 모멘텀을 활용하여 시장에서 더 나은 이점을 찾는 PA Price Action Indicator입니다. 고급 필터를 장착하여 잡음과 거짓 신호를 제거하고 거래 잠재력을 높이는 데 도움이 됩니다. 복잡한 지표의 다중 레이어를 사용하여 Atomic Analyst는 차트를 스캔하고 복잡한 수학적 계산을 간단한 신호와 색상으로 변환하여 초보 트레이더가 이해하고 일관된 거래 결정을 내릴 수 있도록합니다. "Atomic Analyst"는 새로운 및 경험이 풍부한 트레이더를위한 종합적인 거래 솔루션입니다. 프리미엄 지표와 최고 수준의 기능을 하나의 거래 전략에 결합하여 모든 종류의 트레이더에 대한 다재다능한 선택지가되었습니다. 인트라데이 거래 및 스캘핑 전략 : 빠르고 정확한 일일
Quantum TrendPulse
Bogdan Ion Puscasu
5 (22)
SuperTrend   ,   RSI   ,   Stochastic   의 힘을 하나의 포괄적인 지표로 결합하여 트레이딩 잠재력을 극대화하는 궁극의 트레이딩 도구   인 Quantum TrendPulse를   소개합니다. 정밀성과 효율성을 추구하는 트레이더를 위해 설계된 이 지표는 시장 추세, 모멘텀 변화, 최적의 진입 및 종료 지점을 자신 있게 식별하는 데 도움이 됩니다. 주요 특징: SuperTrend 통합:   주요 시장 추세를 쉽게 따라가고 수익성의 물결을 타세요. RSI 정밀도:   매수 과다 및 매도 과다 수준을 감지하여 시장 반전 시점을 파악하는 데 적합하며 SuperTrend 필터로 사용 가능 확률적 정확도:   변동성이 큰 시장에서 숨겨진 기회를 찾기 위해 확률적 진동   을 활용하고 SuperTrend의 필터로 사용 다중 시간대 분석:   M5부터 H1 또는 H4까지 다양한 시간대에 걸쳐 시장을 최신 상태로 유지하세요. 맞춤형 알림:   맞춤형 거래 조건이 충족되면
소개       Quantum Breakout PRO   , 브레이크아웃 존 거래 방식을 변화시키는 획기적인 MQL5 지표! 13년 이상의 거래 경험을 가진 숙련된 트레이더 팀이 개발한       퀀텀 브레이크아웃 PRO       혁신적이고 역동적인 브레이크아웃 존 전략으로 거래 여정을 새로운 차원으로 끌어올리도록 설계되었습니다. Quantum Breakout Indicator는 5개의 이익 목표 영역이 있는 브레이크아웃 영역의 신호 화살표와 브레이크아웃 상자를 기반으로 한 손절 제안을 제공합니다. 초보자 거래자와 전문 거래자 모두에게 적합합니다. Quantum EA 채널:       여기를 클릭하세요 중요한! 구매 후 설치 매뉴얼을 받으려면 개인 메시지를 보내주십시오. 추천: 기간: M15 통화쌍: GBPJPY, EURJPY, USDJPY,NZDUSD, XAUUSD 계정 유형: 스프레드가 매우 낮은 ECN, Raw 또는 Razor 브로커 시간: GMT +3 중개인 :
RFI levels PRO MT5
Roman Podpora
3.67 (3)
이 지표는 추세 반전 지점과 가격 반등 영역을 정확하게 보여줍니다.       주요 투자자들   . 새로운 트렌드가 형성되는 곳을 파악하고 최대한 정확하게 의사결정을 내리며 모든 거래를 완벽하게 통제합니다. TREND LINES PRO   지표와 함께 사용할 때 최대의 잠재력을 발휘합니다.  VERSION MT4 지표가 보여주는 내용: 새로운 추세의 시작 시 활성화되는 반전 구조 및 반전 수준. 최소한의 위험 대비 수익률을 갖는 이익 실현   (TAKE PROFIT)   및   손절매(STOP LOSS)   레벨 표시       RR 1:2   . 지능형 손실 감소 로직이 적용된 손절매 기능. 지정된 지표에서 두 가지 추세 유형에 대한 반전 패턴을 표시합니다. 지표: 트렌드를 따라   트렌드 라인 프로   (글로벌 트렌드 변화) 트렌드 프로   (빠른 트렌드 변화) 간단하고 효과적입니다       스캐너       실시간 추세 (신규). 다중 시간 프레임 도구 필터링. 표시하다  
RelicusRoad Pro MT5
Relicus LLC
5 (24)
RelicusRoad Pro: 퀀트 시장 운영 체제 70% 할인 평생 이용권 (한정 시간) - 2,000명 이상의 트레이더와 함께하세요 왜 대부분의 트레이더는 "완벽한" 지표를 가지고도 실패할까요? 진공 상태에서 단일 개념 만으로 거래하기 때문입니다. 문맥 없는 신호는 도박입니다. 지속적인 승리를 위해서는 컨플루언스(중첩) 가 필요합니다. RelicusRoad Pro는 단순한 화살표 지표가 아닙니다. 완전한 퀀트 시장 생태계 입니다. 독점적인 변동성 모델링을 사용하여 가격이 이동하는 "공정 가치 로드"를 매핑하고, 단순 노이즈와 실제 구조적 돌파를 구분합니다. 추측은 그만두세요. 기관급 로드 로직으로 거래를 시작하세요. 핵심 엔진: "Road" 알고리즘 시스템의 중심에는 시장 상황에 실시간으로 적응하는 동적 변동성 채널인 Road Algo 가 있습니다. 세이프 라인(평형) 과 가격이 수학적으로 반전될 가능성이 높은 확장 레벨 을 투영합니다. Simple Road: 일반적인 시장을 위
Order Block Pro MT5
N'da Lemissa Kouame
Order Block Pro (MQL5) – 버전 1.0 작성자: KOUAME N'DA LEMISSA 플랫폼: MetaTrader 5 설명: Order Block Pro 는 차트에서 **강세 및 약세 오더 블록(Order Blocks)**을 자동으로 감지하는 고급 지표입니다. 횡보 캔들 이후 강한 상승/하락 캔들을 분석하여 가격이 급격히 움직일 가능성이 있는 주요 구간을 표시합니다. 트레이더에게 적합: 정확한 진입 및 청산 지점을 찾고 싶은 경우 동적 지지 및 저항 구간을 파악하고 싶은 경우 리스크 관리 및 거래 전략을 향상시키고 싶은 경우 주요 기능: 강세 OB 감지: 횡보 캔들 후 강한 상승이 발생하면 차트에 녹색 화살표 표시 약세 OB 감지: 횡보 캔들 후 강한 하락이 발생하면 차트에 빨간 화살표 표시 완전한 사용자 정의 가능: 횡보 캔들의 최대 실체 비율 ( BodyMaxRatio ) 다음 캔들의 최소 비율로 움직임 확인 ( NextCandleMinPct ) 차트 화살표
ARIPoint
Temirlan Kdyrkhan
ARIPoint is a powerful trading companion designed to generate high-probability entry signals with dynamic TP/SL/DP levels based on volatility. Built-in performance tracking shows win/loss stats, PP1/PP2 hits, and success rates all updated live. Key Features: Buy/Sell signals with adaptive volatility bands Real-time TP/SL/DP levels based on ATR Built-in MA Filter with optional ATR/StdDev volatility Performance stats panel (Success, Profit/Loss, PP1/PP2) Alerts via popup, sound, push, or email Cu
Entry Points Pro for MT5
Yury Orlov
4.48 (138)
다시 색을 칠하지 않고 거래에 진입할 수 있는 정확한 신호를 제공하는 MT5용 지표입니다. 외환, 암호화폐, 금속, 주식, 지수 등 모든 금융 자산에 적용할 수 있습니다. 매우 정확한 추정값을 제공하고 매수와 매도의 가장 좋은 시점을 알려줍니다. 하나의 시그널로 수익을 내는 지표의 예와 함께 비디오 (6:22)시청하십시오! 대부분의 거래자는 Entry Points Pro 지표의 도움으로 첫 거래 주 동안 트레이딩 결과를 개선합니다. 저희의   Telegram Group 을 구독하세요! Entry Points Pro 지표의 좋은점. 재도색이 없는 진입 신호 신호가 나타나고 확인되면(시그널 캔들이 완성된 경우) 신호는 더 이상 사라지지 않습니다. 여타 보조지표의 경우 신호를 표시한 다음 제거되기 때문에 큰 재정적 손실로 이어집니다. 오류 없는 거래 게시 알고리즘을 통해 트레이드(진입 또는 청산)를 할 이상적인 순간을 찾을 수 있으며, 이를 통해 이를 사용하는 모든 거래자의 성공률이
Gold Sniper Scalper Pro
Ich Khiem Nguyen
3.78 (9)
Gold Sniper Scalper Pro는 XAUUSD에서 허위 돌파 (false breakout) 패턴을 감지하기 위해 특별히 설계된 MetaTrader 5 지표입니다. 가격이 레인지 경계를 돌파하여 돌파 트레이더를 유인한 후 반전하는 4봉 트랩 구조를 식별합니다. 지표는 각 셋업을 17개 품질 요소로 평가하고, 4계층 합류 파이프라인을 통해 처리하며, 7타임프레임 추세 합의 엔진으로 검증하고, 금 변동성 상태 분류기로 필터링합니다. 이 모든 과정이 신호가 차트에 표시되기 전에 완료됩니다. 자세한 사용자 가이드는 작성자의   MQL5 블로그 에서 확인할 수 있습니다. 추가 업데이트는 작성자의   MQL5 채널 을 통해 제공됩니다. 현재 지원 정책에 따라 구매자는 저자가 개발한 선별된 보조 도구에 대한 추가 접근 권한을 받을 수 있습니다. Forex 쌍, 지수 및 암호화폐에서도 작동하지만, 감지 매개변수, 변동성 처리 및 필터 로직은 XAUUSD 특성에 최적화되어 있습니다.
Market Flow Pro
Gabriele Sabatino
Market Flow Pro Market Flow Pro is an intelligent trading advisor for the MetaTrader 5 platform, designed for automatic trading on financial markets using algorithmic analysis and strict risk management. -Key features: - Fully automatic trading 24/5 - Adaptive trend and momentum entry algorithm -  Built-in risk management - Flexible lot settings (fixed/auto-calculation) - Support for major currency pairs and indices - Optimised for operation on various timeframes  How it works Market
Trend Lines PRO MT5
Roman Podpora
5 (1)
트렌드 라인즈 프로       이 지표는 시장이 실제로 어떤 방향으로 전환되는지 파악하는 데 도움이 됩니다. 실제 추세 반전 지점과 주요 시장 참여자들이 다시 진입하는 지점을 보여줍니다. 보시다시피       BOS 라인       복잡한 설정이나 불필요한 노이즈 없이 더 높은 시간대의 추세 변화와 주요 레벨을 확인할 수 있습니다. 신호는 차트에 다시 그려지지 않고 캔들이 마감된 후에도 계속 표시됩니다. MT4 버전   -   RFI LEVELS PRO   표시기   와 결합 시 최대 잠재력을 발휘합니다. 지표가 보여주는 내용: 실제 변화       추세(BOS 라인) 한 번 신호가 나타나면 그 신호는 계속 유효합니다! 이는 신호를 발생시킨 후 변경될 수 있는 리페인팅 방식의 지표와 중요한 차이점입니다. 리페인팅 방식의 지표는 잠재적으로 자금 손실로 이어질 수 있습니다. 이제 더욱 높은 확률과 정확도로 시장에 진입할 수 있습니다. 또한 화살표가 나타난 후 목표가(익절)에 도달하거나
Azimuth Pro
Ottaviano De Cicco
5 (4)
LAUNCH PROMO Azimuth Pro price is initially set at 299$ for the first 100 buyers. Final price will be 499$ . THE DIFFERENCE BETWEEN RETAIL AND INSTITUTIONAL ENTRIES ISN'T THE INDICATOR — IT'S THE LOCATION. Most traders enter at arbitrary price levels, chasing momentum or reacting to lagging signals. Institutions wait for price to reach structured levels where supply and demand actually shift. Azimuth Pro maps these levels automatically: swing-anchored VWAP, multi-timeframe structure lines, an
PZ Swing Trading MT5
PZ TRADING SLU
5 (5)
Protect against whipsaws: revolutionize your swing trading approach Swing Trading is the first indicator designed to detect swings in the direction of the trend and possible reversal swings. It uses the baseline swing trading approach, widely described in trading literature. The indicator studies several price and time vectors to track the aggregate trend direction and detects situations in which the market is oversold or overbought and ready to correct. [ Installation Guide | Update Guide | Tro
Easy SMC Trading
Israr Hussain Shah
4 (1)
자동 위험 관리 및 구조 돌파 스캐너를 포함한 구조 추세 분석 버전: 1.0 개요 자동 위험 관리 기능을 갖춘 구조 추세 분석은 가격 움직임과 시장 구조에 의존하는 트레이더를 위해 설계된 종합적인 트레이딩 시스템입니다. 부드러운 추세 필터와 스윙 포인트 감지, 구조 돌파(BOS) 신호를 결합하여 높은 확률의 거래 설정을 생성합니다. 이 도구의 가장 두드러진 특징은 자동 위험 관리 기능입니다. 유효한 구조 돌파가 감지되면 지표는 즉시 위험/보상 영역(1:1, 1:2, 1:3)을 계산하고 표시하며, 가격이 목표에 도달할 때 거래 시각화를 자동으로 관리합니다. 수동으로 차트를 그릴 필요가 없어 트레이더는 실행에만 집중할 수 있습니다. 주요 기능 동적 구조 돌파(BOS) 감지 스윙 고점(HH/LH)과 스윙 저점(HL/LL)을 자동으로 식별합니다. 가격이 주요 구조적 레벨을 돌파할 때 차트에 BOS 라인을 직접 표시하여 추세 방향을 확인합니다. 구조적 핵심 지점을 명확한 텍스트
Algo Pumping
Ihor Otkydach
4.76 (21)
PUMPING STATION – 당신만을 위한 올인원(All-in-One) 전략 PUMPING STATION은 당신의 외환 거래를 더욱 흥미롭고 효과적으로 바꿔줄 혁신적인 인디케이터입니다. 단순한 보조 도구가 아니라, 강력한 알고리즘을 갖춘 완전한 거래 시스템으로서 보다 안정적인 트레이딩을 시작할 수 있도록 도와줍니다. 이 제품을 구매하시면 다음의 혜택을 무료로 받으실 수 있습니다: 전용 설정 파일: 자동 설정으로 최대의 퍼포먼스를 제공합니다. 단계별 동영상 가이드: PUMPING STATION 전략으로 거래하는 법을 배워보세요. Pumping Utility: PUMPING STATION과 함께 사용하도록 설계된 반자동 거래 봇으로, 거래를 더욱 쉽고 편리하게 만들어줍니다. ※ 구매 후 바로 저에게 메시지를 보내주세요. 추가 자료에 대한 접근 권한을 제공해드립니다. PUMPING STATION은 어떻게 작동하나요? 트렌드 컨트롤: 시장의 추세 방향을 즉시 파악합니다. 추세는 최고의
Trend Hunter MT5
Andrey Tatarinov
5 (3)
Trend Hunter 는 Forex, 암호화폐 및 CFD 시장에서 작업하기 위한 추세 지표입니다. 이 지표의 특별한 특징은 가격이 추세선을 약간 돌파할 때 신호를 변경하지 않고 자신있게 추세를 따른다는 것입니다. 표시기는 다시 그려지지 않으며 막대가 닫힌 후에 시장 진입 신호가 나타납니다. 추세를 따라 이동할 때 표시기는 추세 방향에 대한 추가 진입점을 표시합니다. 이러한 신호를 바탕으로 작은 StopLoss로 거래할 수 있습니다. Trend Hunter 는 정직한 지표입니다. 표시 신호 위로 마우스를 가져가면 신호의 잠재적 이익과 가능한 중지가 표시됩니다. 새로운 신호가 나타나면 다음 알림을 받을 수 있습니다. 알리다 푸시 알림 이메일로 알림 텔레그램 알림 차트 스크린샷도 텔레그램으로 전송되므로 거래 결정을 내리기 위해 단말기를 열 필요가 없습니다. 표시 신호는 텔레그램 채널 https://www.mql5.com/ko/market/product/11085#!tab=com
Trade smarter, not harder: Empower your trading with Harmonacci Patterns This is arguably the most complete harmonic price formation auto-recognition indicator you can find for the MetaTrader Platform. It detects 19 different patterns, takes fibonacci projections as seriously as you do, displays the Potential Reversal Zone (PRZ) and finds suitable stop-loss and take-profit levels. [ Installation Guide | Update Guide | Troubleshooting | FAQ | All Products ] It detects 19 different harmonic pri
Ace Trend
Mikhail Sergeev
5 (3)
우리는 당신에게 트렌드 거래의 세계에서 게임의 규칙을 변경하는 혁신적인 지표를 제시한다. 이 표시기는 성능을 재고하고 거래 경험을 전례없는 높이로 높이도록 설계되었습니다. 우리의 표시기는 경쟁 업체와 차별화 된 고급 기능의 고유 한 조합을 자랑합니다. "실제 가격 요인"의 첨단 기술은 가장 어렵고 휘발성 시장 상황에서도 탁월한 안정성을 보장합니다. 불안정한 패턴,깨진 지표 및 의식적이고 통제 된 거래에 작별 인사를하십시오. 표시기는 단지 아름다운 그림이 아닙니다! 지표는 거래자의 편으로 확률을 이동시켜 이익을 얻어야 합니다. 표시 신호(완전 자동 모드)에 따라 거래 결과에 익숙해: https://www.mql5.com/ko/signals/2339244 표시기는 형성된 막대에 다시 그리지 않습니다. 막대가 형성된 경우 표시기 판독 값은 변경되지 않습니다. 이 표시기는 모든 시간대에 작동합니다. 표준은 시간대입니다. 귀하의 의견은 매우 중요합니다! 당신은 어떤 질문,제안이,또는 당신의
Mirage Trading System
Ich Khiem Nguyen
5 (1)
Mirage Trading System은 바 마감 확인 후 허위 돌파 반전 패턴(Fakey)을 감지하는 MetaTrader 5 지표입니다. 가격이 핵심 레벨을 돌파하여 트레이더를 잘못된 방향으로 유인한 후 반전하는 순간을 식별합니다. 이는 프라이스 액션 분석과 스마트 머니 컨셉(SMC)에서 널리 사용되는 셋업입니다. 이 지표는 패턴 감지, 진입/청산 레벨 계산, 리스크 관리, 다중 타임프레임 스캔 및 성과 추적을 단일 도구에서 처리합니다. MetaTrader 5가 지원하는 모든 심볼과 타임프레임에서 작동합니다. 작동 방식 자세한 사용자 가이드는 작성자의   MQL5 블로그 에서 확인할 수 있습니다. 추가 업데이트는 작성자의   MQL5 채널 을 통해 제공됩니다. 현재 지원 정책에 따라 구매자는 저자가 개발한 선별된 보조 도구에 대한 추가 접근 권한을 받을 수 있습니다. 캔들이 마감되어 허위 돌파 패턴을 확인하면, 지표는 차트에 시그널 화살표를 표시합니다. 각 시그널에는 진
Basic Supply Demand Dashboard MT5
Mehran Sepah Mansoor
5 (1)
이 대시보드는 선택한 기호에 대한 거래 전략에 따라 스캘핑 모드와 장기 모드 모두에서 차트의 공급 및 수요 영역을 검색하고 표시합니다. 또한 대시보드의 스캐너 모드를 통해 원하는 모든 기호를 한눈에 확인하고 적합한 위치를 놓치지 않도록 도와줍니다 / MT4 버전 . 무료 보조지표:   Basic Supply Demand 특징 여러 통화쌍에 대한 거래 기회를 볼 수 있으며, 공급 및 수요 영역에 대한 근접성에 따라 순위가 매겨진 모든 쌍을 명확하고 간결하게 볼 수 있습니다. 색상부터 감지 매개변수까지 특정 요구에 맞게 사용자 지정 설정 가능 주요 입력 Indicator mode :   표시기 모드 또는 새로운 기능이 포함된 패널 모드 중에서 선택 가능 Symbols :   "28개 주요 통화쌍" 또는 "선택한 심볼" 중에서 선택 Selected Symbols :   쉼표로 구분하여 모니터링하려는 원하는 심볼("EURUSD, GBPUSD, XAUUSD")을 선택합니다. 브로
우선적으로, 이 거래 도구는 전문적인 거래에 이상적인 비-다시 그리기 및 지연되지 않는 지표입니다.  온라인 강좌, 사용자 매뉴얼 및 데모. 스마트 가격 액션 컨셉트 인디케이터는 신규 및 경험 많은 트레이더 모두에게 매우 강력한 도구입니다. Inner Circle Trader Analysis 및 Smart Money Concepts Trading Strategies와 같은 고급 거래 아이디어를 결합하여 20가지 이상의 유용한 지표를 하나로 결합합니다. 이 인디케이터는 스마트 머니 컨셉트에 중점을 두어 대형 기관의 거래 방식을 제공하고 이동을 예측하는 데 도움을 줍니다.  특히 유동성 분석에 뛰어나 기관이 어떻게 거래하는지 이해하는 데 도움을 줍니다. 시장 트렌드를 예측하고 가격 변동을 신중하게 분석하는 데 탁월합니다. 귀하의 거래를 기관 전략에 맞추어 시장의 동향에 대해 더 정확한 예측을 할 수 있습니다. 이 인디케이터는 시장 구조를 분석하고 중요한 주문 블록을 식별하고 다양
Candle Smart Range
Gianny Alexander Lugo Sanchez
MetaTrader 5용 Candle Smart Range (CSR) Candle Smart Range는 여러 타임프레임에서 가격 범위를 자동으로 식별하도록 설계된 기술 지표입니다. 이 도구는 캔들 형성 및 이전 고점/저점과의 상호작용을 바탕으로 시장 구조를 분석합니다. 주요 기능: 범위 감지: 급격한 변동 전의 횡보 구간을 자동으로 식별합니다. 거짓 돌파 식별: 가격이 이전 수준을 넘어섰으나 캔들 종가 기준으로 범위 내에서 마감된 경우를 표시합니다. 멀티 타임프레임 분석: 사용자 정의 주기를 포함하여 최대 19개의 타임프레임 데이터를 한 차트에 표시합니다. 내부 시각화 (줌): 차트 변경 없이 상위 타임프레임 캔들 내부의 가격 움직임을 확인할 수 있습니다. 시간 필터: 주요 시장 세션 등 특정 시간대에만 작동하도록 설정 가능합니다. 과거 데이터 복기 모드: 과거 데이터를 단계별로 탐색하며 지표의 작동을 분석할 수 있습니다. 알림 시스템: 캔들 마감 및 새로운 범위 감지에 대한 사용
MSG Method Indicator
Stephanus Potgieter
Discover the MSG Method: Master the Major Session Gap for Consistent Forex Profits Unlock the power of the MSG Method – our proprietary Major Session Gap strategy designed to capture high-probability trades during key market session transitions. Developed by the T1 FX Team, this innovative approach leverages algorithmic precision to identify and exploit price gaps between major trading sessions (London, New York, and Tokyo). Why Choose the MSG Method? High-Probability Setups : Focuses on session
Btmm state engine pro
Garry James Goodchild
5 (2)
Get the user guide here  https://g-labs.software/guides/BTMM_State_Engine_Welcome_Pack.html BTMM State Engine Pro — the   all-in-one Banks   & Institutions Market Maker indicator for Meta Trader 5. Built for   BTMM traders who follow the Asian   session breakout methodology with Kill Zone timing , level stacking, peak formation detection , and multi-pair scanning — all   from a single chart. Combines   a full BTMM State Engine   with a built-in multi-pair Scanner dashboard, eliminating the need
제작자의 제품 더 보기
Hydra Trend Rider
INTRAQUOTES
5 (4)
Hydra Trend Rider is a non-repainting, multi-timeframe trend indicator that delivers precise buy/sell signals and real-time alerts for high-probability trade setups. With its color-coded trend line, customizable dashboard, and mobile notifications, it's perfect for traders seeking clarity, confidence, and consistency in trend trading. Setup & Guide:  Download  MT5 Version here. To learn how to use the Indicator: Indicator Manual & Guide -   Read Here Exclusively for you: It's your chance to st
IQ Gold Gann Levels
INTRAQUOTES
5 (4)
Presenting one-of-a-kind Gann Indicator for XAUUSD IQ Gold Gann Levels is a non-repainting, precision tool designed exclusively for XAUUSD/Gold intraday trading. It uses W.D. Gann’s square root method to plot real-time support and resistance levels, helping traders spot high-probability entries with confidence and clarity. William Delbert Gann (W.D. Gann) was an exceptional market analyst whose trading technique was based on a complex blend of mathematics, geometry, astrology, and ancient calcul
IQ FX Gann Levels
INTRAQUOTES
5 (2)
IQ FX Gann Levels a precision trading indicator based on W.D. Gann’s square root methods . It plots real-time, non-repainting support and resistance levels to help traders confidently spot intraday and scalping opportunities with high accuracy. William Delbert Gann (W.D. Gann) was an exceptional market analyst, whose trading technique was based on a complex blend of mathematics, geometry, astrology, and ancient mathematics which proved to be extremely accurate. Setup & Guide:  Download  MT5 Ver
Volatility Master
INTRAQUOTES
5 (5)
Volatility Master for MetaTrader is a real-time dashboard tool that scans up to 56 symbols using up to 2 flexible dashboards on different charts to identify high-volatility, trending markets instantly. With clear bullish/bearish signals, customizable alerts, and a user-friendly interface, it helps you avoid range-bound conditions and focus on high-probability trades. Clarity leads to confidence. Trade confidently and protect your capital effectively with this powerful dashboard. Setup & Guide: 
IQ FX Strength  answers the single most important question in trading: "Who is truly driving the market right now?" Designed with a stunning Hybrid UI, this tool separates true trend moves from market noise, allowing you to catch "Explosive" moves before the crowd sees them. System Requirement: For higher accurate signal and optimal, smoother performance of this indicator without any lag, a good CPU (with   RAM of  atleast 8GB or above) and fast internet connection is highly recommended. IQ FX
Hydra Trend Rider is a non-repainting, multi-timeframe trend indicator that delivers precise buy/sell signals and real-time alerts for high-probability trade setups. With its color-coded trend line, customizable dashboard, and mobile notifications, it's perfect for traders seeking clarity, confidence, and consistency in trend trading. Setup & Guide:  Download  MT4 Version here. To learn how to use the Indicator: Indicator Manual & Guide -   Read Here Follow our MQL5 channel for daily market ins
IQ FX Gann Levels a precision trading indicator based on W.D. Gann’s square root methods . It plots real-time, non-repainting support and resistance levels to help traders confidently spot intraday and scalping opportunities with high accuracy. William Delbert Gann (W.D. Gann) was an exceptional market analyst, whose trading technique was based on a complex blend of mathematics, geometry, astrology, and ancient mathematics which proved to be extremely accurate. Setup & Guide:  Download  MT4 Ver
Presenting one-of-a-kind Gann Indicator for XAUUSD IQ Gold Gann Levels is a non-repainting, precision tool designed exclusively for XAUUSD/Gold intraday trading. It uses W.D. Gann’s square root method to plot real-time support and resistance levels, helping traders spot high-probability entries with confidence and clarity. William Delbert Gann (W.D. Gann) was an exceptional market analyst whose trading technique was based on a complex blend of mathematics, geometry, astrology, and ancient calcul
First time on MetaTrader, introducing IQ Star Lines - an original Vedic Astrology based indicator. "Millionaires don't use astrology, billionaires do" . - J.P. Morgan, Legendary American financier and banker. IQ Star Lines, an unique astrological indicator purely based on   Vedic astrology   calculations, published for the   first time on Metatrader.  This unique tool plots dynamic planetary grid lines based on real-time stars, constellations, and celestial movements, which allows you to plot t
FX Correlation Matrix is a powerful multi-timeframe dashboard that helps traders analyze real-time currency correlations of up to 28 symbols at a glance. With customizable settings, sleek design, and manual symbol selection option, it enhances trade accuracy, reduces risk, and identifies profitable correlation-based opportunities. Setup & Guide:  Download   MT5 Version here. Follow our MQL5 channel for daily market insights, chart, indicator updates and offers!  Join here. Read the product des
FX Correlation Matrix is a powerful multi-timeframe dashboard that helps traders analyze real-time currency correlations of up to 28 symbols at a glance. With customizable settings, sleek design, and manual symbol selection option, it enhances trade accuracy, reduces risk, and identifies profitable correlation-based opportunities. Setup & Guide:  Download   MT4 Version here. Follow our MQL5 channel for daily market insights, chart, indicator updates and offers!  Join here. Read the product des
First time on MetaTrader, introducing IQ Star Lines - an original Vedic Astrology based indicator. "Millionaires don't use astrology, billionaires do" . - J.P. Morgan, Legendary American financier and banker. IQ Star Lines, an unique astrological indicator purely based on   Vedic astrology   calculations, published for the   first time on Metatrader.  This unique tool plots dynamic planetary grid lines based on real-time stars, constellations, and celestial movements, which allows you to plot t
The Hydra Multi Trend Dashboard is a powerful market scanning tool designed for MetaTrader 4 and MetaTrader 5. It monitors up to 25 currency pairs or assets simultaneously across all 9 standard timeframes (M1 to Monthly). Using a proprietary Special Trend Formula , the dashboard filters out market noise and provides clear, visual Bullish or Bearish signals, allowing traders to identify trend alignments at a glance without switching charts. Setup & Guide:  Download  MT4 Version here. Follow our
The Hydra Multi Trend Dashboard is a powerful market scanning tool designed for MetaTrader 4 and MetaTrader 5. It monitors up to 25 currency pairs or assets simultaneously across all 9 standard timeframes (M1 to Monthly). Using a proprietary Special Trend Formula , the dashboard filters out market noise and provides clear, visual Bullish or Bearish signals, allowing traders to identify trend alignments at a glance without switching charts. Setup & Guide:  Download  MT5 Version here. Stay ahead
IQ Trade Status – A Professional Trade Panel to track all your LIVE TRADES in a single dashboard. IQ Trade Status is not just a trade panel; it is a professional dashboard designed for MetaTrader. It replaces the default Terminal window with a clean, structured, and actionable overview of your account and open trades. The dashboard is designed to help you instantly answer three critical questions: How much have I made today? How much will I lose if all my trades go wrong? Is my account over-lev
IQ Chart Cleaner – Get a Fresh Chart in Seconds. A cluttered chart can make trading stressful and confusing. Between dozens of old indicators, leftover lines, arrows, shapes, and notes, it’s easy to lose focus on what really matters—your trades. That’s where IQ Chart Cleaner comes in. With a single click, IQ Chart Cleaner gives you a fresh, distraction-free chart so you can analyze the markets with clarity and confidence. Get the MT5 Version here . Key Benefits Total Cleaning Power – Instantly
IQ Trade Status – A Professional Trade Panel to track all your LIVE TRADES in a single dashboard. IQ Trade Status is not just a trade panel; it is a professional dashboard designed for MetaTrader. It replaces the default Terminal window with a clean, structured, and actionable overview of your account and open trades. The dashboard is designed to help you instantly answer three critical questions: How much have I made today? How much will I lose if all my trades go wrong? Is my account over-lev
Get a clean chart in an instant.  This script is extremely helpful in removing not only all the graphical objects from the chart but also all the  indicators from the chart.  Get the MT4 Version here . Features: Confirmation Dialog : Asks for confirmation before cleaning the chart. Complete Cleaning: Removes all graphical objects (lines, arrows, shapes, etc.) Removes all indicators from all chart windows (main and subwindows) Logging: Prints information about the cleaning process in the Expert
IQ FX Strength  answers the single most important question in trading: "Who is truly driving the market right now?" Designed with a stunning Hybrid UI, this tool separates true trend moves from market noise, allowing you to catch "Explosive" moves before the crowd sees them. System Requirement: For higher accurate signal and optimal, smoother performance of this indicator without any lag, a good CPU (with   RAM of  atleast 8GB or above) and fast internet connection is highly recommended. IQ FX
필터:
리뷰 없음
리뷰 답변