White Weis Volume Ticks
- 지표
-
Ricardo Almeida Branco
 I started following the Brazilian stock exchange in 2018, in a demo account, and I found the amount of setups used interesting. Taking learning and even the demo seriously, I understood that I should start programming to validate / discard setups.
 - 버전: 1.0
- 활성화: 5
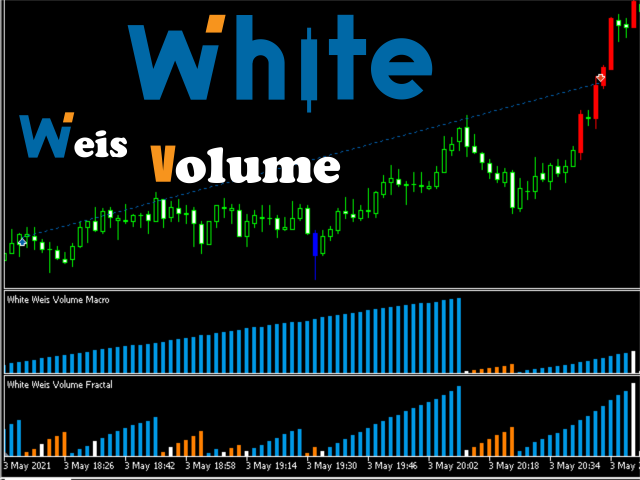
White Weis Volume
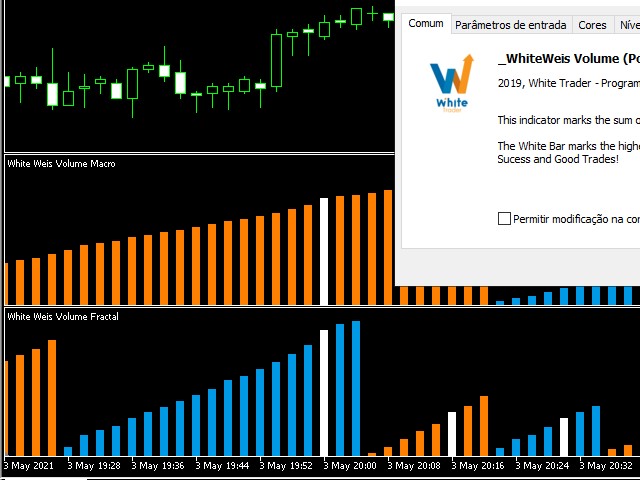
This indicator shows the sum of the volume in each wave, bulish or bearish, as idealized by David Weis, but it brings an important addition, which is the marking of the bar with the highest volume of the wave (White Bar)!
In coding the indicator, it was sought to optimize the code to require minimal processing during use and not to overload mt5.
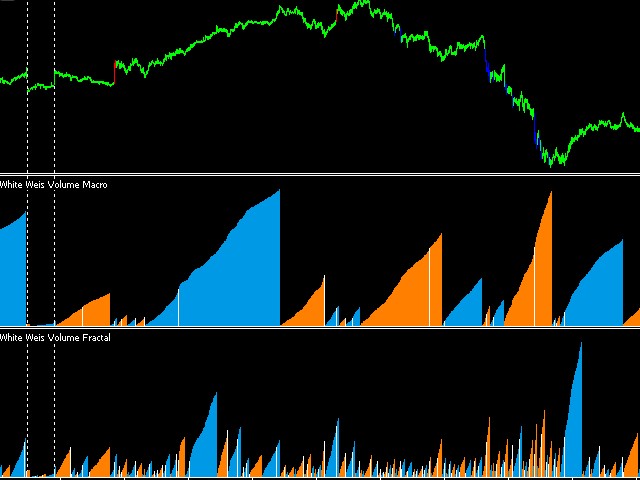
The indicator can be used for pre-trading analysis and study, where the trader analyzes possible points of support and resistance based on the waves of greater volume.
The indicator can be used in real time, analyzing two plots, one macro and the other micro (or fractal) and understanding price movements and observing the volume.
The White Weis Volume indicator is a powerful indicator that combines price and volume in one.
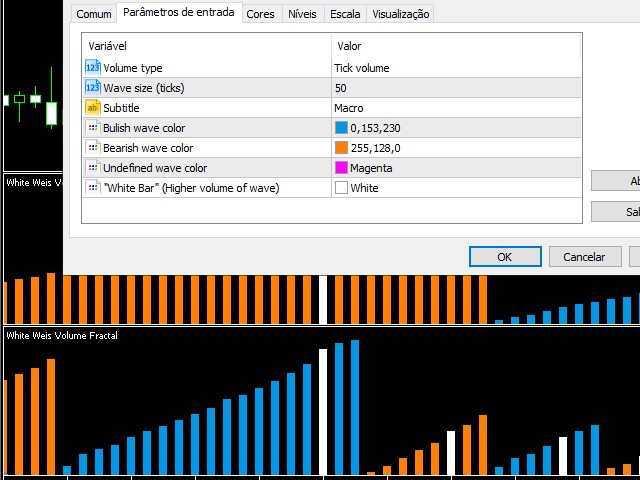
The indicator inputs are:
- Volume Type: Tick Volume or Real Volume Wave size (ticks): Minimum size for the wave to be defined as a high or low wave. (If the price is going in the opposite direction but without reaching this size, the histogram will be painted painted the color magenta (default) or the color definity by the user).
- Bulish wave color: Color to color the high wave histogram.
- Bearsish wave color: Color to color the high wave histogram.
- Undefined wave color: Color to color the histogram in undefined wave.
- "White Bar" (Higher volume of wave): Color to color the histogram that contains the highest volume of the wave.
For use in EA's we have the possibility of reading the buffers through the iCustom function.
Buffer0 = Volume Histogram
Buffer1 = Histogram colors (0 -> buy, 1-> sale, 2-> undefined).
Buffer3 = White Bar (Max volume).
That's it.
Success and good trades!

MELHOR WEIS WAVES PARA METATRADER 5 SÓ AGRADEÇO PELO INDICADOR!!