Market Structure Analysis Indicator MT4
- 지표
- 버전: 2.0
- 활성화: 10

🎯 Overview 📊 Market Structure Analysis Indicator MT4
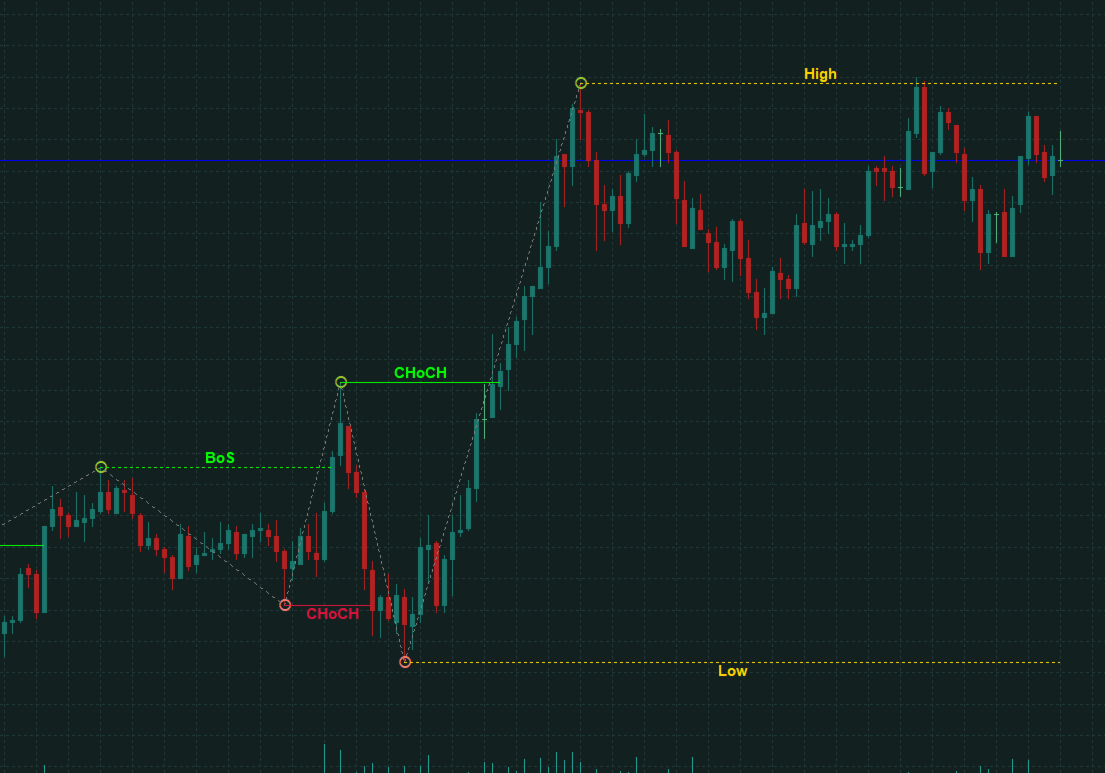
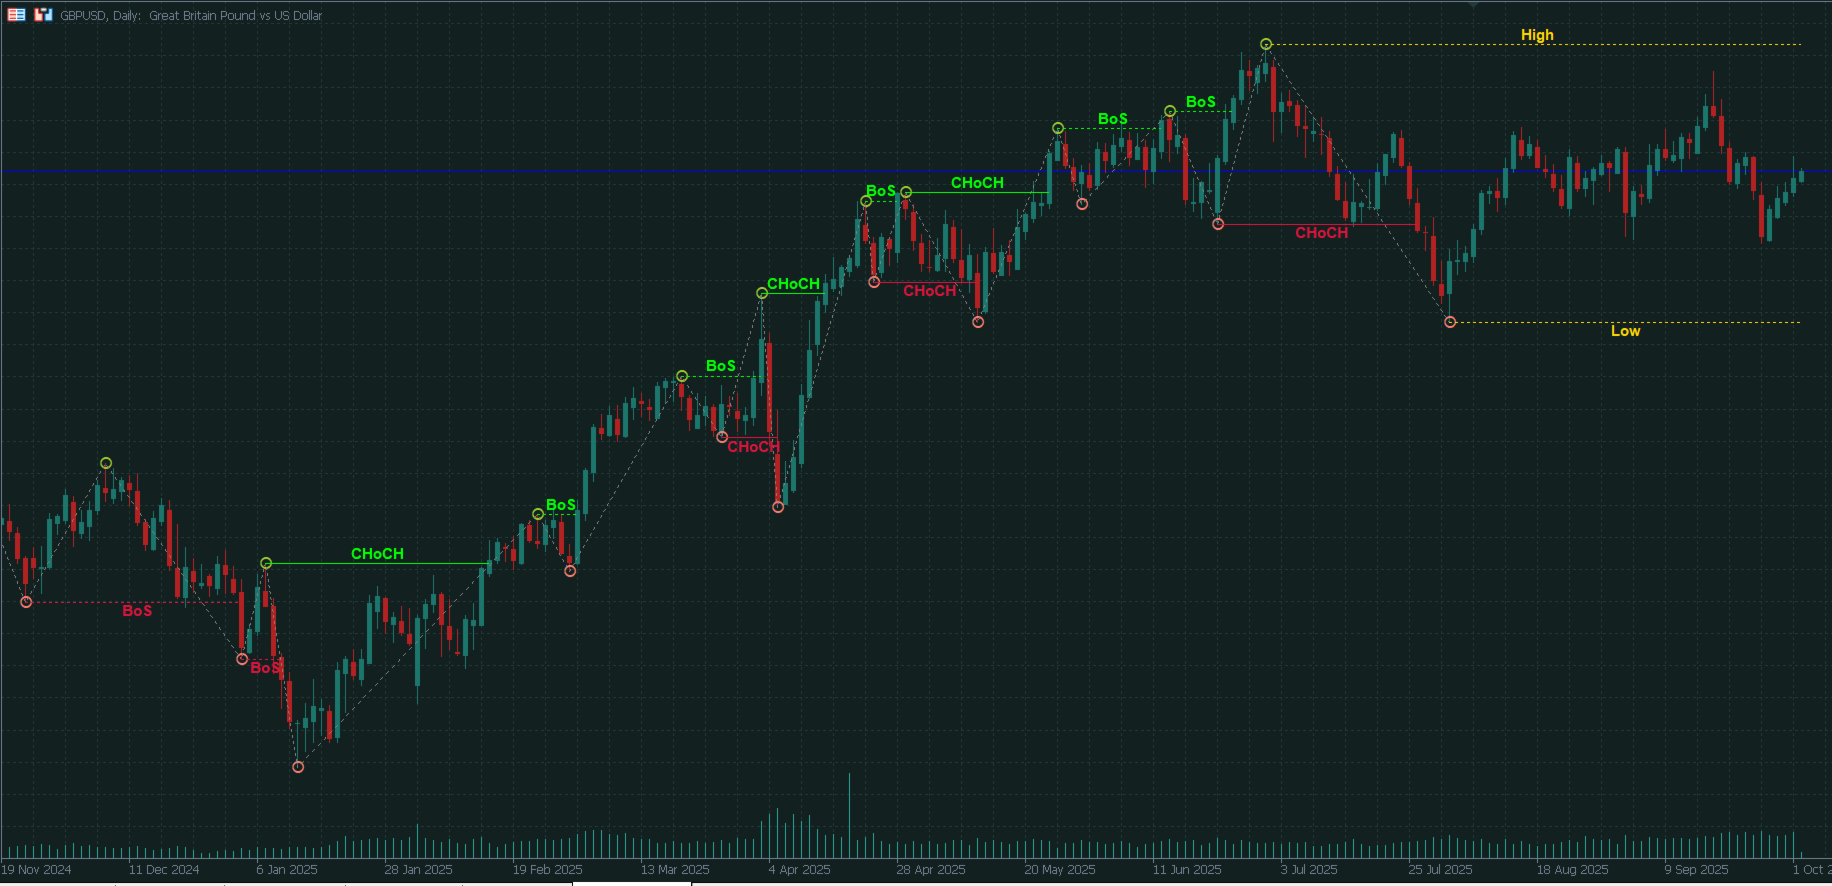
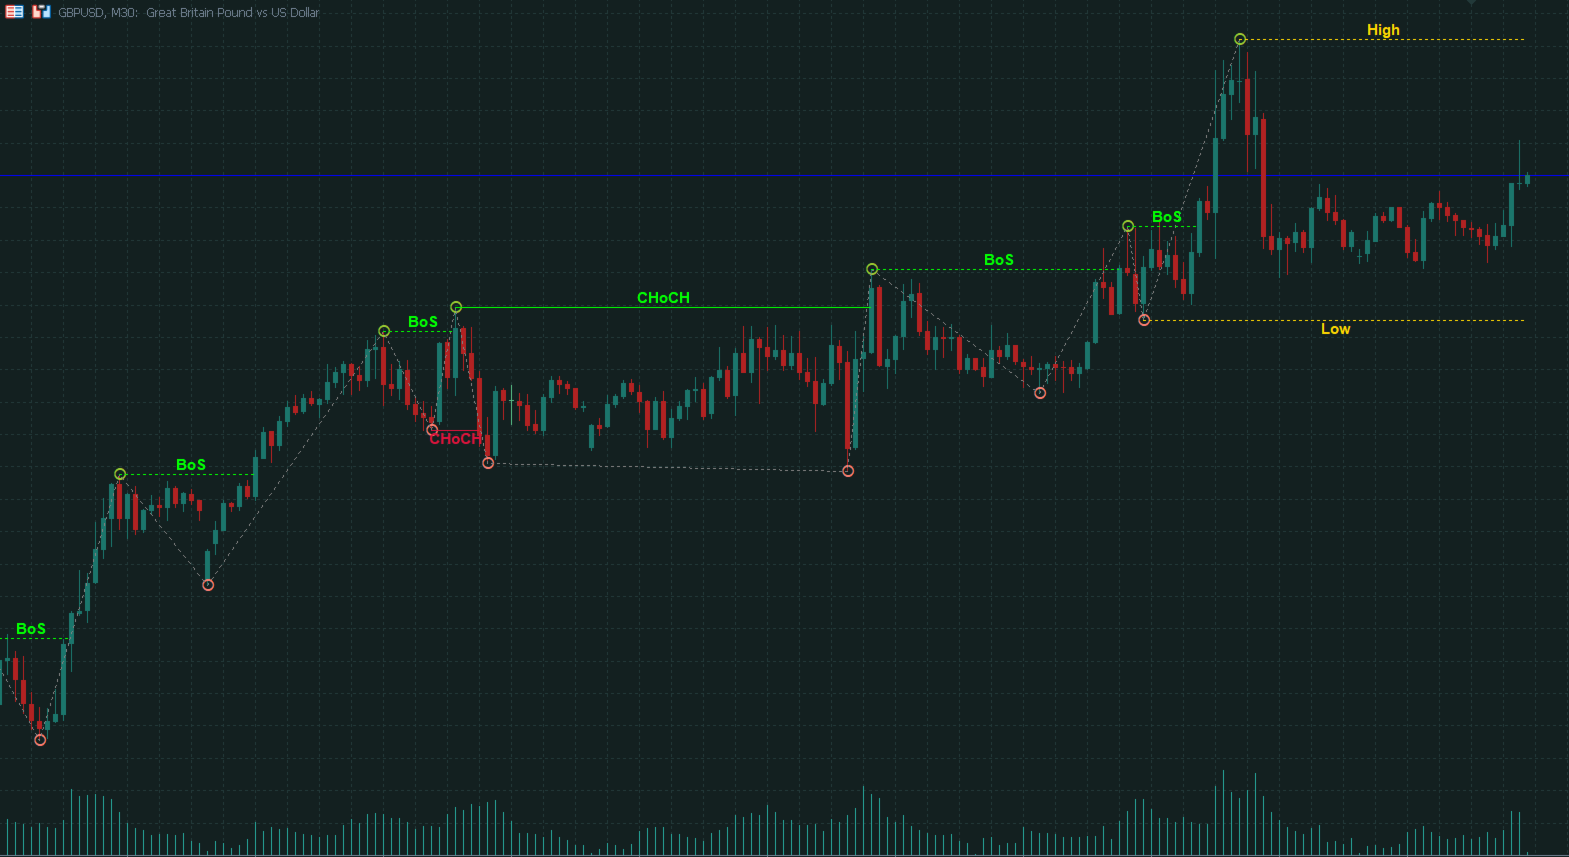
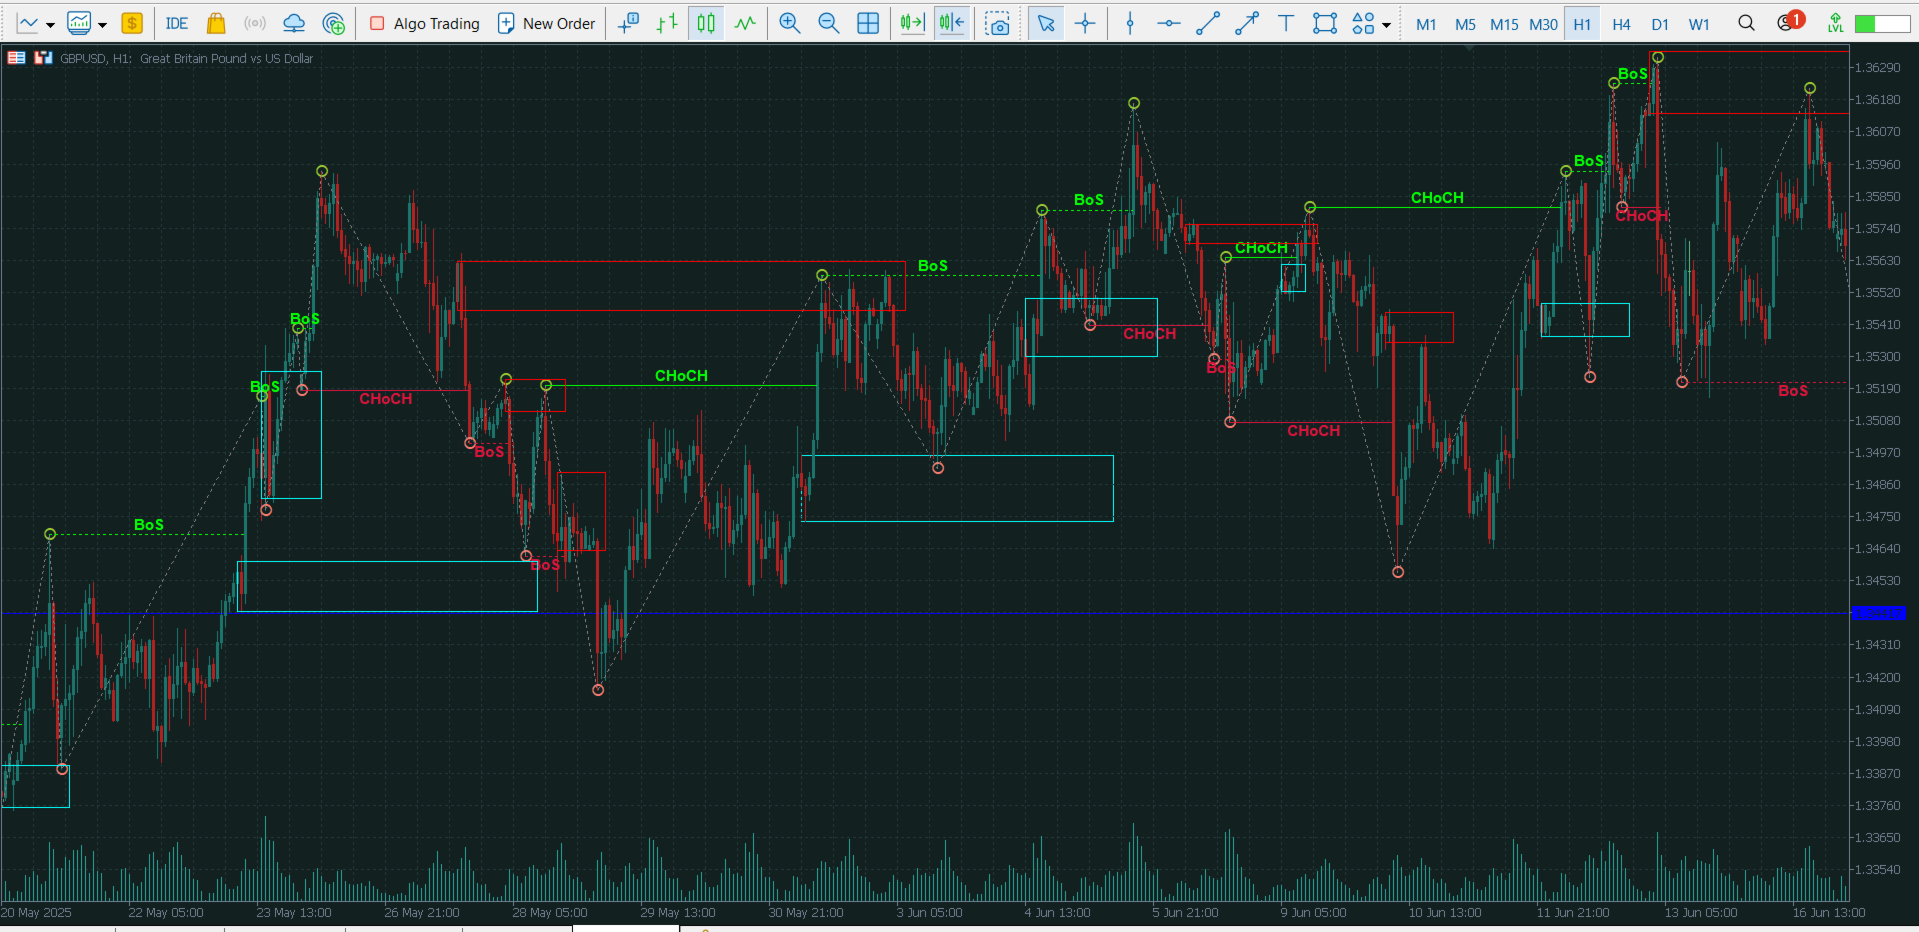
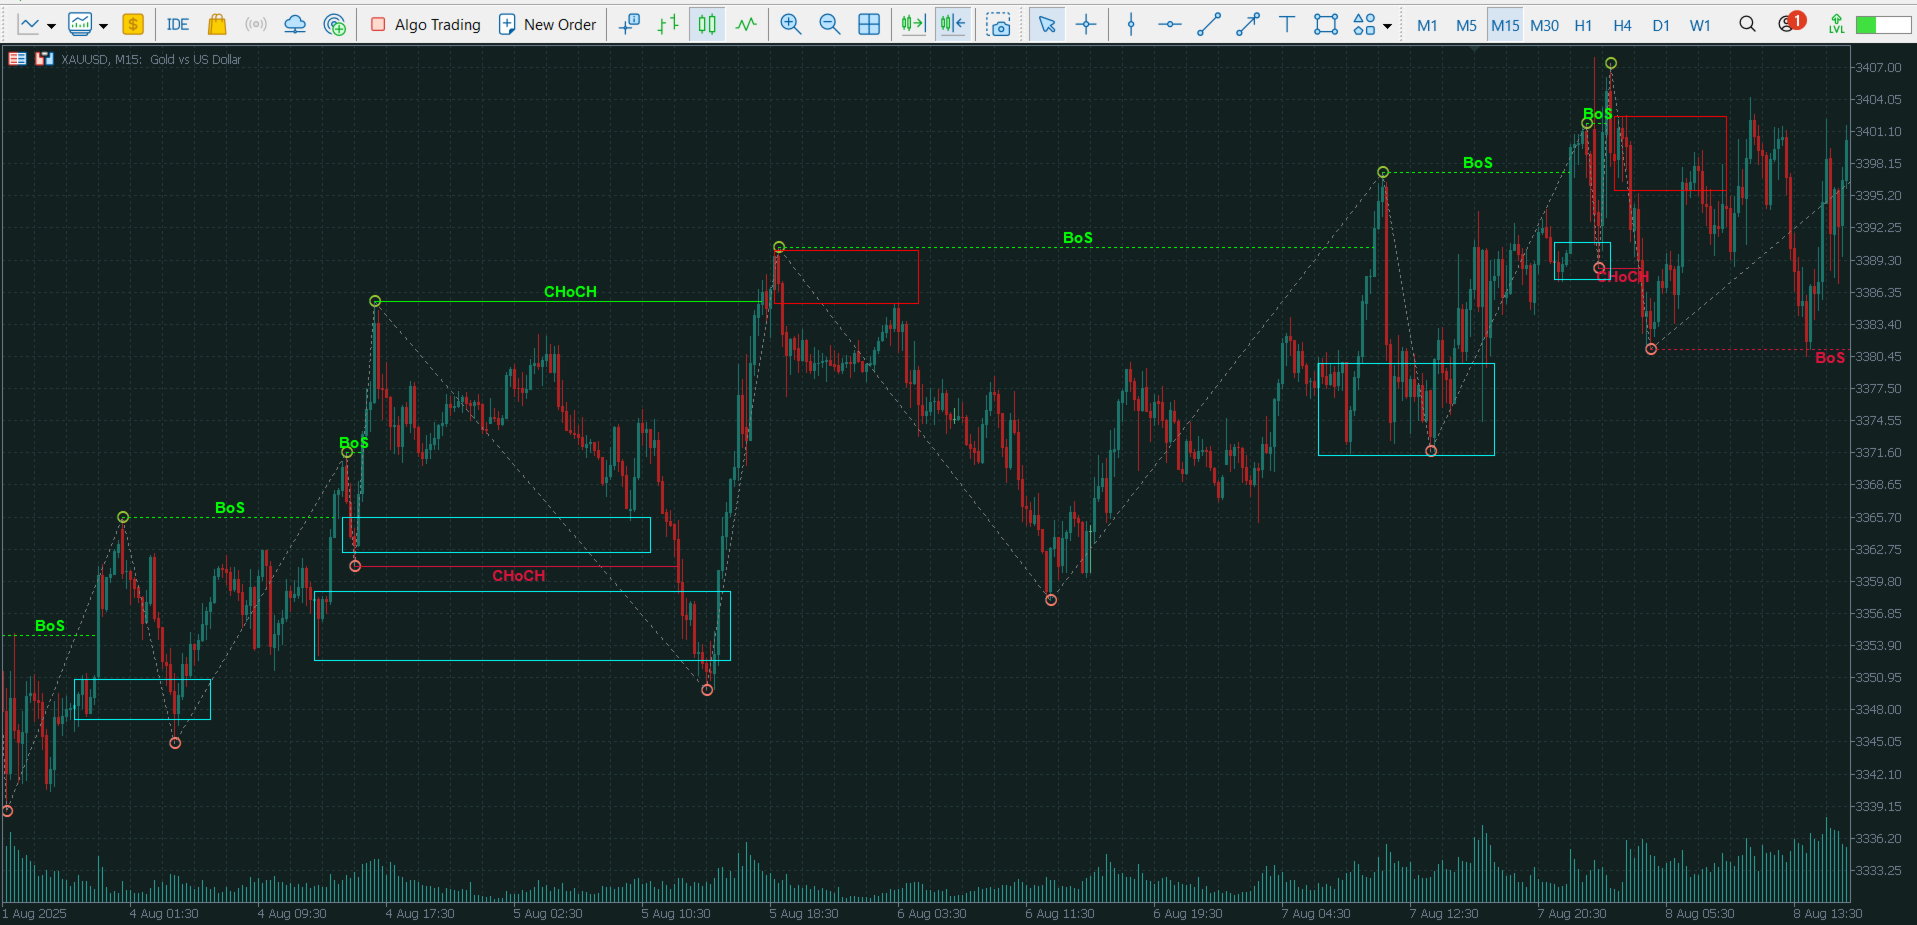
Structure Analysis Indicator automatically identifies Market Structure based on Smart Money Concepts (SMC). It clearly displays Break of Structure (BoS), Change of Character (CHoCH), Higher Highs, Higher Lows, Lower Highs, and Lower Lows in real-time.
✨ Key Features
Automatic Market Structure Detection
- ✅ Break of Structure (BoS) - Price breaks previous structure in trend direction
- ✅ Change of Character (CHoCH) - Trend reversal signals
- ✅ Higher Highs/Lower Lows - Key swing points identification
- ✅ Structure Lines - Visual connections between important levels
3 Analysis Methods
🕯️ Close Candle Method
- Analyzes candle close prices
- Best for: Swing Trading, Position Trading
- More accurate and stable signals
📈 Full Range Method
- Analyzes candle highs and lows
- Best for: Scalping, Day Trading
- Faster response to price movements
🎢 Normal Swing Method
- Analyzes natural swing points
- Best for: Trend overview
- Simple and clear visualization
Customizable Colors
- 🟢 Green - Uptrend and bullish BoS
- 🔴 Red - Downtrend and bearish BoS
- 🟡 Gold - Current High/Low levels
📖 How It Works
Break of Structure (BoS)
- Occurs when price breaks previous High/Low in trend direction
- Bullish BoS: Price makes new Higher High
- Bearish BoS: Price makes new Lower Low
- Displayed with dotted line and "BoS" label
Change of Character (CHoCH)
- Occurs when price breaks structure in opposite direction
- Signals potential trend reversal
- Displayed with solid line and "CHoCH" label
🎓 How to Use
1. Identify Trend
- Multiple BoS = Strong trend continuation
- CHoCH appears = Potential trend reversal
- Count Higher Highs/Lower Lows = Measure trend strength
2. Entry Signals
Buy Setup:
- Wait for CHoCH from downtrend to uptrend
- Wait for pullback to recent Low (Support)
- Wait for bullish BoS confirmation → Enter Buy
Sell Setup:
- Wait for CHoCH from uptrend to downtrend
- Wait for pullback to recent High (Resistance)
- Wait for bearish BoS confirmation → Enter Sell
3. Risk Management
- Stop Loss: Behind recent significant High/Low
- Take Profit: Opposite side High/Low or Risk:Reward 1:2+
💡 Trading Strategies
Strategy 1: BoS Continuation
- Identify main trend (higher timeframe)
- Wait for pullback to demand/supply zone
- Wait for BoS in trend direction
- Enter trade following BoS
Strategy 2: CHoCH Reversal
- Observe CHoCH occurrence
- Wait for retest of CHoCH level
- Wait for BoS in new direction
- Enter trade following new trend
Strategy 3: Structure Breaks
- Count Higher Highs or Lower Lows
- 3+ points = Strong trend
- Enter following trend direction
- Exit when CHoCH occurs
🔧 Settings
| Parameter | Description | Recommended |
|---|---|---|
| Analyze Method | Choose analysis mode | Close Candle |
| Color Trend Up | Uptrend color | Lime |
| Color Trend Down | Downtrend color | Crimson |
| Color High/Low | High/Low marker color | Gold |
| Count Bars | Bars to analyze | 0 (All) |
Recommended Timeframes
- Scalping: M5, M15 → Full Range Method
- Day Trading: H1, H4 → Close Candle Method
- Swing Trading: D1, W1 → Close Candle Method
🎯 Advantages
✅ Fully Automatic - No manual drawing required
✅ High Accuracy - Tested algorithm
✅ User-Friendly - Suitable for beginners and professionals
✅ Universal - Works on all timeframes and assets
✅ Real-Time - Instant signal updates
✅ No Repaint - Signals don't change after formation
✅ Clean Code - Professional development, stable performance
🌟 Why Choose This Indicator?
| Feature | Structure Analysis | Other Indicators |
|---|---|---|
| Market Structure Analysis | ✅ | ❌ |
| BoS/CHoCH Detection | ✅ | ❌ |
| 3 Analysis Modes | ✅ | ❌ |
| No Repaint | ✅ | Sometimes |
| Clean Professional Code | ✅ | Variable |
| All Timeframes | ✅ | Most |
| Real-Time Updates | ✅ | Most |
👥 Perfect For
✅ Smart Money Concept traders
✅ ICT methodology followers
✅ Swing traders seeking structure
✅ Day traders needing quick signals
✅ Beginners learning market structure
⚠️ Disclaimer
Trading involves risk. Test the indicator on a demo account before live trading.
This indicator is an analysis tool, not an automated trading system.
Past performance does not guarantee future results.
📞 Contact & Support
💬 Support: iamsiri.co@gmail.com
🌐 Website: Facebook
🚀 Get Started Today!
Transform your trading with professional Market Structure analysis.
© 2025 Investing Lab. All Rights Reserved.
Developed by professional traders for serious traders.