PP Support Resistance MT4
- 지표
- 버전: 1.0
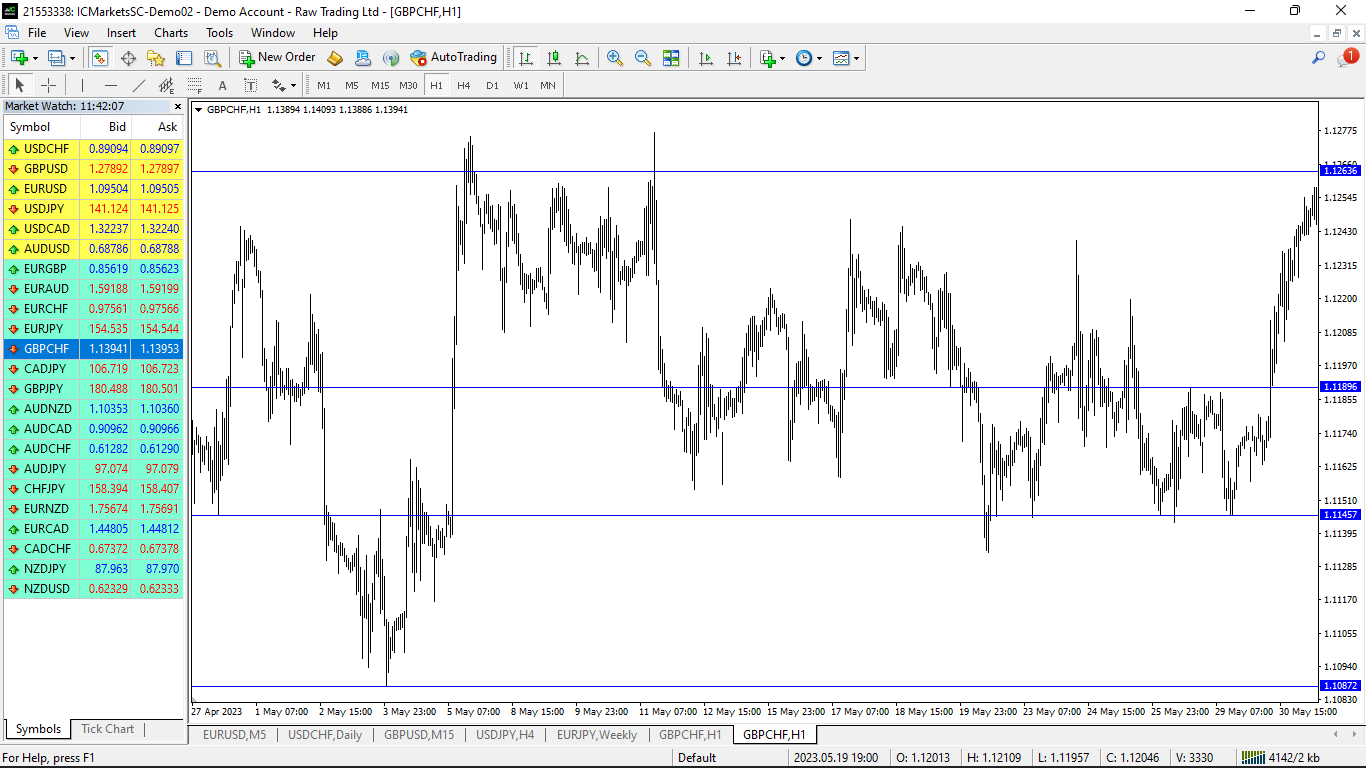
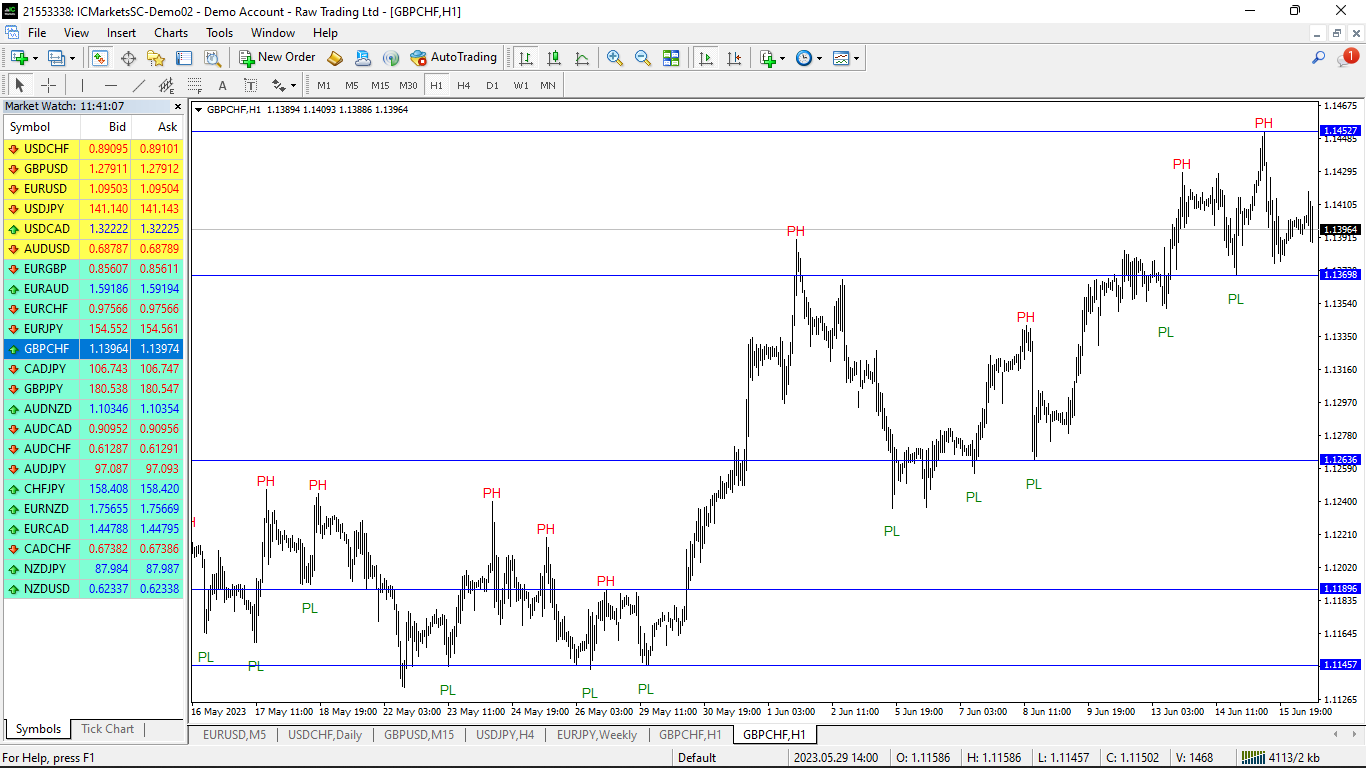
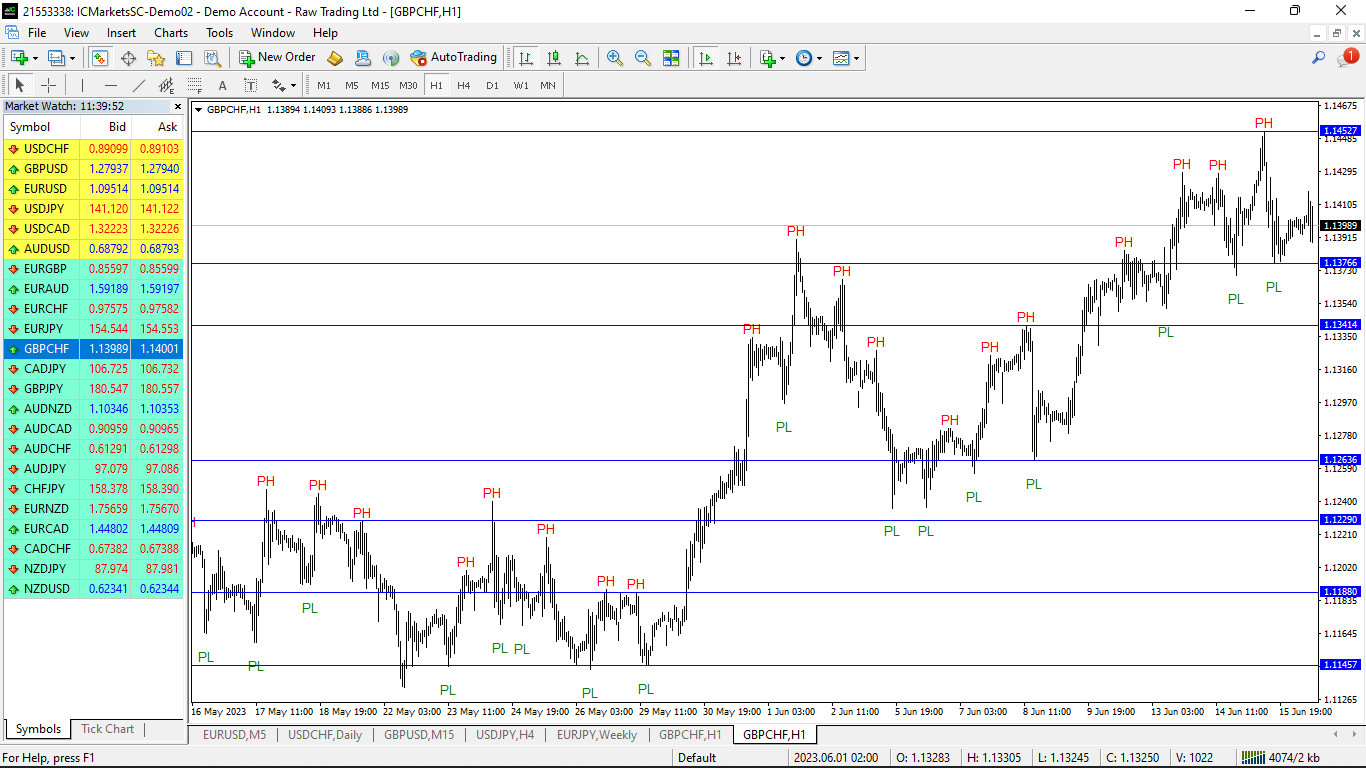
This indicator identifies swing highs and swing lows in the price chart by comparing the Highs and lows of each candle to a specified number of candle before and after it. Once it has identified the swing highs and swing lows, it can use them to determine potential support and resistance levels. A support level is formed when the price drops and bounces back up from a swing low, indicating that there is buying pressure at that level. A resistance level is formed when the price rises and reverses downward from a swing high, suggesting selling pressure at that level.
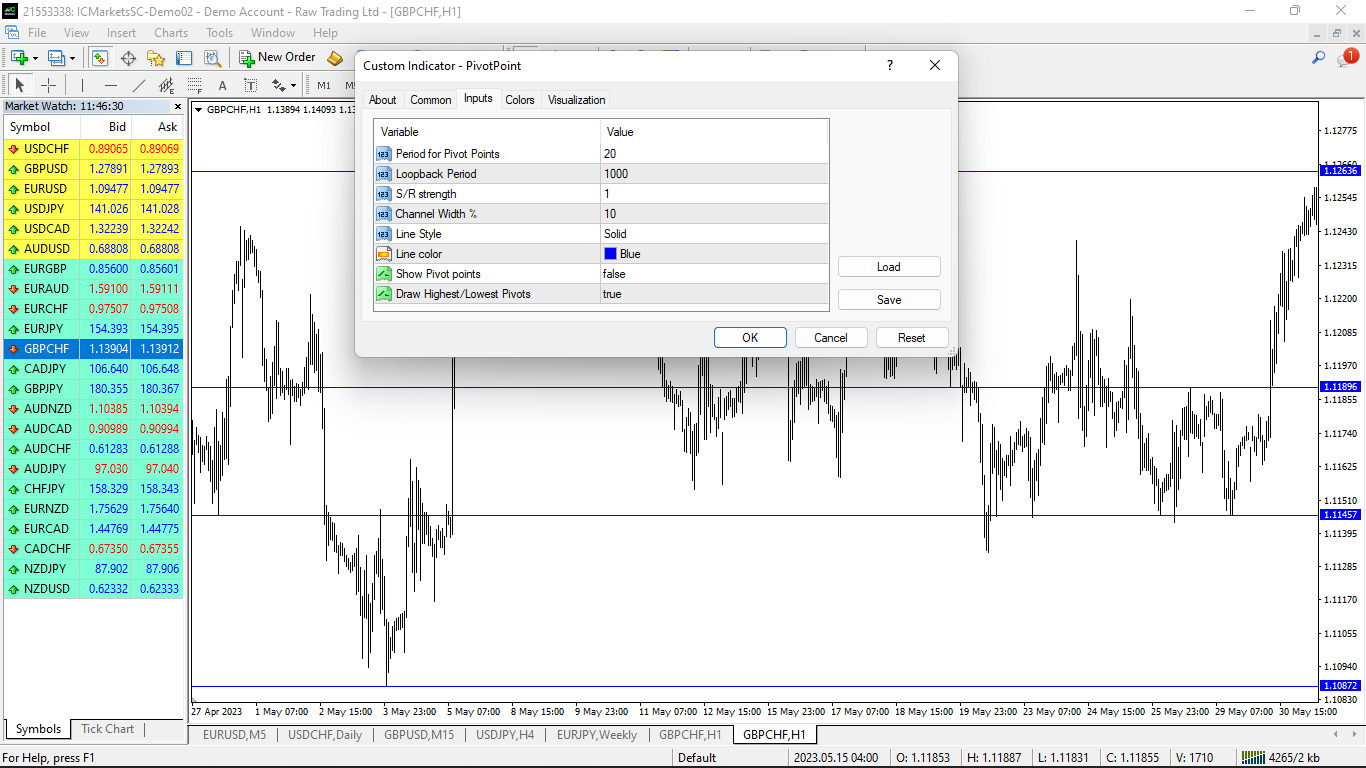
Parameters:
Pivot point Period: The number of candle the indicator uses to find the swing highs and lows. For example, to find a swing high, the indicator compares the high of that candle to the high of the x number of candles before and after it. By increasing the period the swing will be more strict.
Look Back Period: Hw far back the indicator will search for swing highs and lows
S/R Strength: How many peaks found in a similar zone could be considered as peaks.
Channel Width %: Supports/Resistances are areas where peaks gather. The areas were peaks gather is expressed as a percentage, By increasing this value the criteria for finding SR level will get more strict.
line Style: Type of Line to use
Line Color: Color of the SR Levels
Show Pivot Points: Whether or not to show the Swing High and Lows on the chart
This indicator can help with the following:
-
Confirming trend reversals: This indicator can be useful in confirming potential trend reversals. When the indicator changes direction, it suggests a shift in the price momentum. Traders can look for instances where the indicator changes from making higher swing highs to lower swing highs (or vice versa) to identify possible trend reversals.
-
Highlighting chart patterns: This indicator can help highlight various chart patterns, such as double tops, double bottoms, head and shoulders patterns, and more. These patterns often indicate potential trend reversals or continuation patterns. By combining this indicator with pattern recognition, traders can gain additional insights into the market's direction.
-
Setting dynamic stop-loss levels: Support and resistance levels identified by the Swing highs/lows can be used as dynamic stop-loss levels. When entering a trade, you can set your stop-loss order slightly below the support level for long positions or above the resistance level for short positions. This approach allows you to manage risk and protect your capital.


Nice indicators, thank you very much to the author