Trade Balance Indicator

5
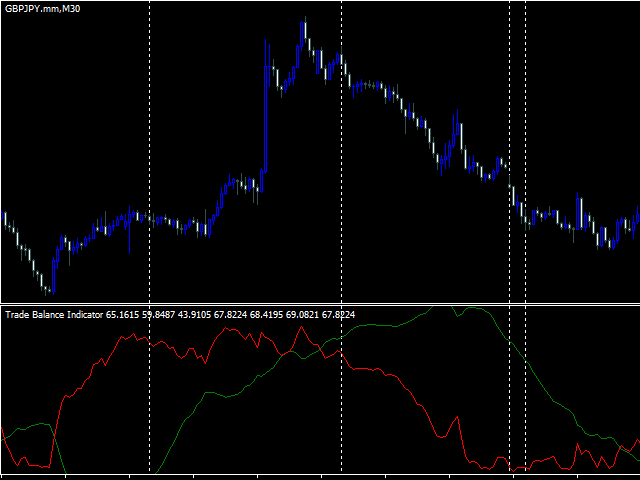
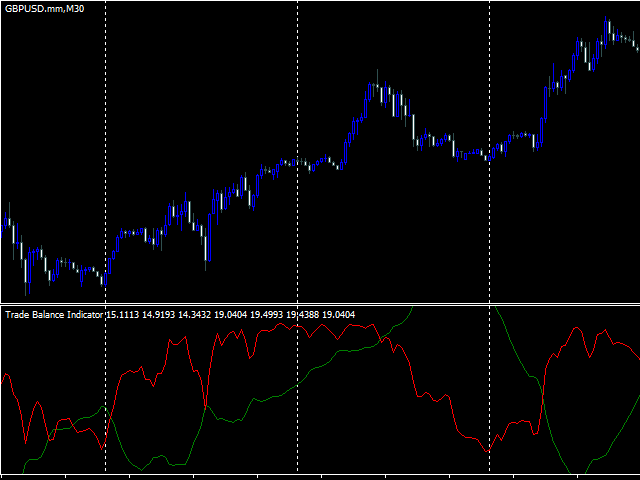
A trend indicator showing the strength of bulls and bears in a trading range.
Consists of two lines:
  1. The green line is a balanced overbought/oversold condition.
  2. The red line is the direction of trading activity.
Does not redraw calculations.
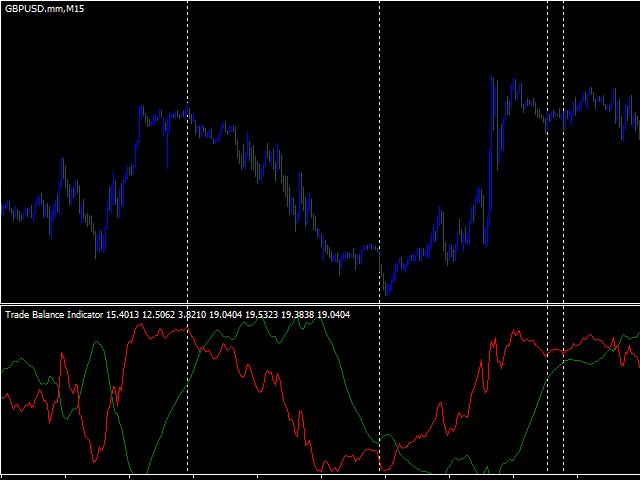
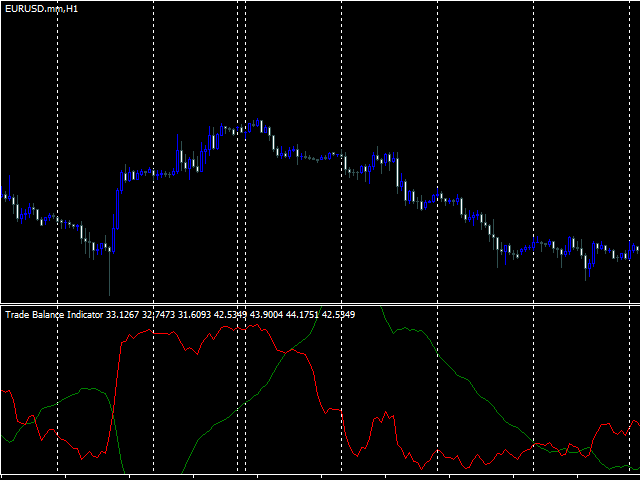
Can be used on all Symbols/Instruments/Time Frames.
Easy to use and set up.


How to use the indicator and what it determines.
The basic rule is to follow the direction of the red line:
if it crosses the green line from the bottom up, the market is dominated by bulls.
if it crosses the green line from top to bottom, it means bears prevail.
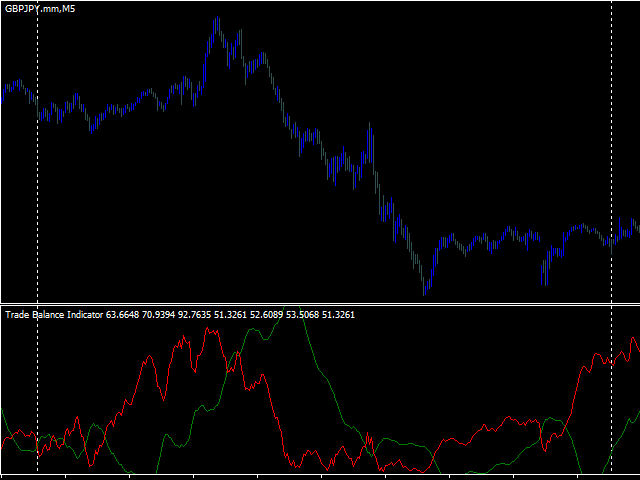
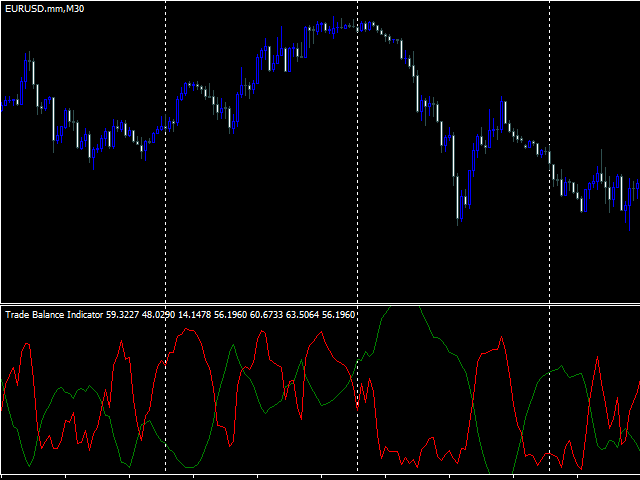
The green line is the overbought/oversold oscillator.
A break from the upper and lower ranges of an indicator often indicates a change in price direction. You should wait for confirmation of the red line.
Hanging at the upper or lower range means a long trend direction.
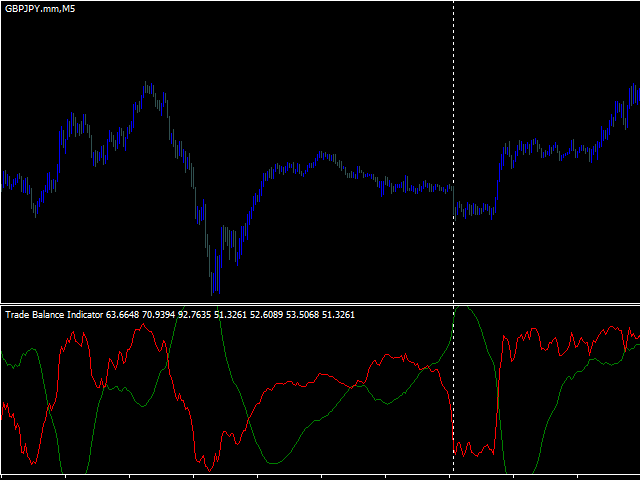
The older the Time Frame, the more accurate the calculations.
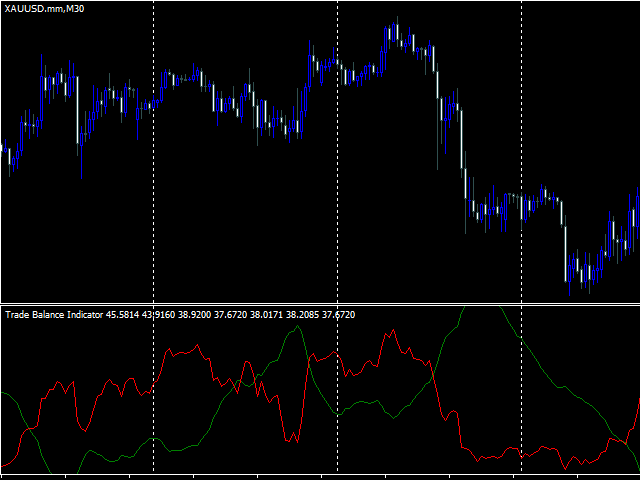
Input parameters
Calculation Period - The number of bars for the calculation period.
Balance Line Smoothing - Adjustable green line parameter, enhances smoothness.
Number Bars - The number of indicator bars on the chart.
리뷰 1
massey5782
183
massey5782 2024.08.14 08:47 
 

A very accurate and intelligent indicator. 5 stars!!!

추천 제품
Extremum Reverse Bar
Yurij Izyumov
2.8 (5)
This indicator has been created for finding the probable reversal points of the symbol price. A small candlestick reversal pattern is used it its operation in conjunction with a filter of extremums. The indicator is not redrawn! If the extremum filter is disabled, the indicator shows all points that have a pattern. If the extremum filter is enabled, the condition works – if the history Previous bars 1 candles back contains higher candles and they are farther than the Previous bars 2 candle, such
FREE
MACD in MA
Nikolaos Pantzos
iMACD in iMA is indicator to change color in iMA if iMACD is upper of zero (up trend) or lower of zero (down trend). It is a useful tool to track when the upside and the downside iMACD on iMA. You can to get source code from here . Parameters MA_Periods — Period for iMA. MA_Method — Method for iMA. MACD_FastEMA — Fast EMA for MACD. MACD_SlowEMA — Slow EMA for MACD. MACD_SignalSMA — SMA signal for MACD. MACD_ApliedPrice — Price used for MACD. BarsCount — How many bars will show the line. Revers
FREE
SuperTrend V
Muhammad Hassaan
*This is TradingView indicator converted to mql4* The SuperTrend V indicator is a popular technical analysis tool used to identify trends and potential trend reversals in financial markets. It is based on the concept of the SuperTrend indicator but incorporates additional features and variations. The SuperTrend V indicator uses a combination of price action and volatility to determine the trend direction and generate trading signals. Here are the key components and features of the indicator: Ca
PZ Penta O MT4
PZ TRADING SLU
2.33 (3)
The Penta-O is a 6-point retracement harmonacci pattern which usually precedes big market movements. Penta-O patterns can expand and repaint quite a bit. To make things easier this indicator implements a twist: it waits for a donchian breakout in the right direction before signaling the trade. The end result is an otherwise repainting indicator with a very reliable trading signal. The donchian breakout period is entered as an input. [ Installation Guide | Update Guide | Troubleshooting | FAQ | A
FREE
Free automatic fibonacci
Tonny Obare
4.67 (49)
Free automatic Fibonacci is an indicator that automatically plots a Fibonacci retracement based on the number of bars you select on the BarsToScan setting in the indicator. The Fibonacci is automatically updated in real time as new highest and lowest values appears amongst the selected bars. You can select which level values to be displayed in the indicator settings. You can also select the color of the levels thus enabling the trader to be able to attach the indicator several times with differe
FREE
Follow The Line
Oliver Gideon Amofa Appiah
3.94 (16)
FOLLOW THE LINE GET THE FULL VERSION HERE: https://www.mql5.com/en/market/product/36024 This indicator obeys the popular maxim that: "THE TREND IS YOUR FRIEND" It paints a GREEN line for BUY and also paints a RED line for SELL.  It gives alarms and alerts of all kinds. IT DOES NOT REPAINT and can be used for all currency pairs and timeframes. Yes, as easy and simple as that. Even a newbie can use it to make great and reliable trades. NB: For best results, get my other premium indicators for more
FREE
Wise Men Indicator demo
Bohdan Kasyanenko
3 (2)
The indicator displays signals according to the strategy of Bill Williams on the chart. Demo version of the indicator has the same features as the paid, except that it can work only on a demo account . Signal "First Wise Man" is formed when there is a divergent bar with angulation.  Bullish divergent bar - with lower minimum and closing price in the upper half. Bearish divergent bar - higher maximum and the closing price at the bottom half. Angulation is formed when all three lines of Alligator
FREE
하모닉 패턴은 시장 반전점을 예측하는 데 가장 적합합니다. 이러한 패턴은 높은 승률과 하루 동안 다양한 거래 기회를 제공합니다. 저희 인디케이터는 하모닉 트레이딩 문헌에 기반하여 가장 인기 있는 하모닉 패턴을 식별합니다. 중요 사항: 이 인디케이터는 다시 그리지 않으며 (D 지점에서 패턴을 감지함), 따라잡지 않습니다 (패턴이 유효하거나 취소됨). 사용 방법: MT5 차트에 인디케이터를 끌어다 놓으세요. 패턴 감지를 TRUE로 설정하세요 (ABCD; Gartley). 원하는대로 편차를 조정하세요 (높은 편차는 더 많은 패턴, 낮은 편차는 더 적은 패턴). 색상을 원하는 대로 사용자 정의하세요. 필요에 따라 ENTRY POINT, TP 및 SL에 대한 경고를 활성화하거나 비활성화하세요. 패턴 감지 시: 알고리즘은 D 지점에서 패턴을 감지합니다. 경고가 활성화되어 있으면 패턴 감지에 대한 알림을 보냅니다. 패턴이 무효화되면 "패턴 취소"라는 메시지가 포함된 경고가 트리거됩니다. 성공적인
FREE
Traditional MACD MT4
Daniel Lewis
4.58 (55)
MACD indicator in MetaTrader 4/5 looks different than MACD does in most other charting software. That is because the MetaTrader 4/5 version of MACD displays the MACD line as a histogram when it is traditionally displayed as a line. Additionally, the MetaTrader 4/5 version computes the Signal line using an SMA, while according to MACD definition it is supposed to be an EMA. The MetaTrader 4/5 version also does not compute a true MACD Histogram (the difference between the MACD/Signal lines). This
FREE
Step RSI AM
Andrii Matviievskyi
5 (2)
제시된 지표는 고전적인 기술적 분석 지표인 RSI를 기반으로 독창적으로 개발된 것입니다. 지표 값의 급격한 변동을 완화하기 위해 약한 변화를 차단하고 트레이더의 주의를 값의 강한 변동에 집중시키는 필터가 사용됩니다. 이 표시기는 형성된 막대에 다시 칠해지지 않습니다. 이 지표의 효과를 높이려면 추세 방향과 지지/저항 수준을 파악하는 지표와 함께 사용해야 합니다. 지표 신호는 지표 히스토그램이 지표 신호선을 교차하는 지점에서 제공됩니다. 신호가 확인된다는 것은 가격이 신호가 주어진 막대의 최대/최소값을 돌파할 때를 말합니다. 이 표시기를 사용하면 모바일 단말기와 이메일로 신호 알림을 보낼 수 있습니다. 구성 가능한 매개변수: Style - 지표 신호의 스타일(지표의 주요 신호는 오실레이터가 신호선을 교차하거나 오실레이터가 0선을 교차하는 것임) Number_of_bars_calculated - 지표가 계산되어 표시될 막대의 수입니다.   RSI_Price - 지표를 계산하는 데 사용되
FREE
KeltnerChannelIndicator
Todd Terence Bates
3 (2)
The Keltner Channel is a volatility-based technical indicator composed of three separate lines. The middle line is an exponential moving average (EMA) of the price. Additional lines are placed above and below the EMA. The upper band is typically set two times the Average True Range (ATR) above the EMA, and the lower band is typically set two times the ATR below the EMA. The bands expand and contract as volatility (measured by ATR) expands and contracts. Since most price action will be encompasse
FREE
Head and Shoulders Pattern Indicator - Your Key to Recognizing Trend Reversals Unlock the power of pattern recognition with the "Head and Shoulders Pattern Indicator." This cutting-edge tool, designed for MetaTrader, is your trusted ally in identifying one of the most powerful chart patterns in technical analysis. Whether you're a novice or an experienced trader, this indicator simplifies the process of spotting the Head and Shoulders pattern, allowing you to make informed trading decisions. Key
FREE
BoxInside MT4
Evgeny Shevtsov
4.83 (6)
This indicator calculates the volume profile and places labels that correspond to the VAH, VAL and POC levels, for each candle individually. Indicator operation features The indicator works on the timeframes from M5 to MN, but it uses the history data of smaller periods: M1 - for periods from M5 to H1, M5 - for the H4 period, M30 - for the D1 period, H4 - for the W1 period, D1 - for the MN period. The color and location of the VAL, VAH and POC labels on the current candle are considered to be c
FREE
SMA Indicator
Nitu Brijesh Yadav
Arrow Indicator (Buy/Sell Alerts) – Simple Yet Powerful Tool!             Product Version: 1.01           Indicator Type: Trend Reversal Signals           Timeframes Supported: All (Recommended: H1, H4, D1)           Key Features: Buy Signal: Green upward arrow () appears below the candle  Sell Signal : Red downward arrow () appears above the candle Accurate Trend Reversal Detection – Based on tried and tested SMA strategy. ️ Clean Chart View – Minimalist, non-i
FREE
MASi Three Screens
Aleksey Terentev
5 (2)
MASi Three Screens is based on the trading strategy by Dr. Alexander Elder. This indicator is a collection of algorithms. Algorithms are based on the analysis of charts of several timeframes. You can apply any of the provided algorithms. List of versions of algorithms:     ThreeScreens v1.0 - A simple implementation, with analysis of the MACD line;     ThreeScreens v1.1 - A simple implementation, with analysis of the MACD histogram;     ThreeScreens v1.2 - Combines the first two algorithms in
FREE
FlatBreakout
Aleksei Vorontsov
FlatBreakout (Free Version) Flat Range Detector and Breakout Panel for MT4 — GBPUSD Only FlatBreakout is the free version of the professional FlatBreakoutPro indicator, specially designed for flat (range) detection and breakout signals on the GBPUSD pair only. Perfect for traders who want to experience the unique fractal logic of FlatBreakout and test breakout signals on a live market without limitations. Who Is This Product For? For traders who prefer to trade breakout of flat ranges (breakout,
FREE
Wave Reversal Indicator
Vitalyi Belyh
4 (2)
Wave Reversal Indicator - determines the direction of trend waves and price reversals. The indicator shows wave movements and trend directions. It gives recommendations where to follow the trader, helps to follow the trading strategy. It is an addition to an intraday or medium-term strategy. Almost all parameters are selected for each time frame and are changed automatically, the only parameter for manual adjustment is the wavelength. Works on various trading instruments and timeframes, recomme
FREE
Power Trend Free
Yurij Kozhevnikov
5 (2)
Power Trend Free - the indicator shows the trend strength in the selected period. Input Parameters The indicator has three input parameters: Period - a positive number greater than one, it shows the number of candlesticks used for calculations. If you enter one or zero, there will be no error, but the indicator will not be drawn. Applied Price - the standard "Apply to:" set meaning data used for the indicator calculation: Close - Close prices; Open - Open prices; High - High prices; Low - Low p
FREE
Trendline indicator
David Muriithi
2 (1)
Are you tired of drawing trendlines every time you're analyzing charts? Or perhaps you would like more consistency in your technical analysis. Then this is for you. This indicator will draw trend lines automatically when dropped on a chart. How it works Works similar to standard deviation channel found on mt4 and mt5. It has 2 parameters: 1. Starting Bar 2. Number of bars for calculation The   starting bar   is the bar which drawing of the trend lines will begin, while the   number of bars for c
FREE
Monitors the current trend, gives signals for an uptrend, downtrend and weakening of the current trend. Colors the situation on the market with the appropriate color. Tool - any. Timeframe - any. Advantages The indicator does not repaint its signals. There are alert signals. Easy to use. Flexible settings. Suitable for trading any financial instruments. Settings Name Description Fast parameter The value of the fast parameter in the indicator (Should be less than the slow one). Slow parameter The
FREE
Smart RSI MT4
Mostafa Saad Saeed Shawara
제품 제목 Smart RSI (MT4) – SmartView 시리즈의 일부 간단한 설명 MetaTrader 플랫폼에서 독특한 사용자 경험을 제공하는 RSI 지표입니다. 이전에 사용할 수 없었던 고급 기능을 제공하며, 더블 클릭으로 설정 열기, 삭제하지 않고 지표 숨기기/표시하기, 지표 창을 전체 차트 크기로 표시하기 등의 기능을 포함합니다. SmartView Indicators 시리즈의 나머지 부분과 원활하게 작동하도록 설계되었습니다. 개요 SmartView 시리즈는 혁신적인 기능을 통해 MetaTrader 플랫폼의 지표에 독특하고 독특한 사용자 경험을 제공하여 지표 관리를 더 빠르고 쉽게 만듭니다. 각 지표는 차트에 스마트 제어 패널이 장착되어 있어 필수 정보를 표시하고 모든 중요한 기능에 빠르게 액세스할 수 있습니다. 이전에 사용할 수 없었던 고유한 기능 SmartView 시리즈는 지표 작업을 더 쉽고 빠르게 만드는 고급 기능을 제공합니다: 더블 클릭으로 설정 열기: 지표 목록을
FREE
Identify Trend
Aleksey Ivanov
4.09 (23)
"추세 식별" 표시기는 매우 정확하고 가장 중요한 것은 짧은 지연으로 진정한 추세 움직임의 시작을 확립할 수 있는 강력한 필터링 방법을 사용합니다. 지표는 거래 스캘퍼 전략과 장기 거래 전략 모두에 사용할 수 있습니다.              지표 평균 알고리즘은 마지막 스크린샷에 나와 있습니다.               표시기 판독값은 명확하고 매우 간단하며 설명이 필요하지 않습니다. 지표의 파란색 선은 상승 추세를 표시하고 금색 선은 플랫, 빨간색 선은 하락 추세를 나타냅니다.  빨간색 또는 금색 선이 파란색으로 바뀌면 바이 로트가 열려야 합니다. 파란색 또는 금색 라인이 빨간색으로 변경되면 매도 포지션이 열립니다.         가격 변경 방향의 가능한 순간은 어떤 상황에서도 다시 그려지지 않는 화살표로 표시됩니다. 표시기는 모든 유형의 알림을 포함합니다. 표시 지침(추세 방향에 대한)이 마지막 두 막대에서 일치할 때 경고가 트리거됩니다.     표시기 설
FREE
WH Price Wave Pattern MT4
Wissam Hussein
4.4 (5)
Welcome to our   Price Wave Pattern   MT4 --(ABCD Pattern)-- The ABCD pattern is a powerful and widely used trading pattern in the world of technical analysis. It is a harmonic price pattern that traders use to identify potential buy and sell opportunities in the market. With the ABCD pattern, traders can anticipate potential price movements and make informed decisions on when to enter and exit trades. EA Version : Price Wave EA MT4 MT5 version : Price Wave Pattern MT5 Features :  Automatic
FREE
This indicator is the basis for an Expert Advisor that can be categorized as "almost Grail". See details below.             This indicator displays the projection of the Renko chart on the price chart. This projection is displayed as a stepped line, not as "bricks" (rectangles). See slides 1 and 2. Abbreviated name of the indicator: LRC – L ine of R enko on the price C hart.             The principle of its construction is very simple. First, a grid of horizontal lines (levels) is bu
FREE
Candle Countdown — MT4용 정확한 캔들 종료 시간 카운트다운 Candle Countdown은 차트 위에 현재 캔들이 종료될 때까지 남은 시간 을 표시하는 간단하고 정확한 도구입니다. 진입 시점이 캔들 마감에 의존하는 경우, 몇 초의 차이도 중요합니다. 이 인디케이터는 정확한 시간을 보여주어 서두르거나 추측하지 않고 결정을 내릴 수 있도록 도와줍니다. 캔들 종료 시간을 정확하게 제어하기 위한 인디케이터입니다. 표시 내용: 캔들 종료까지 남은 시간 현재 서버 시간 스프레드 Stop Level 타이머는 틱에 의존하지 않고 플랫폼의 내부 타이머를 통해 업데이트되므로, 시장 움직임이 적은 상황에서도 안정적으로 동작합니다. 이로 인해 낮은 변동성 구간에서도 부드럽고 안정적인 카운트다운을 제공합니다. 모든 정보는 배경 블록에 표시되어 어떤 차트 색상에서도 잘 보이며, 차트 분석을 방해하지 않습니다. 캔들 종료 시점이 가까워질수록 타이머 색상이 변경되어 빠르게 상황을 파악할 수
FREE
Triple RSI
Pablo Leonardo Spata
1 (1)
LOOK AT THE FOLLOWING STRATEGY WITH THIS INDICATOR. Triple RSI is a tool that uses the classic Relative Strength Indicator, but in several timeframes to find market reversals.    1.  ️ Idea behind the indicator and its strategy: In Trading, be it Forex or any other asset, the ideal is to keep it simple, the simpler the better . The triple RSI strategy is one of the simple strategies that seek market returns. In our experience, where there is more money to always be won, is in the marke
FREE
SC MTF Rsi MT4
Krisztian Kenedi
5 (1)
다중 타임프레임 지원, 사용자 정의 시각 신호 및 구성 가능한 알림 시스템을 갖춘 상대강도지수(RSI) 지표. 프리랜서 프로그래밍 서비스, 업데이트 및 기타 TrueTL 제품은 제 MQL5 프로필 에서 확인하실 수 있습니다. 피드백과 리뷰를 진심으로 환영합니다! RSI란 무엇인가요? 상대강도지수(RSI)는 가격 변화의 속도와 크기를 측정하는 모멘텀 오실레이터입니다. 이 지표는 0에서 100 사이에서 진동하며, 지정된 기간 동안 최근 상승폭과 최근 하락폭의 크기를 비교합니다. RSI는 주로 과매수 및 과매도 상태를 식별하는 데 사용됩니다. 높은 수치는 과매수 상태를 나타내고, 낮은 수치는 과매도 상태를 나타냅니다. 트레이더들은 또한 RSI와 가격 움직임 사이의 다이버전스를 주시하며, 이는 잠재적인 추세 전환을 신호할 수 있습니다. 기능: 화살표와 수직선을 사용한 시각적 신호 마커 구성 가능한 트리거(방향 변경, 레벨 교차, 고점/저점, 극단 구역)가 있는 세 개의 독립적인 신호
FREE
TreendLines
Sajjad Karimi
5 (1)
''Trendlines'' is an Indicator, that every Trader need and shows Trendline and  Support and resistance levels in all  Timeframe's. Also In 1-hour, 4-hour and daily time frames and Current timeframes, support, and resistance levels are specified and trend lines are drawn so that the trader can see all levels on a chart.   In   Properties   it is possible to turn off unnecessary Lines.  In ' Tendency indicator '' , as full package of Predictions that every Trader need, there  is also the Predict
FREE
TTM Squeeze MT4
Tinashe Ndarimani
Overview The TTM Squeeze indicator helps identify low volatility periods (squeeze) that often precede price breakouts. It uses Bollinger Bands (BB) and Keltner Channels (KC) to determine when the market is "coiling" and ready to move. Configuration Guide Volatility Settings The indicator uses Bollinger Bands to measure market volatility. When BBs are inside Keltner Channels, a squeeze is detected. The squeeze suggests the market is consolidating and may soon break out. True Range Option Optiona
FREE
SpectorMA
Sergii Krasnyi
5 (1)
차트의 시각적 측면을 향상시킬 뿐만 아니라 활기차고 역동적인 특성을 부여하는 지표를 소개합니다. 이 인디케이터는 하나 이상의 이동평균(MA) 인디케이터를 조합한 것으로, 지속적으로 색상이 변하면서 흥미롭고 다채로운 모습을 연출합니다. 이 제품은 그래픽 솔루션이므로 텍스트에서 수행하는 작업을 설명하기가 어렵고 제품이 무료 일뿐만 아니라 다운로드하면 더 쉽게 볼 수 있습니다. 이 인디케이터는 비디오 편집을 위해 차트의 아름다운 그림을 만들고 싶은 블로거 또는 차트를 생동감 있고 화려하게 만들고 싶은 트레이더에게 적합합니다. MA 선의 색상 팔레트는 무지개처럼 변경되거나 무작위로 변경됩니다(설정된 매개 변수에 따라 다름). MA 지표는 "MA 기간" 매개변수의 단계를 유지하여 독립적으로 정렬되므로 아름다운 그림을 만들 수 있습니다. 이 표시기는 또한 MA 기간을 지속적으로 변경할 수 있으므로 차트에 생동감과 역동성의 효과를 만들 수 있습니다.  관심을 가져주셔서 감사합니다. 좋은
FREE
이 제품의 구매자들이 또한 구매함
Gann Made Easy
Oleg Rodin
4.83 (161)
Gann Made Easy 는 mr.의 이론을 사용하여 최고의 거래 원칙을 기반으로 하는 전문적이고 사용하기 쉬운 Forex 거래 시스템입니다. W.D. 간. 이 표시기는 Stop Loss 및 Take Profit Levels를 포함하여 정확한 BUY 및 SELL 신호를 제공합니다. PUSH 알림을 사용하여 이동 중에도 거래할 수 있습니다. 구매 후 거래 방법 안내 및 유용한 추가 지표를 무료로 받으시려면 저에게 연락주세요! 아마도 Gann 거래 방법에 대해 이미 여러 번 들었을 것입니다. 일반적으로 Gann의 이론은 초보자 거래자뿐만 아니라 이미 거래 경험이 있는 사람들에게도 매우 복잡한 것입니다. Gann의 거래 방식은 이론적으로 적용하기 쉽지 않기 때문입니다. 나는 그 지식을 연마하고 Forex 지표에 최고의 원칙을 적용하기 위해 몇 년을 보냈습니다. 표시기는 적용하기가 매우 쉽습니다. 차트에 첨부하고 간단한 거래 권장 사항을 따르기만 하면 됩니다. 지표는 지속적으로 시장 분석
M1 Sniper
Oleg Rodin
5 (22)
M1 SNIPER 는 사용하기 쉬운 거래 지표 시스템입니다. M1 시간대에 맞춰 설계된 화살표 지표입니다. 이 지표는 M1 시간대 스캘핑을 위한 단독 시스템으로 사용할 수 있으며, 기존 거래 시스템의 일부로도 사용할 수 있습니다. 이 거래 시스템은 M1 시간대 거래용으로 특별히 설계되었지만, 다른 시간대에도 사용할 수 있습니다. 원래는 XAUUSD와 BTCUSD 거래를 위해 이 방법을 설계했지만, 다른 시장 거래에도 유용하다는 것을 알게 되었습니다. 이 지표의 신호는 추세 방향과 반대로 거래될 수 있습니다. 저는 지표의 신호를 활용하여 양방향으로 거래할 수 있도록 돕는 특별한 거래 기법을 알려드립니다. 이 방법은 특별한 동적 지지선과 저항선 가격 영역을 활용하는 것을 기반으로 합니다. 구매하시면 M1 SNIPER 화살표 지표를 바로 다운로드하실 수 있습니다. 또한, 아래 스크린샷에 표시된 Apollo Dynamic SR 지표는 M1 SNIPER 도구를 사용하는 모든 사용자에게 무료로
Ultimate Sniper Dashboard
Hispraise Chinedum Abraham
4.82 (22)
299달러로 할인! 추후 가격이 인상될 수 있습니다! 아래 설명을 읽어보세요! Ultimate Sniper Dashboard를 위한 최고의 엔트리 시스템: ULTIMATE DYNAMIC LEVELS. (내 제품을 확인하십시오) Ultimate Sniper Dashboard는 MT4 다중 통화 테스트 제한으로 인해 라이브 시장에서만 작동합니다. Ultimate-Sniper 대시보드를 소개합니다! HA-Sniper와 MA-Sniper를 모두 포함하는 최고의 제품입니다. 그리고 많은 특수 모드. Ultimate Sniper Dashboard는 절대 야수입니다! 초보자 또는 전문가 트레이더를 위한 최고의 솔루션! 다시 움직임을 놓치지 마세요! 단순함과 핍을 좋아하는 트레이더를 위해 특별한 제품을 준비했습니다. 본질적으로 단순한 대시보드는 여러 사용자 지정 알고리즘을 기반으로 28개의 통화 쌍을 살펴보는 모든 작업을 수행합니다. 단 하나의 차트로 전문가처럼 시장을 읽을 수 있습니다. 움직이기
Market Makers
Mohamed Hassan
5 (3)
After purchase, contact me privately to receive 1 month of free testing with EA Forex Proton! This advanced MT4 trading robot automatically executes signals from any MT4 indicator, including Market Makers. The latest version also includes AI integration, allowing each trade signal to be analyzed using Artificial Intelligence. Live Signal with EA Forex Proton: Click here Market Makers is a powerful price action trading system designed to identify high-probability Buy and Sell opportunities based
Trend Screener
STE S.S.COMPANY
4.79 (95)
트렌드 표시기, 트렌드 트레이딩 및 필터링을 위한 획기적인 고유 솔루션, 하나의 도구 안에 내장된 모든 중요한 트렌드 기능! Forex, 상품, 암호 화폐, 지수 및 주식과 같은 모든 기호/도구에 사용할 수 있는 100% 다시 칠하지 않는 다중 시간 프레임 및 다중 통화 표시기입니다. 기간 한정 특가: 지원 및 저항 스크리너 지표는 단 250 달러에 평생 제공됩니다. (원래 가격 150 달러) (제안 연장) Trend Screener는 차트에 점이 있는 화살표 추세 신호를 제공하는 효율적인 지표 추세 추종 지표입니다. 추세 분석기 표시기에서 사용할 수 있는 기능: 1. 트렌드 스캐너. 2. 최대 이익 분석이 있는 추세선. 3. 추세 통화 강도 측정기. 4. 경고가 있는 추세 반전 점. 5. 경고가 있는 강력한 추세 점. 6. 추세 화살표 Trend Screener Indicator가 있는 일일 분석 예, 일일 신호 성능...등은 여기에서 찾을 수 있습니다.   여기를 클릭하십시오.
Dynamic Scalper System
Vitalyi Belyh
5 (1)
" Dynamic Scalper System " 지표는 추세 파동 내에서 스캘핑 방식으로 거래하도록 설계되었습니다. 주요 통화쌍 및 금에서 테스트되었으며, 다른 거래 상품과의 호환성이 가능합니다. 추가적인 가격 변동 지원을 통해 추세에 따라 단기 포지션 진입 신호를 제공합니다. 지표의 원리 큰 화살표는 추세 방향을 결정합니다. 작은 화살표 형태의 스캘핑 신호를 생성하는 알고리즘은 추세 파동 내에서 작동합니다. 빨간색 화살표는 상승 방향을, 파란색 화살표는 하락 방향을 나타냅니다. 민감한 가격 변동선은 추세 방향으로 그려지며, 작은 화살표의 신호와 함께 작용합니다. 신호는 다음과 같이 작동합니다. 적절한 시점에 선이 나타나면 진입 신호가 형성되고, 선이 있는 동안 미결제 포지션을 유지하며, 완료되면 거래를 종료합니다. 권장되는 작업 시간대는 M1~H4입니다. 화살표는 현재 캔들에 형성되며, 다음 캔들이 이미 시작되었더라도 이전 캔들의 화살표는 다시 그려지지 않습니다. 입력 매개
GoldRush Trend Arrow Signal
Kirk Lee Holloway
5 (2)
GoldRush 트렌드 화살표 신호 GoldRush 트렌드 화살표 신호 지표는 XAU/USD 시장에서 고속 단기 스캘핑 트레이더를 위해 설계된 정밀한 실시간 트렌드 분석을 제공합니다. 1분 시간대에 특화되어 설계된 이 도구는 명확한 진입점을 표시하는 방향성 화살표를 제공하여 스캘퍼들이 변동성이 높은 시장 환경에서도 자신 있게 거래할 수 있도록 합니다. 이 지표는 PRIMARY 및 SECONDARY 경고 화살표로 구성됩니다. PRIMARY 신호는 추세 방향의 변화를 나타내는 흰색과 검은색 방향성 화살표이며, SECONDARY 신호는 PRIMARY 화살표가 지시하는 방향을 확인하고 잠재적인 거래 진입점을 표시하는 파란색과 빨간색 화살표입니다. 참고: 추세 방향이 변경된 후 PRIMARY 경고 화살표가 단 하나만 표시될 경우, 다수의 SECONDARY 파란색/빨간색 화살표가 표시될 수 있음을 유의해야 합니다. SECONDARY 신호는 신호 기준을 충족하는 어떤 캔들 이후에도 표시
Scalper Inside PRO
Alexey Minkov
4.74 (69)
Scalper Inside PRO – Since 2020. An exclusive indicator that utilizes an innovative algorithm to swiftly and accurately determine the market trend. The indicator automatically calculates opening, closing, and profit levels, providing detailed trading statistics. With these features, you can choose the most appropriate trading instrument for the current market conditions. Additionally, you can easily integrate your own arrow indicators into Scalper Inside Pro to quickly evaluate their statistics
Super Signal – Skyblade Edition 전문가용 노리페인트 / 노래그 트렌드 신호 시스템, 뛰어난 승률 제공 | MT4 / MT5용 1분, 5분, 15분과 같은 낮은 타임프레임에서 가장 좋은 성능을 보입니다. 핵심 기능: Super Signal – Skyblade Edition은 추세 매매를 위해 설계된 스마트 신호 시스템입니다. 이 시스템은 다중 필터 로직을 활용하여, 명확한 방향성과 실질적인 모멘텀이 수반된 고품질 추세만을 감지합니다. 이 시스템은 고점 또는 저점을 예측하지 않으며 , 다음 세 가지 조건이 모두 충족될 때만 신호를 발생시킵니다: 명확한 추세 방향 강화되는 모멘텀 건전한 변동성 구조 또한, 시장 세션 기반의 유동성 분석을 통해 신호의 신뢰성과 타이밍을 더욱 향상시킵니다. 신호 특성: 모든 화살표 신호는 100% 리페인트 없음 / 지연 없음 신호가 한 번 발생하면 고정되며, 깜빡이거나 사라지지 않음 차트 상의 시각적 화살표, 정보 패널, 팝업 알
PRO Renko System
Oleg Rodin
5 (30)
PRO Renko System 은 RENKO 차트 거래를 위해 특별히 고안된 매우 정확한 거래 시스템입니다. 이것은 다양한 거래 상품에 적용될 수있는 보편적 인 시스템입니다. 체계는 효과적으로 당신에게 정확한 반전 신호에 접근을 주는 소위 시장 소음을 중화합니다. 이 표시기는 사용하기가 매우 쉽고 신호 생성을 담당하는 매개 변수가 하나만 있습니다. 당신은 쉽게 당신의 선택의 어떤 무역 계기에 공구를 적응시킬 수 있고 renko 막대기의 크기. 나는 항상 당신이 내 소프트웨어로 수익성있게 거래 할 수 있도록 추가 지원을 제공 할 준비가되어 있습니다! 나는 당신에게 행복하고 수익성있는 거래를 기원합니다! 구매 후 저에게 연락하십시오! 내 렌코 차트 생성기를 보내드립니다. 또한 내 개인 권장 사항 및 시스템의 다른 모듈을 무료로 공유 할 것입니다!
Smart Price Action Concepts
Issam Kassas
4.77 (13)
우선적으로, 이 거래 도구는 전문적인 거래에 이상적인 비-다시 그리기 및 지연되지 않는 지표입니다.  온라인 강좌, 사용자 매뉴얼 및 데모. 스마트 가격 액션 컨셉트 인디케이터는 신규 및 경험 많은 트레이더 모두에게 매우 강력한 도구입니다. Inner Circle Trader Analysis 및 Smart Money Concepts Trading Strategies와 같은 고급 거래 아이디어를 결합하여 20가지 이상의 유용한 지표를 하나로 결합합니다. 이 인디케이터는 스마트 머니 컨셉트에 중점을 두어 대형 기관의 거래 방식을 제공하고 이동을 예측하는 데 도움을 줍니다.  특히 유동성 분석에 뛰어나 기관이 어떻게 거래하는지 이해하는 데 도움을 줍니다. 시장 트렌드를 예측하고 가격 변동을 신중하게 분석하는 데 탁월합니다. 귀하의 거래를 기관 전략에 맞추어 시장의 동향에 대해 더 정확한 예측을 할 수 있습니다. 이 인디케이터는 시장 구조를 분석하고 중요한 주문 블록을 식별하고 다양한
Ultimate Dynamic Levels
Hispraise Chinedum Abraham
4.7 (10)
現在、ホリデーディスカウントで399ドル! 今後値上がりする可能性があります。以下の説明をお読みください。 Ultimate Dynamic Levelsの紹介 - Ultimate Sniper DashboardのBESTエントリーインジケーター! 極めてローリスクなタイムリーエントリーと高RR!!! アルティメットスナイパーダッシュボードはこちら。 初心者はもちろん、プロのトレーダーにとっても最も重要な能力は、いつどこで相場が転換するかを正確に判断し、いかに安全に参入し、利益を得て退場するかを見極めることです。 アルティメット・ダイナミック・レベルズ・インディケーターは、相場が転換する可能性が最も高い場所を簡単に教えてくれるので、極めてローリスクなトレードを自信を持って行うことができ、同時にチャートをクリーンでシンプルに保ちながら、$$$を稼ぐことができるのです! アルティメット・ダイナミック・レベルズ・インディケーターは、複数の時間枠で重要な隠れたレベルを一度に見つけるユニークで強力なアルゴリズムを持っています。また、他の典型的なSRインジケーターのように、レベルを再描
Atomic Analyst
Issam Kassas
5 (5)
우선적으로 언급할 점은이 거래 지표가 다시 그리지 않고 지연되지 않으며 이를 통해 수동 및 로봇 거래 모두에 이상적이라는 점입니다. 사용자 매뉴얼: 설정, 입력 및 전략. Atomic Analyst는 가격의 강도와 모멘텀을 활용하여 시장에서 더 나은 이점을 찾는 PA Price Action Indicator입니다. 고급 필터를 장착하여 잡음과 거짓 신호를 제거하고 거래 잠재력을 높이는 데 도움이 됩니다. 복잡한 지표의 다중 레이어를 사용하여 Atomic Analyst는 차트를 스캔하고 복잡한 수학적 계산을 간단한 신호와 색상으로 변환하여 초보 트레이더가 이해하고 일관된 거래 결정을 내릴 수 있도록합니다. "Atomic Analyst"는 새로운 및 경험이 풍부한 트레이더를위한 종합적인 거래 솔루션입니다. 프리미엄 지표와 최고 수준의 기능을 하나의 거래 전략에 결합하여 모든 종류의 트레이더에 대한 다재다능한 선택지가되었습니다. 인트라데이 거래 및 스캘핑 전략 : 빠르고 정확한 일일
Route Lines Prices - 은 가격 방향을 찾는 데 사용되는 지표입니다. 간단한 인터페이스에는 가격 움직임 및 미래 방향 계산을 위한 다양한 알고리즘이 포함되어 있습니다. 이러한 알고리즘에는 사용된 시간대에 따른 변동성 계산 및 가격 평활화 기능이 있습니다. 이 지표는 " Calculating price values " 값을 변경하는 단일 매개변수를 제공합니다. 기본값인 1은 균형 잡힌 자동 계산을 제공하며, 별도의 설정 없이 바로 사용할 수 있습니다. 2에서 500 사이의 값을 수동으로 변경하여 자신만의 거래 시스템에 맞게 지표를 맞춤 설정할 수 있습니다. 이 지표는 M1부터 H4까지의 시간대에서 사용을 권장합니다. 모든 거래 상품에 적용 가능합니다. 신호 화살표는 캔들 종가에 생성되며, 과거 차트에는 다시 그려지지 않습니다. 메인 차트에 동일한 화살표가 표시됩니다. 다양한 유형의 알림을 사용할 수 있으며, 내장된 라인 궤적 카운터는 종가를 기반으로 작동합니다. 이는
Apollo SR Master
Oleg Rodin
5 (2)
Apollo SR Master는 지지/저항 구간에서의 거래를 더욱 쉽고 안정적으로 만들어 주는 특수 기능을 갖춘 지지/저항 지표입니다. 이 지표는 지역 가격의 고점과 저점을 감지하여 시간 지연 없이 실시간으로 지지/저항 구간을 계산합니다. 새롭게 형성된 저항 구간을 확인하기 위해 지표는 해당 저항 구간을 실제 매도 또는 매수 신호로 활용할 수 있음을 나타내는 특수 신호를 표시합니다. 이 경우, 저항 구간의 강도가 높아지고, 따라서 저항 구간에서의 성공적인 거래 가능성도 높아집니다. 이것이 바로 이 지표의 핵심 아이디어입니다. SR 존은 손절매와 이익실현을 더욱 쉽게 할 수 있도록 해줍니다. 신호 방향에 따라 SR 존 위 또는 아래 공간을 손절매로 활용할 수 있습니다. 또한, 반대쪽 SR 존은 잠재적 이익실현 영역으로 활용할 수 있습니다. 또한 Apollo SR Master 지표를 사용하는 모든 사용자에게 "Apollo Price Action System" 지표를 무료로 제공합니다.
Currency Strength Exotics
Bernhard Schweigert
4.88 (33)
현재 20% 할인! 초보자 또는 전문가 트레이더를 위한 최고의 솔루션! 이 표시기는 Exotic Pairs Commodities, Indexes 또는 Futures와 같은 기호에 대한 통화 강도를 표시하는 데 특화되어 있습니다. 금, 은, 석유, DAX, US30, MXN, TRY, CNH 등의 진정한 통화 강도를 보여주기 위해 9번째 줄에 모든 기호를 추가할 수 있습니다. 이것은 독특하고 고품질이며 저렴한 거래 도구입니다. 우리는 많은 독점 기능과 새로운 공식을 통합했습니다. 새로운 추세 또는 스캘핑 기회의 정확한 트리거 포인트를 정확히 찾아낼 수 있기 때문에 거래가 어떻게 개선될지 상상해 보십시오. 사용 설명서: 여기를 클릭 https://www.mql5.com/en/blogs/post/708876 모든 시간대에 작동합니다. TREND를 빠르게 확인할 수 있습니다! 새로운 기본 알고리즘을 기반으로 설계되어 잠재적인 거래를 더욱 쉽게 식별하고 확인할 수 있습니다. 8개의
BTMM State Engine Pro MT4
Garry James Goodchild
BTMM State Engine Pro is a MetaTrader 4 indicator for traders who use the Beat The Market Maker approach: Asian session context, kill zone timing, level progression, peak formation detection, and a multi-pair scanner from a single chart. It combines cycle state logic with a built-in scanner dashboard so you do not need the same tool on many charts at once. What it does Draws the Asian session range; session times can follow broker server offset or be set in inputs. Tracks level progression (L
Advanced Currency Strength28 Indicator
Bernhard Schweigert
4.91 (657)
현재 40% 할인 초보자 또는 전문가 트레이더를 위한 최고의 솔루션! 이 지표는 우리가 독점 기능과 새로운 공식을 통합했기 때문에 독특하고 고품질이며 저렴한 거래 도구입니다. 단 하나의 차트로 28 Forex 쌍의 통화 강도를 읽을 수 있습니다! 새로운 추세 또는 스캘핑 기회의 정확한 트리거 포인트를 정확히 찾아낼 수 있기 때문에 거래가 어떻게 개선될지 상상해 보십시오. 사용 설명서: 여기를 클릭  https://www.mql5.com/en/blogs/post/697384 그것이 첫 번째, 원본입니다! 쓸모없는 지망생 클론을 사지 마십시오. 더 스페셜  강력한 통화 모멘텀을 보여주는 하위 창의 화살표 GAP가 거래를 안내합니다! 기본 또는 호가 통화가 과매도/과매도 영역(외부 시장 피보나치 수준)에 있을 때 개별 차트의 기본 창에 경고 표시가 나타납니다. 통화 강도가 외부 범위에서 떨어질 때 풀백/반전 경고. 교차 패턴의 특별 경고 추세를 빠르게 볼 수 있는 다중 시간
Currency Strength Wizard
Oleg Rodin
4.85 (59)
통화 강도 마법사는 성공적인 거래를 위한 올인원 솔루션을 제공하는 매우 강력한 지표입니다. 표시기는 여러 시간 프레임의 모든 통화 데이터를 사용하여 이 또는 해당 외환 쌍의 힘을 계산합니다. 이 데이터는 특정 통화의 힘을 확인하는 데 사용할 수 있는 사용하기 쉬운 통화 지수 및 통화 전력선의 형태로 표시됩니다. 필요한 것은 거래하려는 차트에 표시기를 부착하는 것뿐입니다. 표시기는 거래하는 통화의 실제 강세를 보여줍니다. 지표는 또한 추세와 거래할 때 유리하게 사용할 수 있는 구매 및 판매 거래량 압력의 극한값을 보여줍니다. 지표는 또한 피보나치에 기반한 가능한 대상을 보여줍니다. 표시기는 PUSH 알림을 포함한 모든 유형의 알림을 제공합니다. 구매 후 연락주세요. 나는 당신과 거래 팁을 공유하고 당신에게 무료로 훌륭한 보너스 지표를 줄 것입니다! 나는 당신에게 행복하고 유익한 거래를 기원합니다!
Advanced Supply Demand
Bernhard Schweigert
4.91 (299)
현재 40% 할인! 초보자나 전문 트레이더를 위한 최고의 솔루션! 이 보조지표는 우리가 다수의 독창적 기능과 새로운 공식을 통합한 독특하고 고품질이며 저렴한 거래 도구입니다. 이 업데이트를 통해 이중 시간대를 표시할 수 있습니다. 더 높은 TF를 표시할 수 있을 뿐만 아니라 차트 TF와 더 높은 TF 모두를 표시할 수 있습니다: 중첩 영역 표시. 모든 Supply Demand 트레이더들이 좋아할 것입니다. :) 중요한 정보 공개 Advanced Supply Demand의 잠재력을 극대화하려면 다음을 방문하십시오. https://www.mql5.com/ko/blogs/post/720245   진입 또는 목표의 명확한 트리거 포인트를 정확히 찾아냄으로 해서 거래가 어떻게 개선될지 상상해 보십시오. 새로운 알고리즘을 기반으로 매수자와 매도자 간의 잠재적인 불균형을 훨씬 더 쉽게 분간할 수 있습니다. 왜냐하면 가장 강한 공급영역과 가장 강한 수요 영역과 과거에 어떻게 진행 되었는지를(이전
- Real price is 80$ - 40% Discount (It is 49$ now) Contact me for instruction, add group and any questions! - Non-repaint - I just sell my products in Elif Kaya profile, any other websites are stolen old versions, So no any new updates or support. - Lifetime update free Related product:   Bitcoin Expert Introduction The breakout and retest strategy is traded support and resistance levels. it involves price breaking through a previous level.  The break and retest strategy is designed to help tr
GOLD Impulse with Alert
Bernhard Schweigert
4.67 (12)
이 지표는 Advanced Currency IMPULSE with ALERT  +   Currency Strength Exotics  의 2가지 제품의 슈퍼 조합입니다. 그것은 모든 시간 프레임에 대해 작동하며 8개의 주요 통화와 하나의 기호에 대한 강약의 충동을 그래픽으로 보여줍니다! 이 표시기는 금, 이국적인 쌍, 상품, 지수 또는 선물과 같은 기호에 대한 통화 강도 가속을 표시하는 데 특화되어 있습니다. 금, 은, 오일, DAX, US30, MXN, TRY, CNH 등의 진정한 통화 강도 가속(충동 또는 속도)을 표시하기 위해 9번째 줄에 모든 기호를 추가할 수 있습니다. 새로운 기본 알고리즘을 기반으로 구축되어 잠재적인 거래를 훨씬 더 쉽게 식별하고 확인할 수 있습니다. 이는 통화의 강세 또는 약세가 가속되는지 여부를 그래픽으로 표시하고 가속 속도를 측정하기 때문입니다. 자동차의 속도계처럼 생각하면 됩니다. 가속화할 때 Forex 시장에서 동일한 일이 분명히 더 빠르
Cycle Sniper
Elmira Memish
4.39 (36)
Please contact us after your purchase and we will send you the complimentary indicators to complete the system Cycle Sniper is not a holy grail but when you use it in a system which is explained in the videos, you will feel the difference. If you are not willing to focus on the charts designed with Cycle Sniper and other free tools we provide, we recommend not buying this indicator. We recommend watching the videos about the indiactor and system before purchasing. Videos, settings  and descri
Auto Optimized Parabolic RSI: 고급 3D 모멘텀 엔진 대부분의 개인 투자자용 보조지표는 시장의 변동성이 변하는 순간 무용지물이 되는 정적인 입력값에 의존하기 때문에 실패합니다. Auto Optimized Parabolic RSI는 자체적인 수학적 우위를 지속적으로 재계산하여 "보조지표 노후화" 문제를 해결하며, 기관급 퀀트 트레이딩의 적응력을 귀하의 MT5 터미널에 직접 제공합니다. 핵심 이점: 맞춤형 인메모리 3D 최적화   표준 자동 최적화 도구들은 일반적인 보조지표 호출로 터미널에 과부하를 일으켜 MT5 플랫폼을 멈추게 하는 경우가 많습니다. 이 도구는 이러한 병목 현상을 완전히 우회합니다. 맞춤형 네이티브 RAM 기반 계산기로 구축된 내부 엔진은 차트를 로드하거나 타임프레임을 변경할 때마다 빛처럼 빠른 3D 그리드 검색을 실행합니다. RSI 기간(주기), SAR 스텝(가속도) 및 SAR 최대치(속도 제한)를 동시에 스캔하여 플랫폼 지연 없이 수만 개의
Market Structure Order Block Dashboard MT4 는 차트에서 시장 구조와 주요 가격 반응 영역을 직접 읽으려는 트레이더를 위해 설계된 MetaTrader 4 지표입니다. BOS, ChoCH, Order Blocks, Fair Value Gaps (FVG), 유동성, Kill Zones, Volume Profile 및 빠른 분석을 위한 컴팩트한 대시보드를 결합합니다. 이 지표는 시장 구조, ICT 및 Smart Money 개념을 의사 결정 프레임워크로 사용하는 트레이더를 대상으로 합니다. 추세 연속성, 가능한 반전, 가격 불균형, 유동성 목표 및 관심 영역을 보다 구조화된 방식으로 식별하는 데 도움이 됩니다. 구매자에게 제공되는 리소스 구매 후 MQL5 비공개 메시지로 간단히 요청하여 완전한 PDF 사용자 가이드 및 매개변수 설정 팁을 받을 수 있습니다. MQL5 비공개 메시지를 통한 직접 기술 지원. 이 MT4 버전은 MT5 버전 1.20의 모든 기능을
Volatility Trend System - a trading system that gives signals for entries. The volatility system gives linear and point signals in the direction of the trend, as well as signals to exit it, without redrawing and delays. The trend indicator monitors the direction of the medium-term trend, shows the direction and its change. The signal indicator is based on changes in volatility and shows market entries. The indicator is equipped with several types of alerts. Can be applied to various trading ins
Linear Trend Predictor - 진입 지점과 방향성 지원선을 결합한 추세 지표입니다. 고가/저가 채널을 돌파하는 원칙에 따라 작동합니다. 지표 알고리즘은 시장 노이즈를 걸러내고 변동성과 시장 역학을 고려합니다. 표시기 기능  평활화 방법을 사용하여 시장 추세와 BUY 또는 SELL 주문을 시작하기 위한 진입 시점을 보여줍니다.  모든 기간의 차트를 분석하여 단기 및 장기 시장 움직임을 파악하는 데 적합합니다.  어떠한 시장과 시간대에도 적용할 수 있으며, 입력 매개변수를 통해 거래자는 자신에게 맞게 지표를 독립적으로 사용자 지정할 수 있습니다.  설정된 지표 신호는 사라지거나 다시 그려지지 않습니다. 이는 캔들 마감 시 결정됩니다.  여러 유형의 알림이 화살표와 결합되어 있습니다.  이 지표는 독립적인 거래 시스템으로 사용할 수도 있고, 다른 거래 시스템에 추가하는 용도로도 사용할 수 있습니다.  모든 수준의 경험을 가진 거래자가 사용할 수 있습니다. 주요 매
Trend indicator AI
Ramil Minniakhmetov
4.53 (83)
트렌드 인공 지능 지표는 실행 가능한 진입 점 및 반전 경고와 추세 식별을 결합하여 상인의 시장 분석을 향상시킬 훌륭한 도구입니다. 이 표시기는 사용자가 자신감과 정밀도로 외환 시장의 복잡성을 탐색 할 수 있도록 지원합니다 기본 신호 외에도 트렌드 인공 지능 지표는 풀백 또는 되돌림 중에 발생하는 2 차 진입 점을 식별하여 거래자가 기존 트렌드 내에서 가격 수정을 활용할 수 있도록합니다. 중요한 장점: ·작동 4 및 5 *명확한 구매 또는 판매 신호 *다시 칠하지 않습니다 *모든 자산에서 작동 나는 전보 사기에 개 또는 세트를 판매하지 않도록주의. 모든 설정은 블로그에 여기에 무료.  중요! 지침 및 보너스를 얻기 위해 구입 후 즉시 저에게 연락! 진짜 가동 감시는 뿐 아니라 나의 다른 제품 여기에서 찾아낼 수 있습니다: https://www.mql5.com/en/users/mechanic/seller&nbsp ; 설정 및 입력: 모든 자산에 대해 기본 설정을 권
MBFX Timing
Mohamed Hassan
5 (3)
After purchase, contact me in private to get 7 days of FREE testing with EA Forex Proton where the robot automatically takes the trade alerts from MBFX Timing! MBFX Timing is an indicator that was developed and created by Mostafa Belkhayate, one of the best traders in the world. We decided to create a modified version that takes inspiration from the Stochastic Oscillator and the Relative Strength Quality Index indicators to improve your trading.  One of the main reasons we released MBFX Timing
Easy Reversal
Mohamed Hassan
Easy Reversal is designed to help traders spot turning points in the market with clear buy and sell signals. The indicator is based on the Keltner Channel but improved with a custom calculation that uses ATR and EMA confirmation. This makes it more reliable and less noisy than standard reversal tools.  The signals from Easy Reversal appear directly from peak candlestick behavior, showing you when price action is reaching exhaustion. A buy signal is generated when a candlestick forms a strong r
제작자의 제품 더 보기
" Dynamic Scalper System MT5 " 지표는 추세 파동 내에서 스캘핑 방식으로 거래하도록 설계되었습니다. 주요 통화쌍 및 금에서 테스트되었으며, 다른 거래 상품과의 호환성이 가능합니다. 추가적인 가격 변동 지원을 통해 추세에 따라 단기 포지션 진입 신호를 제공합니다. 지표의 원리 큰 화살표는 추세 방향을 결정합니다. 작은 화살표 형태의 스캘핑 신호를 생성하는 알고리즘은 추세 파동 내에서 작동합니다. 빨간색 화살표는 상승 방향을, 파란색 화살표는 하락 방향을 나타냅니다. 민감한 가격 변동선은 추세 방향으로 그려지며, 작은 화살표의 신호와 함께 작용합니다. 신호는 다음과 같이 작동합니다. 적절한 시점에 선이 나타나면 진입 신호가 형성되고, 선이 있는 동안 미결제 포지션을 유지하며, 완료되면 거래를 종료합니다. 권장되는 작업 시간대는 M1~H4입니다. 화살표는 현재 캔들에 형성되며, 다음 캔들이 이미 시작되었더라도 이전 캔들의 화살표는 다시 그려지지 않습니다. 입
Volatility Trend System - a trading system that gives signals for entries. The volatility system gives linear and point signals in the direction of the trend, as well as signals to exit it, without redrawing and delays. The trend indicator monitors the direction of the medium-term trend, shows the direction and its change. The signal indicator is based on changes in volatility and shows market entries. The indicator is equipped with several types of alerts. Can be applied to various trading ins
Route Lines Prices MT5  - 는 잠재적인 거래 신호를 찾는 데 사용되는 지표입니다. 간단한 인터페이스에는 다양한 가격 움직임 알고리즘과 신호 종점 감지, 완료된 궤적 계산 기능이 포함되어 있습니다. 알고리즘에는 사용된 시간대에 따라 변동성 및 가격 평활화 계산이 포함됩니다. 이 지표는 " Calculating price values "이라는 기본 매개변수를 통해 값을 변경할 수 있습니다. 기본값인 1은 균형 잡힌 자동 계산 형태를 제공하며, 별도의 설정 없이 바로 사용할 수 있습니다. 2에서 500 사이의 값을 수동으로 변경하여 자신만의 거래 시스템에 맞게 지표를 조정할 수 있습니다. 이 지표에는 빠른 이동평균선과 느린 이동평균선의 교차점으로 표시되는 시장 방향 지표가 내장되어 있으며, 추세를 직접 설정할 때는 이 기능을 비활성화할 수 있습니다. 이 지표는 M1부터 H4까지의 시간대에서 사용을 권장하며, 모든 거래 상품에 적용 가능합니다. 신호 화살표는 캔들 종
Cyclic Impulse
Vitalyi Belyh
차트를 구조화하고 주기적인 가격 변동을 식별하는 기술 지표입니다. 모든 차트에서 작업할 수 있습니다. 다양한 유형의 알림. 그래프 자체에도 추가 화살표가 있습니다. 역사를 재구성하지 않고, 촛불을 닫는 작업에 임한다. M5 이상에서 권장되는 TF입니다. 사용 및 구성이 쉬운 매개변수입니다. 매개변수가 다른 2개의 지표를 사용하는 경우, 다른 지표 없이 해당 지표만 사용할 수 있습니다. 2개의 입력 매개변수가 있습니다 주기성과 신호 지속 시간 이 2개의 매개변수는 차트 구조의 처리와 관련이 있습니다. Cyclicity - 역전 주기가 얼마나 자주 바뀌는지 조절하고 주기를 매끄럽게 합니다. Signal duration - 최소 숫자에서는 가격 움직임의 충격을 감지하고, 최대 숫자에서는 장기적 추세 움직임을 감지합니다.. --------------------------------
Volatility Trend System - a trading system that gives signals for entries. The volatility system gives linear and point signals in the direction of the trend, as well as signals to exit it, without redrawing and delays. The trend indicator monitors the direction of the medium-term trend, shows the direction and its change. The signal indicator is based on changes in volatility and shows market entries. The indicator is equipped with several types of alerts. Can be applied to various trading ins
Scalping Lines System MT5 - 은 M1-H1 시간 프레임에서 금(XAUUSD) 자산을 거래하기 위해 특별히 설계된 스캘핑 트레이딩 시스템입니다. 추세, 변동성, 과매수/과매도 시장 분석 지표를 하나의 오실레이터로 통합하여 단기 신호를 식별합니다. 신호선의 주요 내부 매개변수는 사전 설정되어 있습니다. "Trend Wave Duration"은 이동평균선 추세를 사용하여 추세 방향으로 일련의 신호 지속 시간을 조절하고, "Apply Smoothing to Signal Line"은 신호선 생성 방식을 조정하는 매개변수로, 수동으로 조정할 수 있습니다. 시가에서 신호선을 계산할 때는 차트가 다시 그려지지 않습니다. 다른 가격대에서는 신호 화살표가 깜빡일 수 있습니다. 신호는 캔들 마감 후에 나타나며, 다양한 알림 유형을 사용할 수 있습니다. 권장 시간 프레임: M1, M5, M15, M30, H1. 이 지표는 원래 금 거래를 위해 설계되었지만, 스프레드가 낮은 변
Point Directions MT5 – 가격 변동 중 포인트 지지선과 저항선을 표시하는 지표입니다. 화살표는 지정된 방향으로 가격이 반등할 때를 나타냅니다. 화살표는 다시 그려지지 않으며 현재 캔들을 기준으로 형성됩니다. 모든 시간대와 거래 상품에서 작동합니다. 여러 유형의 알림을 사용할 수 있습니다. 모든 차트에 대한 신호를 사용자 정의할 수 있는 고급 설정이 있으며, 추세 및 조정 거래에 맞게 구성할 수 있습니다. 화살표를 표시하려면 두 가지 유형의 이동 평균선과 화살표 강도 수준을 사용할 수 있습니다. 자세한 설정은 입력 매개변수에 설명되어 있습니다. 사용 관련 문의는 비공개 메시지를 보내주세요. 입력 매개변수 Method MA – 화살표 생성에 이동 평균을 사용할지 선택합니다(표준 또는 가속). Accelerated MA period/Standard MA period – 이동 평균 기간(5~500)을 변경합니다. Ma Metod – 이동 평균 방식을 변경합니다. Ma
Wave Reversal Indicator
Vitalyi Belyh
4 (2)
Wave Reversal Indicator - determines the direction of trend waves and price reversals. The indicator shows wave movements and trend directions. It gives recommendations where to follow the trader, helps to follow the trading strategy. It is an addition to an intraday or medium-term strategy. Almost all parameters are selected for each time frame and are changed automatically, the only parameter for manual adjustment is the wavelength. Works on various trading instruments and timeframes, recomme
FREE
Developed methods for trading collected in one indicator. In the form of arrows, it defines entries in the direction of the trend. It has 2 types of arrows - trend and signal guides, informing about the potential movement in the direction of the trend. Works without redrawing, ready for use on all symbols/tools. The most suitable time frames to use are M15, M30, H1, H4. How to use The indicator finds the direction of the trend in the form of a signal arrow, a graphic rectangle stretches along
Scalping Entry Points - is a manual trading system that can adjust to price movements and give signals to open trades without redrawing. The indicator determines the direction of the trend by the central level of support and resistance. The dot indicator provides signals for entries and exits.  Suitable for manual intraday trading, scalping and binary options. Works on all time frames and trading instruments. The indicator gives several types of alerts. How to use the product The blue line det
Cyclic Impulse MT5 — 이 기술 지표는 차트 구조를 분석하여 주기적인 가격 움직임을 식별합니다. 이를 통해 주기적인 가격 움직임의 반전과 진입 신호를 찾을 수 있습니다. 지표 작동 방식 주기적인 하락 움직임이 감지되면 캔들 마감 후 파란색 하락 막대가 생성됩니다. 현재 캔들에서 잠시 깜빡일 수 있으며, 신호는 아직 확정되지 않았습니다. 파란색 화살표는 가격 차트에 중복 표시됩니다. 주기적인 상승 움직임이 감지되면 캔들 마감 후 빨간색 상승 막대가 생성됩니다. 현재 캔들에서 잠시 깜빡일 수 있으며, 신호는 아직 확정되지 않았습니다. 주황색 ​​화살표는 가격 차트에 중복 표시됩니다. 모든 차트, 시간 프레임, 거래 상품에 사용 가능합니다. 다양한 알림 유형을 제공합니다. 가격 차트에 추가 화살표를 표시합니다. 과거 차트에는 다시 그려지지 않으며, 캔들 마감 시에만 작동합니다. 캔들이 마감되더라도 화살표나 막대는 사라지지 않습니다. 사용 및 매개변수 설정이 간편하며,
Angular Trend Lines MT5
Vitalyi Belyh
5 (1)
추세 지표는 금융시장 거래에 사용되는 기술 분석 분야 중 하나입니다. Angular Trend Lines - 추세 방향을 종합적으로 판단하고 진입 신호를 생성합니다. 캔들의 평균 방향을 매끄럽게 하는 것 외에도 또한 추세선의 경사각도 사용합니다. 갠 각도를 구성하는 원리는 경사각의 기초로 사용되었습니다. 기술 분석 지표는 촛대 평활화와 차트 기하학을 결합한 것입니다. 트렌드 라인과 화살표에는 두 가지 유형이 있습니다. 강세 방향의 빨간색 선과 화살표. 약세 방향의 보라색 선과 화살표. 표시기 기능 이 지표는 사용하기 쉽고 매개변수를 구성할 수 있으며, 추세 분석과 주문 개시를 위한 신호 수신에 사용할 수 있습니다. 지표는 다시 그려지지 않고, 화살표는 캔들 마감 시점에 나타납니다. 신호가 발생하면 여러 유형의 알림을 제공합니다. 모든 금융 상품(외환, 암호화폐, 금속, 주식, 지수)에 사용할 수 있습니다. 해당 지표는 모든 시간 범위와 차트에서 작동할 수 있습니다. 이 지표는
Arrow Micro Scalper 는 스캘핑 및 단기 거래용으로 설계된 지표로 모든 차트 및 금융 상품(통화, 암호화폐, 주식, 금속)에 통합되어 있습니다. 그녀는 작업에서 파동 분석과 추세 방향 필터를 사용합니다. M1부터 H4까지의 시간대에 사용하는 것이 좋습니다. 표시기로 작업하는 방법. 표시기에는 설정 변경을 위한 2개의 외부 매개변수가 포함되어 있으며 나머지는 기본적으로 이미 구성되어 있습니다. 큰 화살표는 추세 방향의 변화를 나타내고 파란색 화살표는 하락 추세의 시작을 나타내며 분홍색 화살표는 상승 추세의 시작을 나타냅니다. " Only trending direction " 매개변수는 내부 트렌드를 사용하는 모드를 켜고 끄며 자신만의 트렌드를 사용하거나 트렌드 방향 없이 작업할 수 있는 기회를 제공합니다. 또한 트렌드에서만 트렌드 화살표 및 신호 화살표 표시를 켜거나 끕니다. . 지표의 가장 중요한 개체인 작은 신호 화살표는 "매수" 거래의 경우 분홍색, "매도" 거
" ZigZag on Trend " 지표는 가격 움직임 방향을 파악하는 데 도움이 되는 지표이며, 막대 및 핍 계산기 기능도 제공합니다. 이 지표는 추세 지표, 가격 방향을 추적하는 지그재그로 표현된 추세선, 그리고 추세 방향으로 지나가는 막대 수와 수직선의 핍 수를 계산하는 카운터로 구성됩니다(계산은 막대의 시작점을 기준으로 합니다). 이 지표는 다시 채색되지 않습니다. 편의상 색상이 있는 막대 또는 선으로 표시됩니다. 모든 시간대에서 사용할 수 있지만, M5 이상에서 사용하는 것이 가장 좋습니다. " Period "은 가격 방향을 검색할 막대 수를 결정합니다. 한 방향으로 완만한 추세를 얻기 위해 방향의 길이를 계산합니다. " Diapason "는 추세 방향의 빈도를 조정하며, 주로 다양한 거래 상품의 첫 번째 매개변수를 조정합니다(EURUSD의 경우 최대 10개, GOLD의 경우 최대 100개). 핍 카운터는 모든 시간대 및 거래 상품에 대한 조정을 지원합니다. 주요 지표
Arrow indicator with trend filter. Generates trend input without delays or delays - on the emerging candle. Suitable for use on any trading tools and timeframes. Easy to use, contains the direction of the trend in the form of a histogram lines and signal generator. Input parameters Period Trend Line - Period of the Histogram Line Signal Generator Period - If the period is longer, then the arrows are less Play sound Display pop-up message Send push notification Send email Sound file signal - Fi
Channel Cluster
Vitalyi Belyh
5 (1)
Cluster indicator working in the price channel. For operation, the indicator builds a channel line - (dashed line). Inside the channel, cluster sections are determined that determine the direction of the price movement - (histograms in two directions), start with large arrows. Small arrows are plotted above / below each histogram - indicator increase volatility. The indicator does not redraw the values. Works on any tools and timeframes. Entrances are made when large arrows appear, inside small
A technical indicator that calculates its readings based on trading volumes. It has an oscillatory line that follows the change in volumes. Large arrows on the line indicate reversal values. A channel is built around the line with small arrows showing the strengthening of price movement in the direction of increasing volumes. The indicator does not redraw values. Works on any instrument and timeframe. It can complement any trading strategy by finding a trend or make entries in the direction of a
This indicator is based on a trend guide line and a special oscillator, defining entry points at the moments of potential price movement. The indicator does not redraw. Works on any instrument. The most preferred time frames to use are M5, M15, M30, H1, H4. The guide trend line of the indicator gives an idea about the movement of the market. When the green line crosses the zero level from top to bottom - the market is bearish when it crosses from bottom to top - bull market. The oscillator is
Max Min Cycle
Vitalyi Belyh
Cyclical indicator for trading and predicting the direction of the market. Shows the cyclical behavior of the price in the form of an oscillator. Gives signals for opening deals when rebounding from the upper and lower boundaries of the oscillator. In the form of a histogram, it shows the smoothed strength of the trend. Will complement any trading strategy, from scalping to intraday. The indicator does not redraw. Suitable for use on all symbols/instruments. Suitable time frames for short-term t
Max Min Reversal Arrows - an arrow reversal indicator for predicting price movement. The indicator is built on the support and resistance levels at the local lows and highs of the price. Product features Arrows appear on the current candle. The indicator does not redraw. Can be used on all time frames and trading instruments. Recommended timeframes to use M30, H1, H4. The dotted lines are the support and resistance levels within the signal. Price movement from these levels means a reversal. Pr
Candle Binary Scalper - is a technical analysis product for forex and binary options. Includes several technical indicators combined into a trading system. Suitable for manual trading within a trend, for scalping and binary options. Works on all time frames and trading instruments. Recommended Timeframes for trading M15, M30, H1 and H4, M5 and M1 should be used in case of high volatility. There are several types of alerts. How to use the product The optimal settings have already been selected
Point Directions
Vitalyi Belyh
5 (1)
Point Directions – 가격 변동 중 포인트 지지선과 저항선을 표시하는 지표입니다. 화살표는 지정된 방향으로 가격이 반등할 때를 나타냅니다. 화살표는 다시 그려지지 않으며 현재 캔들을 기준으로 형성됩니다. 모든 시간대와 거래 상품에서 작동합니다. 여러 유형의 알림을 사용할 수 있습니다. 모든 차트에 대한 신호를 사용자 정의할 수 있는 고급 설정이 있으며, 추세 및 조정 거래에 맞게 구성할 수 있습니다. 화살표를 표시하려면 두 가지 유형의 이동 평균선과 화살표 강도 수준을 사용할 수 있습니다. 자세한 설정은 입력 매개변수에 설명되어 있습니다. 사용 관련 문의는 비공개 메시지를 보내주세요. 입력 매개변수 Method MA – 화살표 생성에 이동 평균을 사용할지 선택합니다(표준 또는 가속). Accelerated MA period/Standard MA period – 이동 평균 기간(5~500)을 변경합니다. Ma Metod – 이동 평균 방식을 변경합니다. Ma Pri
Binary Lines
Vitalyi Belyh
Binary Lines is a technical analysis indicator for currencies, commodities, cryptocurrencies, stocks, indices and any financial instruments. Can be used for binary options or Forex scalping. Shows entry and exit points at fixed intervals and provides traders the necessary information about the results of possible transactions. Entry points are formed at the very beginning of the candle, in the direction of the MA line, duration trades in bars can be adjusted manually and adjusted to any financia
A technical indicator that calculates its readings on trading volumes. In the form of a histogram, it shows the accumulation of the strength of the movement of the trading instrument. It has independent calculation systems for bullish and bearish directions. Works on any trading instruments and time frames. Can complement any trading system. The indicator does not redraw its values, the signals appear on the current candle. It is easy to use and does not load the chart, does not require addition
Line Breakouts
Vitalyi Belyh
Line Breakouts - System for trend trading. Contains a trend identifier that can be adapted to any chart and trading instrument using the period and smoothing function. And a determinant of support and resistance levels. When the price is below the resistance line, open Sell trades, and when the price is above support lines - open Buy transactions. Stop loss should be placed a few points from the lines, Take Profit should be fixed after several candles (3-10-15), based on the time frame. The indi
Point Trend Indicator - An indicator of the upper and lower level of the trend, which can determine the trend direction and indicate its strengthening. The trend direction is determined by round dots; if the points are above the zero line, the trend is bullish; if below, the trend is bearish. The increase in directional movement is indicated by arrows. It has the only parameter for manual adjustment - Duration of the trend direction.   Possibilities Works on all time frames Adapts to any financ
Scalping and Binary Signal Detector - Scalping indicator that gives directional signals for opening positions along the trend. The indicator is a complete trading system that can be used for Forex and binary options. The system of algorithms allows you to recognize intense price movements in several consecutive bars. The indicator provides several types of alerts for arrows. Works on any trading instruments and time frames (M5 or Higher recommended). How to use for trading The appearance of a
Level Breakout Indicator is a technical analysis product that works from upper and lower boundaries, which can determine the direction of the trend. Works on candle 0 without redrawing or delays. In its work, it uses a system of different indicators, the parameters of which have already been configured and combined into a single parameter - “ Scale ”, which performs gradation of periods. The indicator is easy to use, does not require any calculations, using a single parameter you need to select
Indicator Waiting Volatility - an indicator for determining volatility zones and flat conditions. Over time, the price on the chart is in different trends, goes down, goes up, or stays the same. The indicator helps the trader determine which trend the price is in. In its work, it uses several tools for technical analysis; first, the direction of the trend is determined, then, in this direction, the indicator monitors changes in volatility. If the price fluctuates within the noise, it is in track
필터:
massey5782
183
massey5782 2024.08.14 08:47 
 

A very accurate and intelligent indicator. 5 stars!!!

리뷰 답변