Trend Correlation Strength

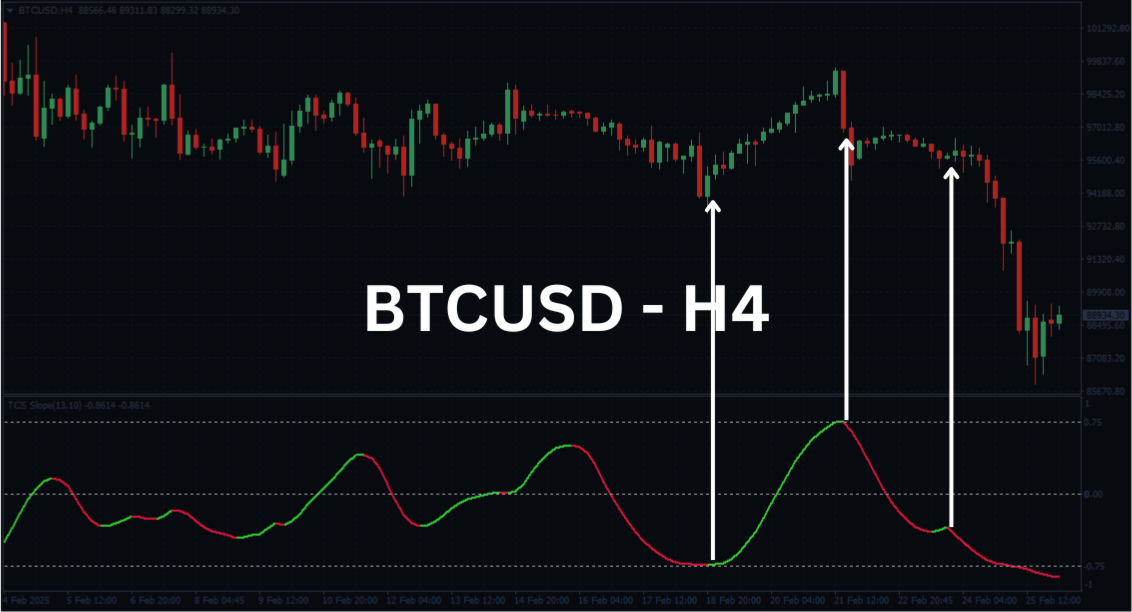
추세 상관 강도 (TCS) 지표: 외환 추세 분석의 우위

추세 상관 강도 (TCS) 지표는 추세 강도를 측정하는 방식을 재정의하는 최첨단 도구로, 평균 방향 지수(ADX)와 같은 기존 지표에 비해 상당한 이점을 제공합니다. 방향성 움직임에 의존하는 ADX와 달리, TCS는 종가와 선형 시계열 간의 상관 관계를 계산하여 추세 강도를 독특하게 정량화합니다. 이 혁신적인 접근 방식은 외환 트레이더에게 강력한 추세를 식별하고 활용하기 위한 매우 정밀한 방법을 제공합니다.

TCS를 선택하는 이유?

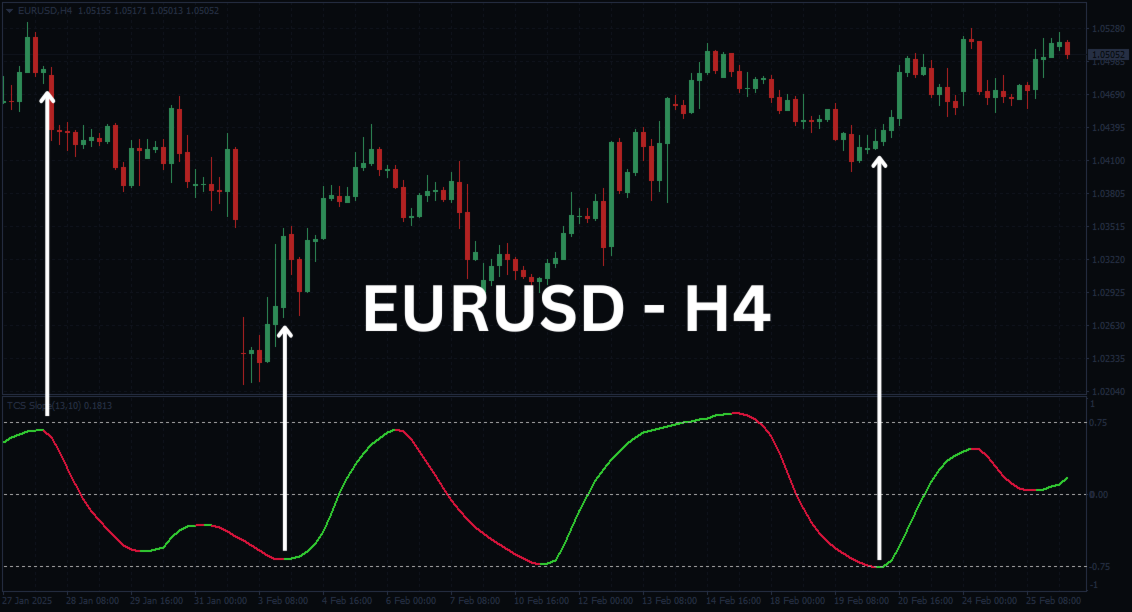
  • 추세를 일찍 포착하고 핍을 극대화하세요: TCS는 단순히 반응하는 것이 아니라 예측합니다. 시간이 지남에 따라 가격이 얼마나 선형적으로 움직이는지 측정하여 놀라운 정확도로 새로운 추세를 식별하는 데 도움이 됩니다. 주간 차트에서 TCS 값이 45 이상으로 상승하는 것은 중요한 시장 움직임이 진행 중이라는 강력한 신호입니다. 기존 전략에 TCS를 통합하여 더 일찍 거래에 진입하고 더 많은 핍을 확보하세요.

  • 깔끔한 단순성: 강력한 도구는 직관적이어야 한다고 생각합니다. TCS는 단일 파란색 선과 명확하고 점선으로 표시된 45 레벨 가이드가 있는 깔끔하고 미니멀한 디자인을 특징으로 합니다. 이 간소화된 인터페이스는 복잡성을 제거하여 방해 없이 추세 강도에만 집중할 수 있도록 하여 모든 경험 수준의 트레이더에게 완벽합니다.

  • 현대 외환 시장을 위해 설계: ADX는 다른 시대에 상품을 위해 개발되었습니다. 그러나 TCS는 오늘날의 역동적인 외환 시장을 위해 특별히 설계되었습니다. 그 계산은 GDP 발표 및 금리 인상과 같은 거시 경제 이벤트의 영향에 본질적으로 맞춰져 있어 거래 결정에 현대적이고 관련성 있는 이점을 제공합니다.

TCS가 진정으로 돋보이는 이유:

  • 고유한 상관 관계 기반 계산: 기존 방식을 뛰어넘으세요. TCS는 기존 지표에서는 단순히 제공하지 않는 추세 강도에 대한 신선한 상관 관계 기반의 관점을 제공합니다.

  • 직관적인 추세 정량화: ADX와 마찬가지로 TCS는 익숙한 0에서 100까지의 척도로 추세 강도를 측정하지만, 시간 경과에 따른 가격과의 보다 통찰력 있는 상관 관계 분석을 통해 이루어집니다.

  • 빠른 추세 감지: 선형 시장 조건에서 TCS는 추세를 신속하게 식별하여 트레이더에게 중요한 경쟁 우위를 제공할 수 있습니다.

  • 범용적으로 사용자 친화적: 명확한 단일 선과 간단한 해석으로 TCS는 추세 분석에서 명확성을 추구하는 초보자 및 숙련된 트레이더 모두에게 이상적인 도구입니다.


추천 제품
Binary Option Signal
Yaroslav Varankin
Indicator for binary options arrow is easy to use and does not require configuration works on all currency pairs, cryptocurrencies buy signal blue up arrow sell signal red down arrow tips do not trade during news and 15-30 minutes before their release, as the market is too volatile and there is a lot of noise it is worth entering trades one or two candles from the current period (recommended for 1 candle) timeframe up to m 15 recommended money management fixed lot or fixed percentage of the depo
True Super Arrows
Muhammed Emin Ugur
True Super Arrows is a powerful and versatile indicator that can help you identify and trade profitable trends. The indicator uses a combination of technical indicators to generate arrows that point to the direction of the trend. Features: Multiple trend identification methods:   The indicator uses a combination of moving averages, trend lines, and other indicators to identify trends. Accurate trend direction:   The indicator uses a variety of techniques to ensure that the arrows are pointing in
Hermes Gold PRO
Igor Pereira Calil
The HERMES specialist is a robot for Meta Trader with the objective of working with the robot's own trends and strategies. GET HERMES GOLD PRO FREE INSTALLED AND OPERATING ON YOUR ACCOUNT, ASK ME PRIVATE MESSAGE. TIMEFRAME USAGE RECOMMENDATION: H1 HERMES was developed to work on the American metal XAUUSD (GOLD). HERMES is a long-term Expert in assertive SCALPING, and so, he can stay 1,2,3 days without trading, depending on the value of his "risk (configuration", but, don't worry about that, re
BBMA Grid Combination
Kahfi Pangariduwan
5 (1)
BBMAGC   BBMAGC  is an automatic trading system with a work strategy obtained from famous BBMA indicator combine with advance grid system . This EA use dangerous trading systems like martingale and grid so please understand the risk before using this EA Time Frame: H1 Symbol: best result on EUR/USD, GBPUSD, GBPCAD VPS recommended 4/5 digit broker Min Deposit 1000$ Low spread always better Since you using Grid system, always trade using money that you are willing to lose. When you use an expert a
Multi MACD
Vladimir Pokora
This tool monitors MACD indicators on all time frames in the selected markets. Displays a table with signals to open a BUY trade (green) or SELL trade (red). You can set the conditions for the signal. You can easily add or delete market names / symbols. If the conditions for opening a trade on multiple time frames are met, you can be notified by e-mail or phone message (according to the settings in MT4 menu Tools - Options…) You can also set the conditions for sending notifications. The list of
BINARYEXPERT 는 정확한 진입 신호를 원하는 바이너리 옵션 트레이더를 위해 설계된 강력한 기술 인디케이터입니다. MetaTrader 4용으로 개발된 이 도구는 EMA, RSI, MACD, Stochastic, ATR 등 여러 기술 지표를 결합하여 신뢰성 높은 CALL 및 PUT 신호를 생성합니다. 직관적인 인터페이스와 실시간 통계 패널을 통해 BINARYEXPERT 는 트레이더가 더 나은 결정을 내릴 수 있도록 지원합니다. 주요 기능 다중 지표 분석: EMA, RSI, MACD, Stochastic, ATR을 조합하여 강력하고 일관된 신호를 생성합니다. 신호 점수 시스템: 여러 조건을 만족하면 점수를 부여하고, 임계점 이상일 때만 신호를 생성합니다. 실시간 통계 패널: 승률, 트렌드 방향, 거래 세션 상태 등을 실시간으로 표시합니다. 사용자 정의 가능한 설정: EMA, RSI, Stochastic, ATR 기간과 점수 임계값을 사용자가 설정할 수 있습니다. 거래 시간 설정
The principle of this indicator is very simple: detecting the trend with Moving Average, then monitoring the return point of graph by using the crossing of Stochastic Oscillator and finally predicting BUY and SELL signal with arrows, alerts and notifications. The parameters are fixed and automatically calculated on each time frame. Example: If you install indicator on EURUSD, timeframe M5: the indicator will detect the main trend with the Moving Average on this timeframe (for example the Moving
Forex Gump
Andrey Kozak
2.4 (5)
Forex Gump is a fully finished semi-automatic trading system. In the form of arrows, signals are displayed on the screen for opening and closing deals. All you need is to follow the instructions of the indicator. When the indicator shows a blue arrow, you need to open a buy order. When the indicator shows a red arrow, you need to open a sell order. Close orders when the indicator draws a yellow cross. In order to get the most effective result, we recommend using the timeframes H1, H4, D1. There
Engulfing Candle Hunter MT4
Odaine Ramon Mcmillan
1 (1)
The Game-Changing Engulfing Candle Hunter - Your Guide to Profitable Trend Trading Step into the realm of trading possibilities with our revolutionary product - The Engulfing Hunter. Designed by traders for traders, this dynamic indicator combines the potency of engulfing candlestick patterns and the versatility of proprietary trend detection system, offering a trading edge unlike any other. Engulfing candlestick patterns have always been a revered tool in the arsenal of seasoned traders. Acting
I developed a special algorithm indicator Indicator EXACTLY-SR-LEVELS looks for confluence of at least two combination  algorithm levels (day+week,day+mont,day+year, week+month, week+year,month+year) LEVELS ARE NOT REDRAWN IF THE NEW HIGH / LOW INDICATOR IS CALCULATING NEW LEVELY AND DRAWS IN THE GRAPH On a new low/high day - the S/R day is recalculed. On a new low/high week - the S/R week is a recalculed On a new low/high month - the S/R month is a recalculed On a new low/high year - the S/R
CRT Pro Scanner MT4
Frank Jose Olivo Flores
CRT Pro Scanner ===============   Stop wasting hours watching multiple charts and missing setups while you blink. CRT Pro Scanner solves the most painful problem every trader faces: being in the wrong chart at the right moment. Instead of jumping between pairs and constantly asking yourself "did I miss something?", the scanner does the watching for you. It monitors all your symbols simultaneously, detects Candle Range Theory setups the instant they form, and alerts you immediately — so you can
H4 Scalping
Teofil Creanga
H4 - Scalping - This indicator has a high earning potential and is created for the H4 timeframe, but can also be used on higher timeframes. - The indicator does not repaint and works on all currency pairs. - With the help of moving averages or other preferred indicators, losses can be minimized. - Trading signals are displayed by white and yellow arrows. - I have noticed that exits of 30 pips with Stop Loss of 30 pips give good results. Or exits at crossings of moving averages 5 and 36 LWM
Riko Trend
Nadiya Mirosh
The Riko Trend indicator is a revolutionary trend trading and filtering solution with all the important features of a trend tool built into one tool! The Riko Trend indicator is good for any trader, suitable for any trader for both forex and binary options. You don’t need to configure anything, everything is perfected by time and experience, it works great during a flat and in a trend. The Riko Trend indicator is a technical analysis tool for financial markets that reflects the current price f
LordAutoFibonnaci
Igor Pereira Calil
5 (2)
Lord Auto Fibonnaci is a free indicator for Meta Trader, in order to show the most famous chart in the financial market known as "Fibonnaci". As we can see in the images below, the fibonnaci table will automatically analyze the graph for you, with trend factors through percentage, almost infallible use, you can always work when the percentage is low or high, start shopping and sales on time, great for analyzing entries! In the images below we can see an example in gold in H4, where we are at
FREE
PipFinite Channel Flow
Karlo Wilson Vendiola
4.67 (3)
Pipfinite creates unique, high quality and affordable trading tools. Our tools may or may not work for you, so we strongly suggest to try the Demo Version for MT4 first. Please test the indicator prior to purchasing to determine if it works for you. We want your good reviews, so hurry up and test it for free...we hope you will find it useful. Combo Channel Flow with Strength Meter Strategy: Increase probability by confirming signals with strength Watch Video: (Click Here) Features Detects chan
Noize Absorption Index MT4
Ekaterina Saltykova
5 (1)
Noize Absorption Index - is the manual trading system that measures the difference of pressure between bears forces and bulls forces. Green line - is a noize free index that showing curent situation. Zero value of index shows totally choppy/flat market.Values above zero level shows how powerfull bullish wave is and values below zero measures bearish forces.Up arrow appears on bearish market when it's ready to reverse, dn arrow appears on weak bullish market, as a result of reverse expectation. S
AI Forecast MT4
Leonardo Antonio Camacaro Armas
The "AI Forecast" indicator is the result of a unique experiment in which I asked an AI how to create the best indicator to anticipate the market. The AI suggested measuring the past history of the price and its reactions to different levels, and then calculating the probabilities of the price reaction in the future. With this idea, I designed with the help of another AI the "AI Forecast" indicator, which adapts to any MetaTrader chart and shows you three lines: one for entry and two for possi
Milch Cow Harmonic EA "Tool designed to trade 28 currency pairs according to 88 harmonic patterns plus one customized according to your parameters The expert graph interface guides you to the pattern names when passing over the pattern circle You can activate or disable any number of currency pairs and patterns for your trade by clicking on the currency pair circle or the harmonic pattern (green = activate    red = disable) You can set more than one time frame within which the expert will look f
Fibo Eagle EA
Almaquio Ferreira De Souza Junior
Fibo Eagle EA for MT4 - Fibonacci-Based Grid Trading Expert Advisor Overview FiboEagleEA is a sophisticated Expert Advisor (EA) designed for traders who want an automated trading system powered by the Fibonacci sequence. This EA integrates grid trading principles with advanced money management tools, delivering a blend of precision, adaptability, and profitability potential. Whether you're new to trading or a seasoned professional, FiboEagleEA adjusts to various market conditions, making it a ve
Strong Volume Trend
Muhammed Emin Ugur
The Strong Volume Trend  MT4 indicator is a powerful tool designed to help traders identify and capitalize on significant volume trends in the financial markets. With its advanced algorithm, this indicator accurately detects the strength and direction of volume movements, allowing traders to make informed trading decisions. Features: Volume Strength Analysis: The indicator analyzes the volume data and identifies strong volume trends, helping traders spot potential market reversals, breakouts, or
Oscillator Trend indicator macd, divergence and a set of algorithms is a trend indicator. The aim of the indicator is to generate signals with high reliability using the above-mentioned calculations. The indicator is very easy to use. Red arrows give sale signal. The Aqua arrows give a buy signal. Thanks to the alert feature, you can easily reach the signals. It works without any setting. It can be used in all time frames. The recommended time frames are m15, m30 and h1. Parameters Trendlines
Boost binary option profesional
Sebastian Alejandro Merino Sepulveda
Binarias & Forex (+90% Ratio-Win Next Candle) Espere que el precio llegue a una buena zona (fuerte) sea soporte, resistencia, zona de oferta o demanda, fibonacci level key, cifra redonda. Haciendo lo anterior definitivamente habrá una reversión en el precio y obtendrá su ITM en primera vela dando una efectividad del 100% siguiendo la tendencia. Es muy importante estar atento a las noticias fundamentales en el mercado y estas no afecten tu trading. Sesiones comerciales: cualquiera (24 horas).
Royal Dutch Skunk
Sayan Vandenhout
ROYAL DUTCH SKUNK USES THE TREND WAVE INDICATOR AND IT CAN IDENTIFY THE BEGINNING AND THE END OF A NEW WAVE TREND MOVEMENT. AS AN OSCILLATOR, THE INDICATOR IDENTIFIES THE OVERBOUGHT AND OVERSOLD ZONES. IT WORKS GREAT TO CATCH THE SHORT TERM PRICE REVERSALS AND USES A MARTINGALE STRATEGY TO CLOSE ALL TRADES IN PROFIT. USE DEFAULT SETTINGS ON H1 OR HIGHER TIME FRAME ON ANY PAIR FOR MORE ACCURATE TRADES WHY THIS EA : Smart entries calculated by 6 great strategies The EA can be run on even a $20000
Binary Fx System
Yaroslav Varankin
This tool was developed and designed for binary options trading It has been noticed that it can also be used in stock markets and forex. There are 2 options for trading binary options using this indicator Option 1 We open a deal on the next candle after a signal for one cut of the current period Buy or Sell depending on the signal The blue up arrow is Buy The red down arrow is Sell / We enter only on the first signal on the next candle and ignore the rest / Option 2 We enter on a signal for the
All Symbols   AND  All Time frames Scan                                                                                                                 Document Introduction   The ABCD is a basic harmonic pattern. The ABCD pattern is a visual, geometric chart pattern comprised of three consecutive price swings. It looks like a diagonal lightning bolt and can indicate an upcoming trading opportu
VR Cub
Vladimir Pastushak
VR Cub 은 고품질 진입점을 얻는 지표입니다. 이 지표는 수학적 계산을 용이하게 하고 포지션 진입점 검색을 단순화하기 위해 개발되었습니다. 지표가 작성된 거래 전략은 수년 동안 그 효율성을 입증해 왔습니다. 거래 전략의 단순성은 초보 거래자라도 성공적으로 거래할 수 있다는 큰 장점입니다. VR Cub은 포지션 개시 지점과 이익 실현 및 손절매 목표 수준을 계산하여 효율성과 사용 편의성을 크게 높입니다. 간단한 거래 규칙을 이해하려면 아래 전략을 사용한 거래 스크린샷을 살펴보세요. 설정, 세트 파일, 데모 버전, 지침, 문제 해결 등은 다음에서 얻을 수 있습니다. [블로그] 다음에서 리뷰를 읽거나 작성할 수 있습니다. [링크] 버전 [MetaTrader 5] 진입점 계산 규칙 포지션 개설 진입점을 계산하려면 VR Cub 도구를 마지막 최고점에서 마지막 최저점까지 늘려야 합니다. 첫 번째 지점이 두 번째 지점보다 빠른 경우, 거래자는 막대가 중간선 위에서 마감될 때까지 기다립니다
Bollinger Squeeze Trend Indicator is a technical analysis tool used in the investment and trading world. This indicator helps identify market trends by analyzing the price movements of assets. The Bollinger Squeeze Trend Indicator uses a variation of Bollinger Bands and focuses specifically on the relationships between volatility and price movements. Essentially, the Bollinger Squeeze Trend indicator is designed to recognize periods of narrowing and widening of bands. This can help identify pe
BB RSI Robot  is made for any level of users: Beginners can use it as it is, Experts can fully customize it. Bollinger Bands and RSI based algorithms for autotrading: it follows  3 Bollinger Bands  and  RSI levels  and places orders with all values computed when the algorithm gives a green flag. Order values use algorithms for risk management per trade and pips calculator. Each placed order is closely followed to be modified if more accurate Take Profit value is computed. BB RSI Robot is fully
Market Structure Zig Zag
Lesedi Oliver Seilane
4.66 (29)
Free Market structure zig zag to assist in price action trading the screenshots describe how to use and how to spot patterns new version comes with alerts, email alert and  push notification alert can be used on all pairs  can be used on all timeframes  you can add additional confirmation indicators the indicator shows you your higher high and low highs as well as your lower lows and lower highs  the indication makes price action analysis easier to spot.
FREE
Pro Trend Tracking   indicator is designed for trend and signal trading. This indicator generates trend signals.  It uses many algorithms and indicators to generate this signal. It tries to generate a signal from the points with the highest trend potential. This indicator is a complete trading product. This indicator does not need any additional indicators.  You can only trade with this indicator. The generated signals are displayed on the graphical screen.  Thanks to the alert features you can
이 제품의 구매자들이 또한 구매함
Neuro Poseidon MT4
Daria Rezueva
4.94 (31)
Neuro Poseidon is a new indicator by Daria Rezueva. It combines precise trading signals with adaptive TP/SL levels - creating best possible trades as a result! Message me and get  Neuro Poseidon Assistant  as a gift to automize your trading process! What makes it stand out? 1. Proven profitability on all assets and timeframes 2. Only confirmed BUY and SELL signals present on the chart 3. Adaptive TP & SL levels generated by the software for each trade 4. Easy to understand - suitable for all
Gann Made Easy
Oleg Rodin
4.84 (164)
Gann Made Easy 는 mr.의 이론을 사용하여 최고의 거래 원칙을 기반으로 하는 전문적이고 사용하기 쉬운 Forex 거래 시스템입니다. W.D. 간. 이 표시기는 Stop Loss 및 Take Profit Levels를 포함하여 정확한 BUY 및 SELL 신호를 제공합니다. PUSH 알림을 사용하여 이동 중에도 거래할 수 있습니다. 구매 후 거래 방법 안내 및 유용한 추가 지표를 무료로 받으시려면 저에게 연락주세요! 아마도 Gann 거래 방법에 대해 이미 여러 번 들었을 것입니다. 일반적으로 Gann의 이론은 초보자 거래자뿐만 아니라 이미 거래 경험이 있는 사람들에게도 매우 복잡한 것입니다. Gann의 거래 방식은 이론적으로 적용하기 쉽지 않기 때문입니다. 나는 그 지식을 연마하고 Forex 지표에 최고의 원칙을 적용하기 위해 몇 년을 보냈습니다. 표시기는 적용하기가 매우 쉽습니다. 차트에 첨부하고 간단한 거래 권장 사항을 따르기만 하면 됩니다. 지표는 지속적으로 시장 분석
Dynamic Forex28 Navigator
Bernhard Schweigert
4.43 (7)
Dynamic Forex28 Navigator - 차세대 외환 거래 도구. 현재 49% 할인. Dynamic Forex28 Navigator는 오랫동안 인기 있는 지표의 진화형으로, 세 가지의 힘을 하나로 결합했습니다. 고급 통화 Strength28 지표(695개 리뷰) + 고급 통화 IMPULSE with ALERT(520개 리뷰) + CS28 콤보 신호(보너스). 지표에 대한 자세한 정보 https://www.mql5.com/en/blogs/post/758844 차세대 Strength 지표는 무엇을 제공합니까?  원래 지표에서 좋아했던 모든 것이 새로운 기능과 더 높은 정확도로 강화되었습니다. 주요 기능: 독점적인 통화 Strength 공식.  모든 시간대에 걸쳐 부드럽고 정확한 강도선. 추세와 정확한 진입을 식별하는 데 이상적입니다. 역동적인 시장 피보나치 수준(시장 피보나치).  이 지표에만 있는 고유한 기능. 가격 차트가 아닌 통화 강도에 피보나치가 적용됩니다.
M1 Sniper
Oleg Rodin
5 (24)
M1 SNIPER 는 사용하기 쉬운 거래 지표 시스템입니다. M1 시간대에 맞춰 설계된 화살표 지표입니다. 이 지표는 M1 시간대 스캘핑을 위한 단독 시스템으로 사용할 수 있으며, 기존 거래 시스템의 일부로도 사용할 수 있습니다. 이 거래 시스템은 M1 시간대 거래용으로 특별히 설계되었지만, 다른 시간대에도 사용할 수 있습니다. 원래는 XAUUSD와 BTCUSD 거래를 위해 이 방법을 설계했지만, 다른 시장 거래에도 유용하다는 것을 알게 되었습니다. 이 지표의 신호는 추세 방향과 반대로 거래될 수 있습니다. 저는 지표의 신호를 활용하여 양방향으로 거래할 수 있도록 돕는 특별한 거래 기법을 알려드립니다. 이 방법은 특별한 동적 지지선과 저항선 가격 영역을 활용하는 것을 기반으로 합니다. 구매하시면 M1 SNIPER 화살표 지표를 바로 다운로드하실 수 있습니다. 또한, 아래 스크린샷에 표시된 Apollo Dynamic SR 지표는 M1 SNIPER 도구를 사용하는 모든 사용자에게 무료로
Scalper Inside PRO
Alexey Minkov
4.74 (68)
Scalper Inside PRO Scalper Inside PRO is an intraday trend and scalping indicator for MetaTrader 4 that uses an exclusive algorithm to quickly detect market direction and key target levels. It automatically calculates entry, exit and multiple profit targets, and shows detailed performance statistics so you can see how different instruments and strategies performed. This helps you choose the most suitable trading instruments for the current market conditions. Additionally, you can easily integrat
Enigmera
Ivan Stefanov
5 (8)
ENIGMERA: 시장의 핵심 중요: MQL5.com의 데모는 Strategy Tester에서 실행되며 Enigmera의 기능을 완전히 반영하지 못할 수 있습니다. 설명, 스크린샷 및 비디오를 확인하여 자세한 내용을 확인하십시오. 질문이 있으면 언제든지 메시지를 보내주세요! 인디케이터의 코드는 완전히 다시 작성되었습니다. 버전 3.0은 새로운 기능을 추가하고 인디케이터가 처음 출시된 이후 누적된 버그를 수정했습니다. 소개 이 인디케이터 및 거래 시스템은 금융 시장에 대한 주목할 만한 접근 방식입니다. ENIGMERA는 프랙탈 주기를 사용하여 정확하게 지원 및 저항 수준을 계산합니다. 실제 축적 단계를 보여주고 방향과 목표를 제공합니다. 트렌드와 수정 모두에서 작동하는 시스템입니다. 작동 방식 인디케이터의 대부분의 기능은 차트 왼쪽에 있는 버튼을 통해 제어되며, 이를 통해 다양한 시장 상황에 빠르게 대응할 수 있습니다. 버튼 ON/OFF – 인디케이터 전체를 표시하거나 숨깁니다.
KT Alpha Hunter Arrows MT4
KEENBASE SOFTWARE SOLUTIONS
대부분의 화살표 지표는 신호만 보여주고, 나머지 판단은 모두 트레이더에게 맡깁니다. KT Alpha Hunter Arrows는 완성된 트레이딩 플랜을 함께 제공합니다. 각 신호 화살표가 표시될 때마다 차트에는 진입 라인, 손절선, 네 개의 익절 목표, 그리고 현재 종목과 시간대가 지금 거래할 만한 가치가 있는지 알려주는 실시간 엣지 판정이 함께 그려집니다. 포함된 Trade Manager EA는 사용자가 수동으로 진입한 이후의 실행 관리를 맡아, 시장이 흔들리고 감정이 개입되기 쉬운 순간에도 거래 원칙을 유지할 수 있도록 돕습니다. 리페인트 없음. 확정된 캔들 기준 신호만 표시. Forex, 골드, 지수, 그리고 사용자가 거래하는 모든 상품을 위해 설계되었습니다. 주요 기능 캔들이 마감된 후에만 표시되는 비리페인트 매수 및 매도 화살표. 각 신호마다 진입 라인, 구조적 손절선, 네 개의 익절 목표 제공. Edge Dashboard가 현재 차트의 매수와 매도 셋업을 별도로 평가. 판
Neo Wave PRO
Nikolay Raykov
5 (1)
Price & Time Market Structure Indicator A professional market structure tool that analyzes waves through both price and time — not price alone. Main Description NeoWave PRO is a professional market structure indicator for MetaTrader 4 designed for traders who want to move beyond traditional one-dimensional wave tools such as ZigZag, swing indicators, and basic high/low systems. Most wave indicators analyze only one thing: Price. But a real market wave is not only a price movement. A true wave de
PRO Renko System
Oleg Rodin
5 (30)
PRO Renko System 은 RENKO 차트 거래를 위해 특별히 고안된 매우 정확한 거래 시스템입니다. 이것은 다양한 거래 상품에 적용될 수있는 보편적 인 시스템입니다. 체계는 효과적으로 당신에게 정확한 반전 신호에 접근을 주는 소위 시장 소음을 중화합니다. 이 표시기는 사용하기가 매우 쉽고 신호 생성을 담당하는 매개 변수가 하나만 있습니다. 당신은 쉽게 당신의 선택의 어떤 무역 계기에 공구를 적응시킬 수 있고 renko 막대기의 크기. 나는 항상 당신이 내 소프트웨어로 수익성있게 거래 할 수 있도록 추가 지원을 제공 할 준비가되어 있습니다! 나는 당신에게 행복하고 수익성있는 거래를 기원합니다! 구매 후 저에게 연락하십시오! 내 렌코 차트 생성기를 보내드립니다. 또한 내 개인 권장 사항 및 시스템의 다른 모듈을 무료로 공유 할 것입니다!
Trend Lines PRO
Roman Podpora
5 (1)
트렌드 라인즈 프로       이 지표는 시장이 실제로 어떤 방향으로 전환되는지 파악하는 데 도움이 됩니다. 실제 추세 반전 지점과 주요 시장 참여자들이 다시 진입하는 지점을 보여줍니다. 보시다시피       BOS 라인       복잡한 설정이나 불필요한 노이즈 없이 더 높은 시간대의 추세 변화와 주요 레벨을 확인할 수 있습니다. 신호는 차트에 다시 그려지지 않고 캔들이 마감된 후에도 계속 표시됩니다. VERSION MT 5   -   RFI LEVELS PRO   표시기   와 결합할 때 최대 잠재력을 발휘합니다. 지표가 보여주는 내용: 실제 변화       추세(BOS 라인) 한 번 신호가 나타나면 그 신호는 계속 유효합니다! 이는 신호를 발생시킨 후 변경될 수 있는 리페인팅 방식의 지표와 중요한 차이점입니다. 리페인팅 방식의 지표는 잠재적으로 자금 손실로 이어질 수 있습니다. 이제 더욱 높은 확률과 정확도로 시장에 진입할 수 있습니다. 또한 화살표가 나타난 후 목표가(익절)
Trend Catcher ind
Ramil Minniakhmetov
5 (2)
트렌드 캐처 인디케이터 트렌드 캐처 인디케이터는 개발자가 자체 개발한 맞춤형 적응형 트렌드 분석 지표들을 조합하여 시장 가격 움직임을 분석합니다. 단기적인 노이즈를 제거하고 근본적인 모멘텀 강도, 변동성 확대, 가격 구조 움직임에 집중하여 진정한 시장 방향을 파악합니다. 또한 이동 평균, RSI, 변동성 필터와 같은 맞춤형 지표들을 활용하여 가격을 평활화하고 트렌드를 필터링합니다. 실제 운영 모니터링 및 기타 제품은 다음 링크에서 확인하실 수 있습니다: https://www.mql5.com/en/users/mechanic/seller 텔레그램에서는 EA나 설정 파일을 판매하지 않습니다. 사기이니 주의하세요. 모든 설정 파일은 블로그에서 무료로 제공됩니다. 중요! 구매 후 즉시 연락 주시면 사용 방법 및 보너스를 드립니다!
Genesis Matrix Pro is a professional multi-timeframe trend detection indicator designed to help traders identify high-quality market alignment with clarity and structure. It combines 12 different technical indicators into one visual alignment matrix, allowing traders to quickly see when market conditions are bullish, bearish, or neutral. A signal is generated only when the selected strategies are aligned, helping reduce noise and improve decision-making. PLEASE CONTACT ME AFTER PURCHASE TO GET
Current event:  https://c.mql5.com/1/326/A2SR2025_NoMusic.gif A. A2SR이란 무엇입니까 ?   * 선행 기술 지표입니다(재도장 없음, 지연 없음). -- 안내 : https://www.mql5.com/en/blogs/post/734748/page4#comment_16532516 -- 및 https://www.mql5.com/en/users/yohana/blog A2SR에는 지원(수요) 및 저항(공급) 수준을 결정하는 특별한 기술이 있습니다. 우리가 인터넷에서 본 일반적인 방식과 달리 A2SR은 실제 SR 수준을 결정하는 독창적인 개념을 가지고 있습니다. 원래 기술은 인터넷에서 가져온 것이 아니며 인터넷에 게시된 적도 없습니다. A2SR은 거래 스타일에 따라 SR 수준을 자동으로 선택합니다. 시간 프레임을 변경해도 SR 레벨은 그대로 유지됩니다. 사용하는 시간 프레임에서 실제 SR을 얻지 못하기 때문입니다. A2SR은 거래를
PZ Trend Trading
PZ TRADING SLU
4.8 (5)
Capture every opportunity: your go-to indicator for profitable trend trading Trend Trading is an indicator designed to profit as much as possible from trends taking place in the market, by timing pullbacks and breakouts. It finds trading opportunities by analyzing what the price is doing during established trends. [ Installation Guide | Update Guide | Troubleshooting | FAQ | All Products ] Trade financial markets with confidence and efficiency Profit from established trends without getting whips
Step into the world of Forex trading with confidence, clarity, and precision using   Gold Indicator   a next-generation tool engineered to take your trading performance to the next level. Whether you’re a seasoned professional or just beginning your journey in the currency markets, Gold Indicator equips you with powerful insights and help you trade smarter, not harder. Built on the proven synergy of three advanced indicators, Gold Indicator focuses exclusively on medium and long-term trends eli
이 제품은 2026년 시장에 맞게 업데이트되었으며 최신 MT5 빌드에 최적화되었습니다. 가격 업데이트 안내: Smart Trend Trading System은 현재 $99 에 제공됩니다. 다음 30회 구매 후 가격은 $199 로 인상됩니다. 특별 혜택: Smart Trend Trading System 구매 후 저에게 개인 메시지를 보내시면 Smart Universal EA를 무료 로 받을 수 있으며, Smart Trend 신호를 자동 거래로 전환할 수 있습니다. Smart Trend Trading System은 리페인트 없음, 재그리기 없음, 지연 없음의 완전한 트레이딩 시스템으로, 더 깨끗한 신호, 더 나은 추세 방향, 그리고 더 체계적인 시장 거래 방식을 원하는 트레이더를 위해 제작되었습니다. Online course , manual and download presets . 이 시스템은 추세 감지, 반전 구간, Smart Cloud, 트레일링 스톱 로직, 지지와 저항, 캔들 색
Scalper Vault
Oleg Rodin
5 (37)
Scalper Vault 는 성공적인 스캘핑에 필요한 모든 것을 제공하는 전문 스캘핑 시스템입니다. 이 표시기는 외환 및 바이너리 옵션 거래자가 사용할 수 있는 완전한 거래 시스템입니다. 권장 시간 프레임은 M5입니다. 시스템은 추세 방향으로 정확한 화살표 신호를 제공합니다. 또한 상단 및 하단 신호와 Gann 시장 수준을 제공합니다.  이 시스템은 사용하기가 매우 쉽습니다. 원하는 시장 지역의 화살표만 따라가면 됩니다. 엑시트는 가격이 적정 수준에 도달하거나 시장의 고점 또는 저점 신호가 나타날 때 수행됩니다.  표시기는 PUSH 알림을 포함한 모든 유형의 경고를 제공합니다. 인디케이터 구매 후 연락주세요. 내 개인 거래 권장 사항과 훌륭한 보너스 지표를 무료로 공유합니다! 나는 당신에게 행복하고 유익한 거래를 기원합니다!
PZ Swing Trading
PZ TRADING SLU
5 (3)
Protect against whipsaws: revolutionize your swing trading approach Swing Trading is the first indicator designed to detect swings in the direction of the trend and possible reversal swings. It uses the baseline swing trading approach, widely described in trading literature. The indicator studies several price and time vectors to track the aggregate trend direction and detects situations in which the market is oversold or overbought and ready to correct. [ Installation Guide | Update Guide | Tro
BTMM State Engine Pro MT4
Garry James Goodchild
BTMM State Engine Pro is a MetaTrader 4 indicator for traders who use the Beat The Market Maker approach: Asian session context, kill zone timing, level progression, peak formation detection, and a multi-pair scanner from a single chart. It combines cycle state logic with a built-in scanner dashboard so you do not need the same tool on many charts at once. What it does Draws the Asian session range; session times can follow broker server offset or be set in inputs. Tracks level progression (L
Dynamic Scalper System
Vitalyi Belyh
5 (1)
" Dynamic Scalper System " 지표는 추세 파동 내에서 스캘핑 방식으로 거래하도록 설계되었습니다. 주요 통화쌍 및 금에서 테스트되었으며, 다른 거래 상품과의 호환성이 가능합니다. 추가적인 가격 변동 지원을 통해 추세에 따라 단기 포지션 진입 신호를 제공합니다. 지표의 원리 큰 화살표는 추세 방향을 결정합니다. 작은 화살표 형태의 스캘핑 신호를 생성하는 알고리즘은 추세 파동 내에서 작동합니다. 빨간색 화살표는 상승 방향을, 파란색 화살표는 하락 방향을 나타냅니다. 민감한 가격 변동선은 추세 방향으로 그려지며, 작은 화살표의 신호와 함께 작용합니다. 신호는 다음과 같이 작동합니다. 적절한 시점에 선이 나타나면 진입 신호가 형성되고, 선이 있는 동안 미결제 포지션을 유지하며, 완료되면 거래를 종료합니다. 권장되는 작업 시간대는 M1~H4입니다. 화살표는 현재 캔들에 형성되며, 다음 캔들이 이미 시작되었더라도 이전 캔들의 화살표는 다시 그려지지 않습니다. 입력 매개
MonsterDash Harmonic Indicator
Paul Geirnaerdt
4.54 (26)
MonsterDash Harmonic Indicator is a harmonic pattern dashboard. It recognizes all major patterns. MonsterDash is a dashboard that displays all detected patterns for all symbols and (almost) all timeframes in sortable and scrollable format. Users can add their own user defined patterns . MonsterDash can open and update charts with the pattern found. Settings MonsterDash's default settings are good enough most of the time. Feel free to fine tune them to your needs. The color settings are for thos
Apollo SR Master
Oleg Rodin
5 (2)
Apollo SR Master는 지지/저항 구간에서의 거래를 더욱 쉽고 안정적으로 만들어 주는 특수 기능을 갖춘 지지/저항 지표입니다. 이 지표는 지역 가격의 고점과 저점을 감지하여 시간 지연 없이 실시간으로 지지/저항 구간을 계산합니다. 새롭게 형성된 저항 구간을 확인하기 위해 지표는 해당 저항 구간을 실제 매도 또는 매수 신호로 활용할 수 있음을 나타내는 특수 신호를 표시합니다. 이 경우, 저항 구간의 강도가 높아지고, 따라서 저항 구간에서의 성공적인 거래 가능성도 높아집니다. 이것이 바로 이 지표의 핵심 아이디어입니다. SR 존은 손절매와 이익실현을 더욱 쉽게 할 수 있도록 해줍니다. 신호 방향에 따라 SR 존 위 또는 아래 공간을 손절매로 활용할 수 있습니다. 또한, 반대쪽 SR 존은 잠재적 이익실현 영역으로 활용할 수 있습니다. 또한 Apollo SR Master 지표를 사용하는 모든 사용자에게 "Apollo Price Action System" 지표를 무료로 제공합니다.
지진계 Marketquake Detector. Description in English : https://www.mql5.com/en/market/product/113869?source=Site+Market+Product+Page#description How to use the Seismograph : https://www.mql5.com/en/market/product/113869#!tab=comments&page=2&comment=52806941 Create an EA : https://www.mql5.com/en/market/product/113869#!tab=comments&page=3&comment=52816509 어떤 방식으로 거래하든 유동성이 낮은 시장에 진입하는 것을 피하고 싶을 것입니다.- 지진계는 시장 랠리 전에 시장에 진입할 수 있는 적절한 시기를 도와줄 것입니다. 그러나 바쁠 시장 시간에 진입을 확인했음에도 불구하고 많은 사람들이 유동성이 부족한 시
Advanced Currency Strength28 Indicator
Bernhard Schweigert
4.91 (657)
현재 40% 할인 초보자 또는 전문가 트레이더를 위한 최고의 솔루션! 이 지표는 우리가 독점 기능과 새로운 공식을 통합했기 때문에 독특하고 고품질이며 저렴한 거래 도구입니다. 단 하나의 차트로 28 Forex 쌍의 통화 강도를 읽을 수 있습니다! 새로운 추세 또는 스캘핑 기회의 정확한 트리거 포인트를 정확히 찾아낼 수 있기 때문에 거래가 어떻게 개선될지 상상해 보십시오. 사용 설명서: 여기를 클릭  https://www.mql5.com/en/blogs/post/697384 그것이 첫 번째, 원본입니다! 쓸모없는 지망생 클론을 사지 마십시오. 더 스페셜  강력한 통화 모멘텀을 보여주는 하위 창의 화살표 GAP가 거래를 안내합니다! 기본 또는 호가 통화가 과매도/과매도 영역(외부 시장 피보나치 수준)에 있을 때 개별 차트의 기본 창에 경고 표시가 나타납니다. 통화 강도가 외부 범위에서 떨어질 때 풀백/반전 경고. 교차 패턴의 특별 경고 추세를 빠르게 볼 수 있는 다중 시간
Auto Optimized Parabolic RSI: 고급 3D 모멘텀 엔진 대부분의 개인 투자자용 보조지표는 시장의 변동성이 변하는 순간 무용지물이 되는 정적인 입력값에 의존하기 때문에 실패합니다. Auto Optimized Parabolic RSI는 자체적인 수학적 우위를 지속적으로 재계산하여 "보조지표 노후화" 문제를 해결하며, 기관급 퀀트 트레이딩의 적응력을 귀하의 MT5 터미널에 직접 제공합니다. 핵심 이점: 맞춤형 인메모리 3D 최적화   표준 자동 최적화 도구들은 일반적인 보조지표 호출로 터미널에 과부하를 일으켜 MT5 플랫폼을 멈추게 하는 경우가 많습니다. 이 도구는 이러한 병목 현상을 완전히 우회합니다. 맞춤형 네이티브 RAM 기반 계산기로 구축된 내부 엔진은 차트를 로드하거나 타임프레임을 변경할 때마다 빛처럼 빠른 3D 그리드 검색을 실행합니다. RSI 기간(주기), SAR 스텝(가속도) 및 SAR 최대치(속도 제한)를 동시에 스캔하여 플랫폼 지연 없이 수만 개의
Advanced Supply Demand
Bernhard Schweigert
4.91 (300)
현재 40% 할인! 초보자나 전문 트레이더를 위한 최고의 솔루션! 이 보조지표는 우리가 다수의 독창적 기능과 새로운 공식을 통합한 독특하고 고품질이며 저렴한 거래 도구입니다. 이 업데이트를 통해 이중 시간대를 표시할 수 있습니다. 더 높은 TF를 표시할 수 있을 뿐만 아니라 차트 TF와 더 높은 TF 모두를 표시할 수 있습니다: 중첩 영역 표시. 모든 Supply Demand 트레이더들이 좋아할 것입니다. :) 중요한 정보 공개 Advanced Supply Demand의 잠재력을 극대화하려면 다음을 방문하십시오. https://www.mql5.com/ko/blogs/post/720245   진입 또는 목표의 명확한 트리거 포인트를 정확히 찾아냄으로 해서 거래가 어떻게 개선될지 상상해 보십시오. 새로운 알고리즘을 기반으로 매수자와 매도자 간의 잠재적인 불균형을 훨씬 더 쉽게 분간할 수 있습니다. 왜냐하면 가장 강한 공급영역과 가장 강한 수요 영역과 과거에 어떻게 진행 되었는지를(이전
이 인디케이터는 엘리어트 파동 이론과 두 가지 방식으로 작동합니다: 자동 작동: 이 모드에서는 인디케이터가 엘리어트 파동 이론에 따라 차트 상의 모든 5개의 모티브 웨이브를 자동으로 감지하고 예측 및 잠재적인 반전 지역을 제공합니다. 또한 중요한 개발 사항을 트레이더에게 알릴 수 있는 경보 및 푸시 메시지를 생성할 수 있는 능력을 갖추고 있습니다. 이 자동 기능은 엘리어트 파동 패턴의 식별과 분석 프로세스를 간소화합니다. 수동 작동: 이 옵션은 엘리어트 파동 이론을 수동으로 다루고 싶은 트레이더를 위해 설계되었습니다. 이를 통해 사용자는 아홉 가지 다른 등급을 사용하여 웨이브를 그릴 수 있습니다. 각 등급은 나타난 후에 차트에 그려진 라인을 조정하여 개별적으로 정의할 수 있습니다. 이 기능은 웨이브를 수동으로 그리는 프로세스를 간소화하며 더 효율적으로 만들어 줍니다. 중요한 점으로 모든 그림 데이터가 미래 참조를 위해 플랫폼 데이터 폴더에 저장된다는 것을 기억해야 합니다. 파라미터:
Introduction to Fractal Pattern Scanner Fractal Indicator refers to the technical indicator that makes use of the fractal geometry found in the financial market. Fractal Pattern Scanner is the advanced Fractal Indicator that brings the latest trading technology after the extensive research and development work in the fractal geometry in the financial market. The most important feature in Fractal Pattern Scanner is the ability to measure the turning point probability as well as the trend probabi
Bull versus Bear
Mohamed Hassan
4.5 (18)
Send us a message after your purchase to receive more information on how to get your  BONUS  for FREE  that works in great combination with Bull vs Bear ! Bull versus Bear is an easy-to-use Forex indicator that gives traders clear and accurate signals based on clear trend retests . Forget about lagging indicators or staring at charts for hours because  Bull vs Bear provides real-time entries with no lag and no repaint, so you can trade with confidence. Bull vs Bear  helps you enter trades during
The Propfolio Master Suite is the ultimate all-in-one analytical workstation for professional traders. Combining the power of the Beat The Market Maker (BTMM) methodology, Smart Money Concepts (SND/Liquidity), and Advanced Volume Profile, this suite replaces multiple different indicators with one optimized engine. Monitor up to 14 pairs simultaneously from a single chart, instantly identify market cycles, and seamlessly map institutional footprints with the click of a button. The Command Center
제작자의 제품 더 보기
이지 렌코 차트: 이전과는 다른 가격 움직임을 시각화하세요! 진정한 추세를 가리는 시끄러운 캔들스틱 차트에 지쳤나요? 이지 렌코 차트 는 MetaTrader 5 플랫폼에서 시장 움직임에 대한 명확한 통찰력을 얻기 위한 궁극적인 솔루션입니다. 이 강력한 유틸리티는 원시 틱 데이터를 깨끗하고 통찰력 있는 렌코 벽돌로 변환하여, 중요한 가격 변화에 집중하고 시장 노이즈를 필터링할 수 있도록 돕습니다. 이지 렌코 차트 는 활성 차트를 기반으로 사용자 지정 합성 심볼을 생성한 다음, 과거 및 실시간 가격 움직임을 렌코 벽돌로 세심하게 재구성합니다. 시간 기반의 왜곡에 작별을 고하고 보다 순수한 수요와 공급의 표현을 환영하세요! 맞춤형 렌코 분석의 힘을 발휘하세요: 이 직관적인 입력 매개변수를 사용하여 렌코 차트를 거래 스타일에 완벽하게 맞춤 설정하세요: 벽돌 크기 (포인트): 새로운 벽돌을 형성하는 데 필요한 정확한 가격 움직임을 정의합니다. EURUSD와 같은 상품의 경우 1포인트는 0.0
Trading Sessions 3
Guillermo Pineda
4.92 (12)
트레이딩 세션 3: 글로벌 시장 활동 시각화 트레이딩 세션 3 는 주요 일중 거래 세션인 아시아, 런던, 뉴욕 을 명확하게 표시하도록 설계된 직관적인 MQL5 지표입니다. 글로벌 시장 활동을 명확하게 이해하고 전략적인 거래 결정을 위해 변동성 증가 기간을 정확히 파악하십시오. 주요 기능: 글로벌 세션 시각화: 차트에서 아시아, 런던, 뉴욕 세션의 활성 거래 시간을 쉽게 식별할 수 있습니다. 변동성 통찰력: 각 세션 동안 어떤 통화가 일반적으로 가장 중요한 가격 변동을 경험하는지 이해하십시오. 아시아 세션: AUD, NZD 및 JPY 통화 쌍에서 종종 더 높은 변동성을 보입니다. 런던 세션: GBP 및 EUR 통화 쌍의 변동성 증가가 특징입니다. 뉴욕 세션: USD 는 일반적으로 이 세션 동안 가장 변동성이 큰 통화입니다. 사용자 정의 가능한 거래 시간: 유연한 HH:MM 입력 필드를 사용하여 세션 시간을 특정 요구 사항에 맞게 조정하십시오. 선택 가능한 표시 요일: 집중적인 분석을
FREE
All Moving Averages
Guillermo Pineda
ALL MOVING AVERAGES: 다양한 전략을 위한 궁극의 사용자 정의 지표 ALL MOVING AVERAGES 사용자 정의 지표는 31가지가 넘는 가장 인기 있는 이동 평균 을 인상적으로 모아놓은 심층 기술 분석을 위한 필수 도구입니다. 숙련된 트레이더와 초보자 모두를 위해 설계된 이 지표는 비교할 수 없는 유연성을 제공하여 광범위한 거래 전략에 맞게 이동 평균을 완벽하게 조정할 수 있습니다. 기간 및 다양한 가격 계산 유형을 포함한 포괄적인 입력 매개변수 범위를 통해 거래 스타일과 분석 요구 사항에 맞게 지표를 쉽게 조정할 수 있습니다. 주요 기능 및 이점: 광범위한 이동 평균 라이브러리: 고전적인 단순 이동 평균(SMA)부터 Hull 이동 평균 및 제로-지연 지수 이동 평균과 같은 고급 옵션에 이르기까지 31가지가 넘는 방대한 이동 평균 중에서 선택하여 모든 도구를 마음껏 사용할 수 있습니다. 높은 사용자 정의 가능성: 기간을 조정하고 표준 종가, 시가, 고가, 저가 및
FREE
스텝 채널 모멘텀 트렌드 지표 (MT5 Indicator) 스텝 채널 모멘텀 트렌드 는 시장 구조와 동적 변동성 분석을 결합하여 트레이더에게 적응형 이점을 제공하도록 설계된 강력한 모멘텀 기반 지표입니다. 이 도구는 고유한 단계 중간선과 ATR 필터 채널을 사용하여 지연에 의존하지 않으면서 트렌드와 범위를 명확하게 구분하는 데 도움을 줍니다. 주요 기능 구조적 단계 중간선 시스템의 핵심은 확인된 가격 피봇에만 기반한 “단계 Midline”입니다. 새로운 고점이나 저점이 확인될 때만 업데이트하여 불필요한 지연을 제거하고 시장 구조 변화에 즉시 반응합니다. 이 단계적 접근법은 명확한 레지므 전환을 생성하고 가격 현실에 머물게 하여 인디케이터 잡음을 피합니다. 중간선은 최근 강세와 약세 간의 균형을 나타내며 방향, 브레이크 아웃 또는 리트레이스에 대한 신뢰할 수 있는 기준점 역할을 합니다. 동적 변동성 밴드 ATR (Average True Range)을 사용하여 위와 아래 밴드를 작성하여
FREE
MTF Moving Averages
Guillermo Pineda
5 (1)
MTF Moving Averages is an useful indicator that brings you data from fully customizable higher timeframe Moving Averages on your charts, you can add multiple Moving Averages to use even more data of current market conditions. Check the indicator in action [Images below] What MTF Moving Averages does apart from showing higher timeframe MA's? Time saver , having all your higher timeframe MA's in just one chart, time is key, avoid switching between timeframes. Enter Trends precisely, easy to follo
NRP Trend Bars
Guillermo Pineda
NRP Trend Bars Your all-in-one Trend direction indicator, with Presets and Customisable options ! Get the most of Trends with NRP (No-repaint indicator) Trend Bars , designed to get the best of Trend Entries , Continuations and  Reversals One of it's function is the detection of the new trend starting , consolidation and possible trend change . It gives you the opportunity either to get in-&-out of the market in time PRESETS (Sensibility)  LOW :        Used for trend entries and confirming
트렌드 진입 히스토그램: 반전을 정확히 포착하고 진입을 최적화하세요 트렌드 진입 히스토그램 은 트렌드나 가격 움직임이 수명 주기의 끝에 도달하여 곧 반전될 것임을 감지하도록 설계된 강력한 알람 지표입니다. 시장 구조가 변경될 때 시기적절한 경고를 제공하며, 이는 일반적으로 중요한 반전이나 큰 하락이 발생할 가능성이 있을 때 나타납니다. 이 지표는 가능한 소진 지점 주변에 새로운 고점 또는 저점이 형성될 때마다 돌파 및 가격 모멘텀 을 면밀히 모니터링합니다. 현재 트렌드를 기반으로 높은 확률의 거래 설정 을 식별하면, 이 지표는 히스토그램을 그려 이를 시각화합니다. 시장 방향의 잠재적 변화에 대한 중요한 신호는 가격이 그려진 히스토그램 직사각형 위 또는 아래에서 마감될 정도로 약화될 때 발생합니다. 지표가 어떻게 작동하는지 보려면 아래 비디오를 확인하십시오! 주요 기능: 조기 반전 알림: 중요한 소진 시점에 잠재적인 시장 구조 변화에 대해 정확히 알림을 받아 시장에서 변화를 예측하는
VWAP Bands with ML
Guillermo Pineda
VWAP 머신러닝 밴드: 트레이더를 위한 예측 우위 VWAP 머신러닝 밴드로 시장 분석의 다음 단계를 잠금 해제하세요. 이 혁신적인 MQL5 지표는 시장 트렌드, 동적 지지/저항, 그리고 높은 확률의 거래 신호에 대한 비교할 수 없는 통찰력을 제공하도록 설계되었습니다. 거래량 가중 평균 가격(VWAP)의 강력함과 통합된 독점적인 적응형 머신러닝 알고리즘을 활용하는 이 지표는 전통적인 분석을 뛰어넘습니다. 가격 움직임을 예측하고 시장 기회가 완전히 전개되기 전에 이를 포착하는 데 도움을 주어 진정한 예측 우위를 제공하도록 설계되었습니다. VWAP 머신러닝 밴드가 당신의 필수 지표가 될 이유: 지능형 적응형 ML-VWAP 핵심: 진정으로 동적인 VWAP 계산을 경험하세요. 당사의 독점적인 머신러닝 접근 방식은 실시간 변동성과 시장 상황에 따라 스무딩을 자동으로 조정하여 표준 VWAP보다 훨씬 더 반응적이고 정확한 추세 표현을 제공합니다. 독점적인 예측 메커니즘: "Forecast" 매개
Universal Volatility Compass (UVC): 모든 자산에서 자신 있게 시장 사이클을 탐색하세요 1993년 출시 이후, CBOE 변동성 지수(VIX)는 주식 시장의 시장 위험과 투자자 공포를 측정하는 기준이 되었습니다. VIX 수치가 높으면 변동성이 증가했음을 나타내며 종종 시장 바닥과 일치하고, 낮은 수치는 자기 만족감과 시장 최고점을 나타냅니다. 하지만 S&P 500, Nasdaq, Dow 외의 광활한 시장은 어떨까요? 상품, 외환, 암호화폐, 심지어 개별 주식까지 – 트레이더는 이러한 다양한 시장에서 공포를 효과적으로 측정하고 잠재적인 전환점을 식별하는 방법을 어떻게 알 수 있을까요? 래리 윌리엄스의 획기적인 "합성 VIX" 또는 "윌리엄스 VIX 픽스"(WVF)에서 영감을 받은 강력한 맞춤형 MT5 지표인 **Universal Volatility Compass (UVC)**를 소개합니다. 이것은 단순히 또 다른 지표가 아닙니다. VIX의 귀중한 통찰력을 거
Turnaround Tuesday EA – MetaTrader 5용 완전 맞춤형 반전 전략 Advanced Turnaround Strategy EA는 고전적인 "턴어라운드 화요일" 전략에 기반하며, 특정 요일의 강한 방향성 움직임 후 시장이 반전되는 경향을 이용합니다. 특히 월요일의 약세(또는 강세) 이후 화요일에 반전이 자주 발생하는 것으로 관찰됩니다. 기본 전략 논리 (입력값을 통해 완전히 조정 가능): 진입일: 오늘이 월요일인지 확인 (사용자 지정 가능) 종가 비교: 오늘 종가가 N일 전 종가보다 X% 이상 낮거나 높아야 함 (기본값: 금요일보다 1% 낮음) 진입 신호: 조건이 충족되면 종가에 진입 청산일: 화요일 종가에 청산 (사용자 지정 가능), 또는 일정 캔들 수 후 청산 (옵션) 전략 장점: 모든 자산 클래스에서 작동 패턴 기반 검증된 논리 노출을 제한하면서 다양한 보유 기간에 최적화 단순하면서도 효과적 – 개인 및 전문가 트레이더에 적합 테스트된
드로우다운 분포 분석 – 전문 리스크 평가 도구 Drawdown Risk Profiling 지표는 MetaTrader 5에서 포괄적이고 통계적으로 신뢰할 수 있는 리스크 진단을 제공합니다. 트레이더, 자산 관리자, 퀀트 분석가를 위해 설계되었으며, 학문 수준의 방법론을 적용해 거래 리스크를 정확하게 측정, 해석 및 제어합니다. 학문적 기반 다음과 같은 금융 리스크 이론 및 실증 연구에 기반합니다: Markowitz (1952) – 현대 포트폴리오 이론 기초 Sharpe (1966) – 리스크 조정 성과 측정 Chekhlov, Uryasev & Zabarankin (2005) – 드로우다운 최적화 이론 Sortino & Price (1994) – 하방 리스크 프레임워크 Jorion (2007) – VaR(Value at Risk) 방법론 고유 기능 표시: 서브 창에서 평균, 백분위 밴드 또는 둘 다 표시 가능 신호: 설정 가능한 매개변수에 따라 드로우다운 라인을 녹색 또는 빨간색으로
EZ Trends
Guillermo Pineda
EZ Trends 는 실시간으로 시장 구조 변화를 쉽게 식별할 수 있도록 설계된 정밀 트렌드 탐지 지표입니다. 독창적인 EMA–HMA 하이브리드 밴드 시스템을 사용하여 캔들 색상을 자동으로 변경해 추세 방향을 강조하고, 새로운 추세 시작 시 반응 레벨을 표시합니다. 그 결과, 트레이더가 모멘텀에 맞추어 시장 잡음을 걸러낼 수 있도록 돕는 실용적인 도구가 됩니다. 주요 기능 추세 탐지 로직: EMA와 HMA 평균을 기반으로 한 3라인 채널. 캔들의 평균 범위를 이용해 상/하단을 동적으로 확장. 변동성에 즉각 대응하며, 압축/확장 및 돌파 가능성을 보여줌. 상승 추세: 종가가 상단 밴드 위에서 마감. 하락 추세: 종가가 하단 밴드 아래에서 마감. 캔들이 자동 색상 변경 (라임 = 상승, 파랑 = 하락). 추세 시작 레벨: 새 추세 시작 시 극단적인 고점/저점 고정. 점선 수평선으로 표시해 재테스트/검증 구역 제공. 시각적 레이아웃: 중앙선: EMA + HMA 평균 (점선). 상단/하단:
Dynamic Swing VWAP
Guillermo Pineda
Dynamic Swing Anchored VWAP 은 실시간 시장 상황에 맞게 설계된 정밀한 가격–거래량 도구입니다. 시간이 지남에 따라 멀어지는 고정 VWAP 과 달리, 이 지표는 새로운 스윙 고점과 저점에 앵커링하며, 변동성에 따라 반응 속도를 조정합니다. 결과 → 가격에 더 밀착된 공정가치 경로를 제공하여, 되돌림/재테스트/평균회귀 기회를 쉽게 식별할 수 있습니다. 핵심 기능 스윙 앵커링: 새로운 피벗마다 VWAP 재설정. 적응형 VWAP 엔진: 최근 데이터에 가중치, 오래된 데이터는 약화. APT 로 조절. 변동성 추적: 고변동 시 빠름, 저변동 시 부드러움. 장점 전통 VWAP 은 거래량 누적으로 가격과 괴리. Dynamic Swing Anchored VWAP 은 피벗 기준 리셋 + 변동성 대응. 거래 활용 공정가치 가이드로 활용. 추세장에서는 매끄러운 되돌림 포착. 입력 값 Swing Period APT ATR 자동조절 Volatility
필터:
리뷰 없음
리뷰 답변