Swing High Low MT4
- 지표
-
Suvashish Halder
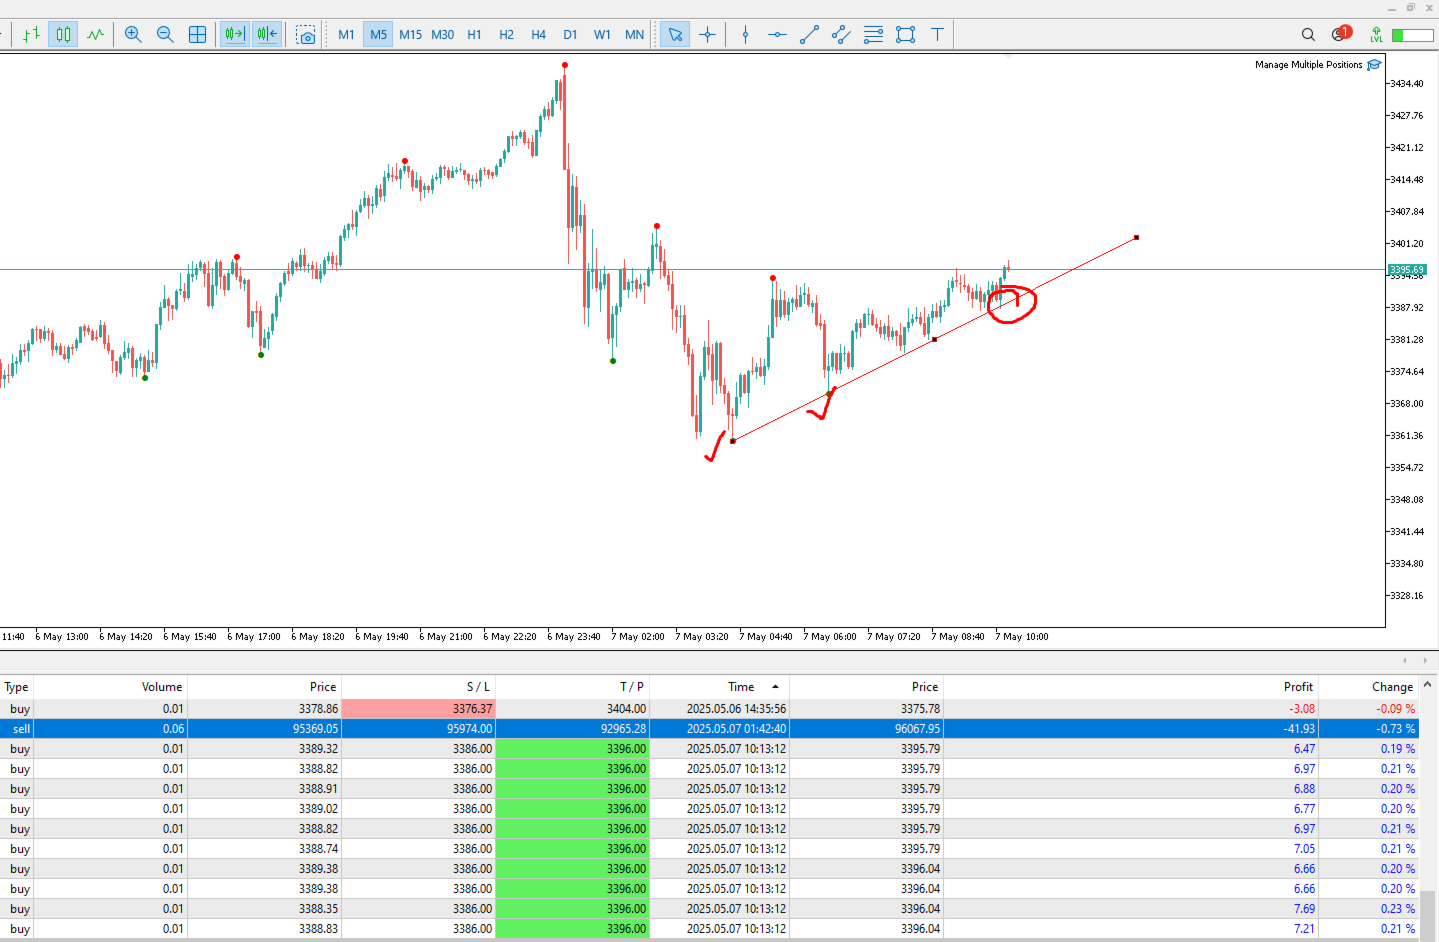
 💧 PRO TIP - Don't Open Orders Where You See, Open Them Where Others Can't!
📈 Decoding Market Phases Like Never Before – The SuvashishFx Revolution! - 버전: 1.0
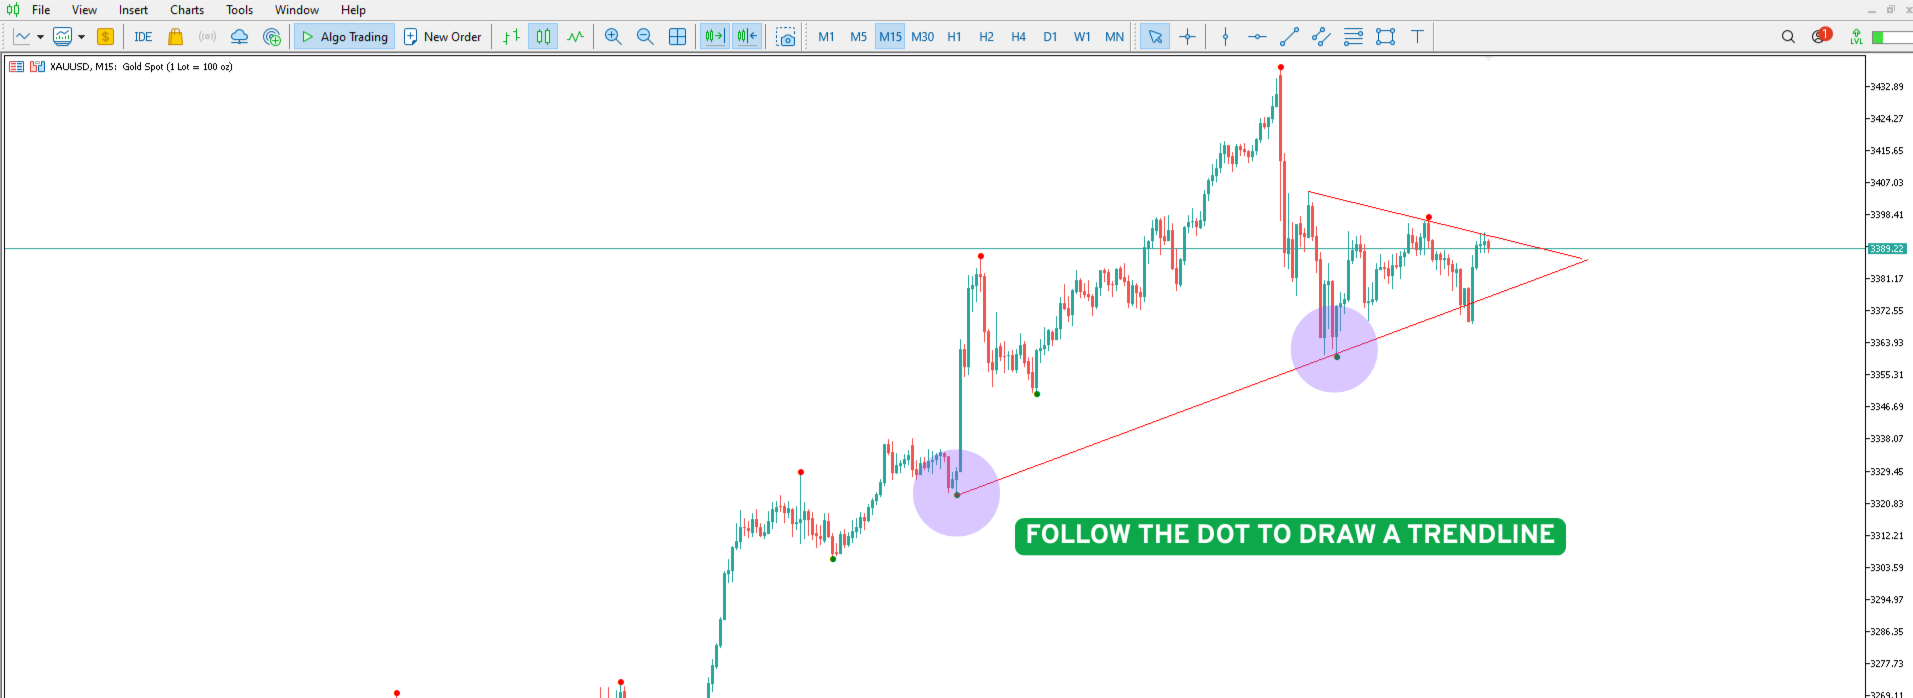
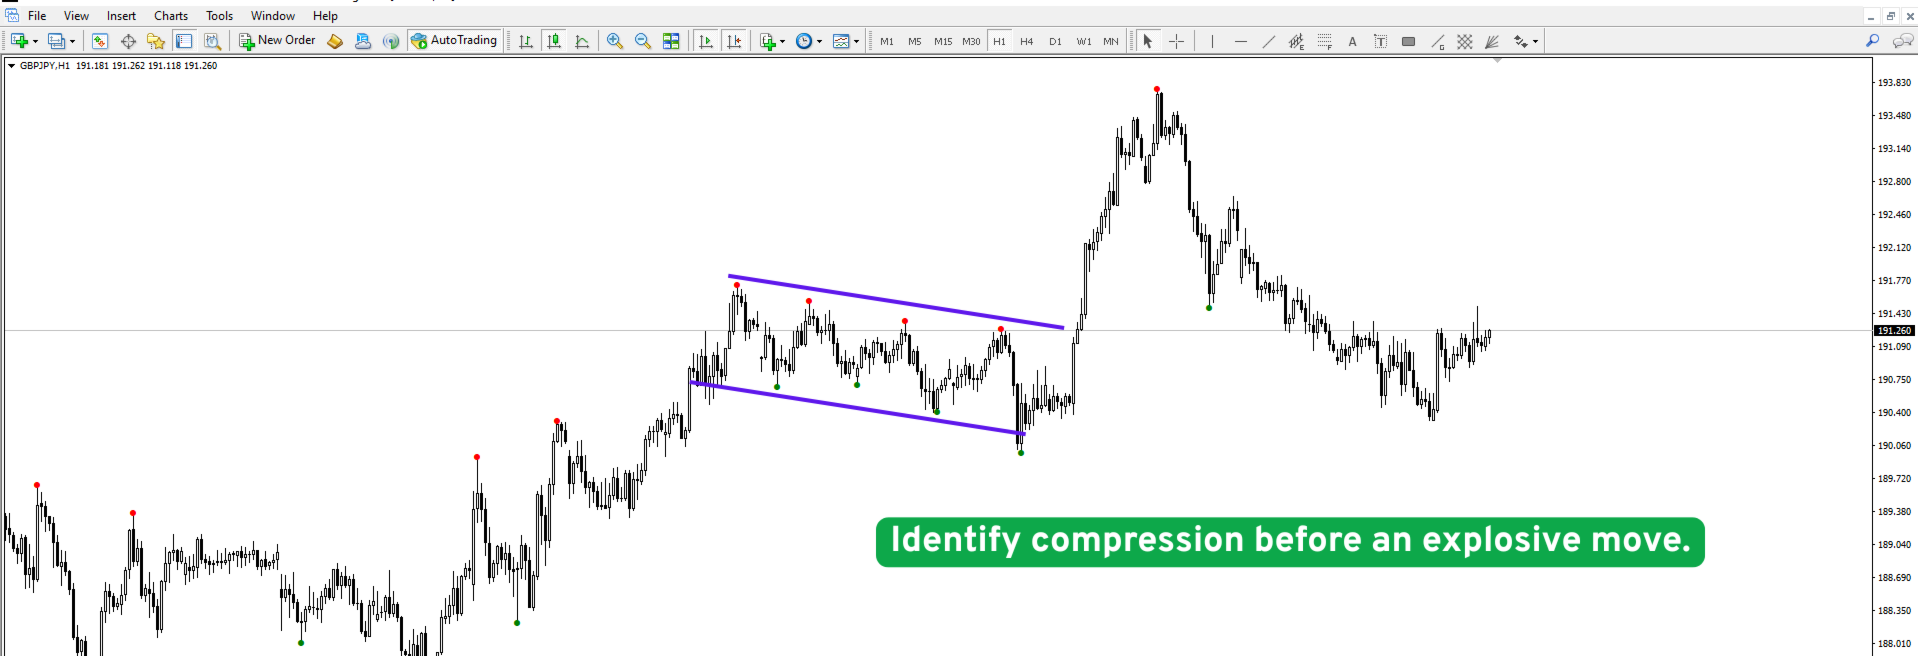
The Swing High Low Indicator is an essential tool for traders who rely on price action. It automatically marks key reversal points (swing highs in red, swing lows in green), helping you visualize trends, spot breakouts, and draw precise trendlines. By highlighting these critical levels, the indicator reveals market structure shifts—whether the trend is strengthening, reversing, or entering consolidation. Perfect for all timeframes and strategies, it turns raw price data into actionable trading signals with clarity and confidence.
MT5 Version - https://www.mql5.com/en/market/product/138184/
Join To Learn Market Depth - https://www.mql5.com/en/channels/suvashishfx
Key Features:
- Automated Swing Detection – Identifies swing highs (red arrows) and swing lows (green arrows) based on customizable left/right bar counts.
- Market Structure Clarity – Reveals higher highs/lower lows (uptrends) or lower highs/lower lows (downtrends) at a glance.
- Precision Trendlines – Connect swing points to draw accurate trendlines (support/resistance).
- Customizable Sensitivity – Adjust LeftBars and RightBars to filter noise (e.g., 15 for daily charts, 5 for scalping).
How Traders Use It:
-
Trend Analysis
-
Example: A series of higher highs + higher lows = strong uptrend (buy dips).
-
Opposite for downtrends.
-
-
Reversal Signals
-
A swing high break after a downtrend = potential bullish reversal.
-
A swing low break after an uptrend = potential bearish reversal.
-
-
Support/Resistance Levels
-
Mark previous swing points as zones for limit orders or stop-losses.
-
-
Chart Patterns
-
Detect head & shoulders, double tops/bottoms using consecutive swings.
-
Why It Stands Out:
✅ No Repainting – Arrows stay fixed once formed.
✅ Multi-Timeframe Friendly – Works on M1 to MN charts.
✅ Visual Simplicity – No clutter, just actionable signals.
사용자가 평가에 대한 코멘트를 남기지 않았습니다