Fibonacci Dimension MT4
- 지표
-
Keni Chetankumar Gajanan -
 Trading forex for the last decade using my own developed indicators, EAs on MT4 and MT5.
Recommended Books to read (My favourites):
1. Trading in the Zone - Mark Douglas
2. Secrets of a Pivot Boss - Franklin O. Ochoa - 버전: 3.3
- 업데이트됨: 17 3월 2026
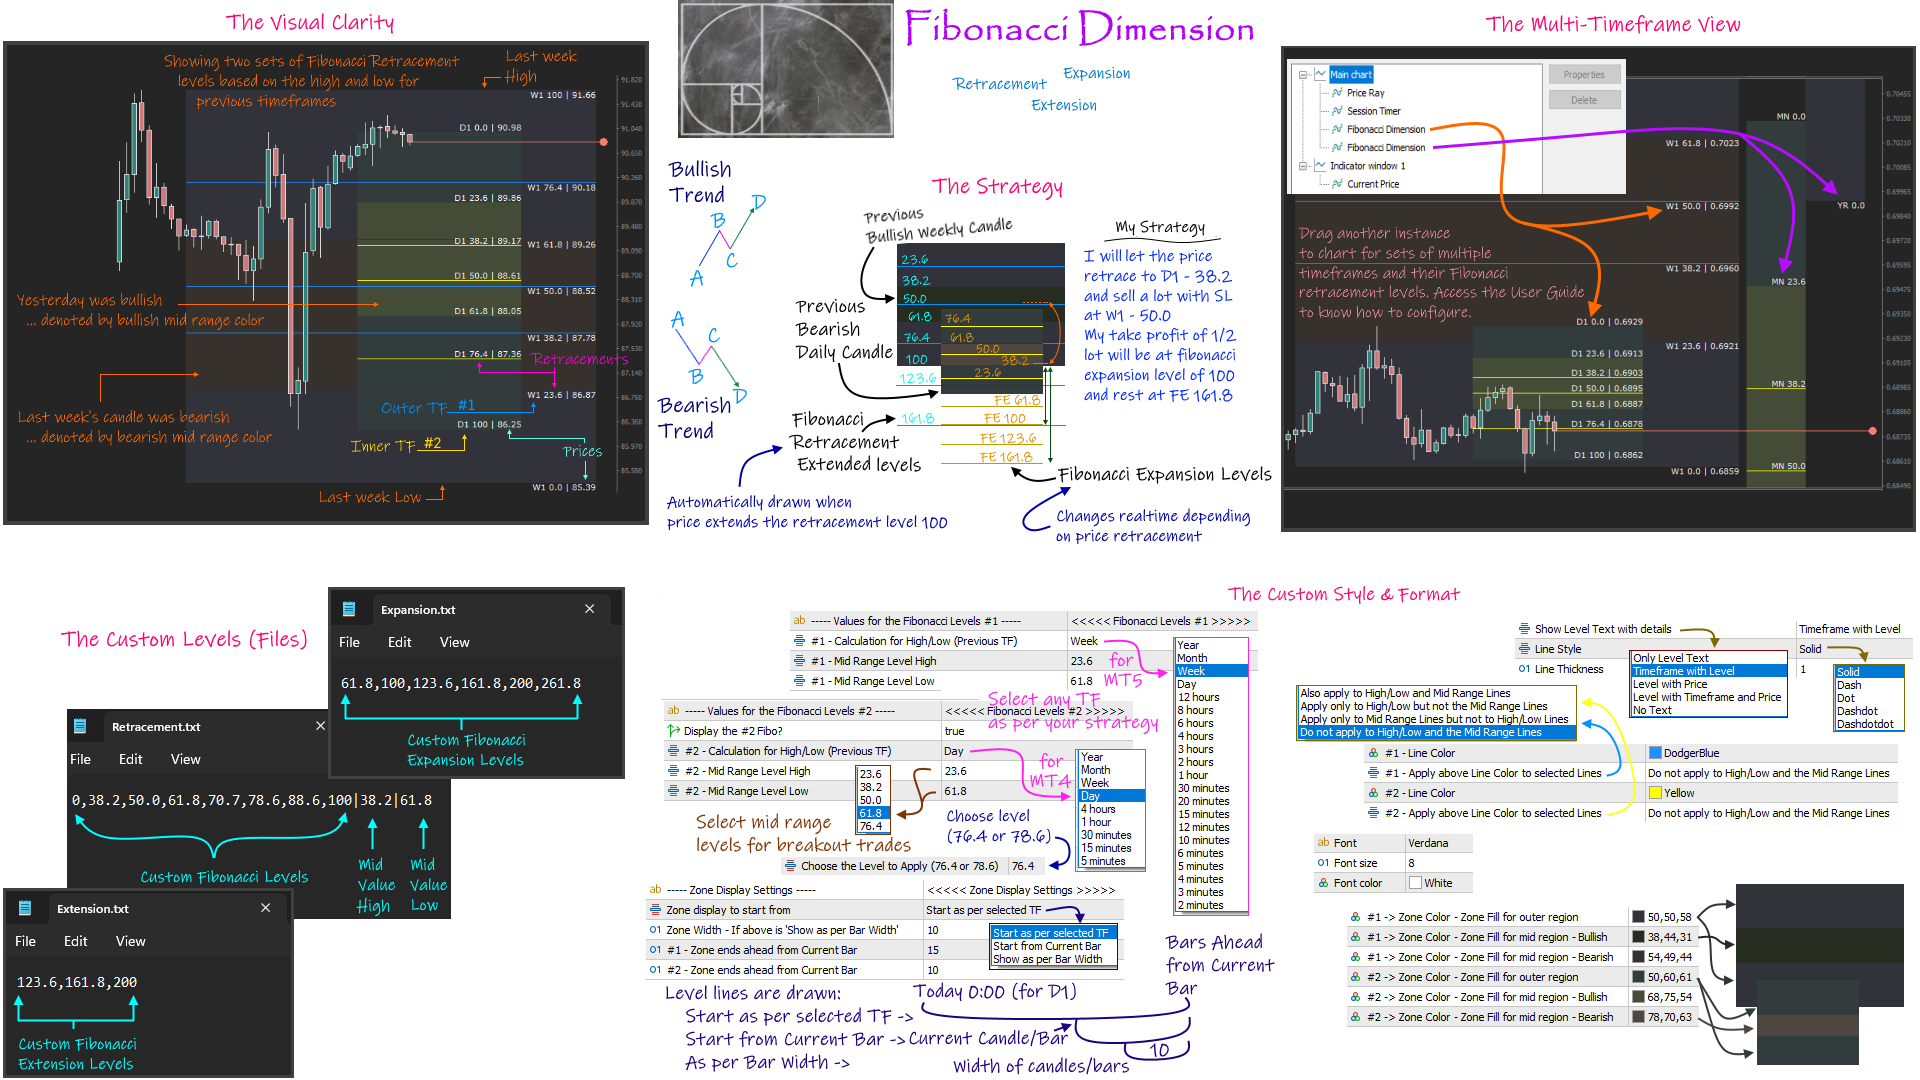
'Fibonacci Dimension' indicator allows display of preset or user-defined multi-timeframe Fibonacci levels. It automatically takes the previous high and low for two user-defined timeframes and calculates their Fibonacci retracement levels. It also considers the retraced level to draw the expansions on every change of price. A complete visual dimension in multiple timeframes allows deriving profitable strategies for execution.
Enhanced functionality to view and customize the default Fibonacci Range using key and mouse click combination (e.g. use Shift key and mouse click together - please refer to User Guide to know more).
The functionalities included are:
- Provides an option to consider a preset or custom Fibonacci levels for retracement, extension and expansion.
- Displays the calculated multi-timeframe Fibonacci levels as a dimension for visual clarity.
- Includes an option to choose the previous ‘Year’ for selection.
- Handles the Sunday candle and adds to the previous Friday to calculate the Fibonacci levels for Monday (Day - D1).
- Able to define a Fibonacci retracement level as the mid-range to be displayed in a different color. The display of mid-range color considers the previous timeframe candle (bullish or bearish).
- Option to have notification alerts on specified timeframe's closing price entry or exit from the mid-range levels. Notification is possible as a sound alert, mobile (MetaTrader app) push notification and an email message.
- Supports multiple instances of the indicator on the chart to display multiple sets of timeframe retracements.
- Allows to toggle the display of extended line till the start of timeframe period.
- Customizable formatting of line, font and colors used by the indicator.
- Option to show timeframe, level text, along with price for each level.
Includes Fibonacci Expansion levels to allow you to strategise your exit of trades. The indicator draws the extended retracement levels in case the price breaks the 100 level.
| Product Links: | User Guide | MT5 version |


It is the best Fibonacci I have found in 5 years of trading. I no longer want to be without it in my daily trading. If you trade with Fibonacci, this is a must. A very big compliment to the programmer and thank you for providing it free of charge.